Univariate Data
1/46
There's no tags or description
Looks like no tags are added yet.
Name | Mastery | Learn | Test | Matching | Spaced | Call with Kai |
|---|
No analytics yet
Send a link to your students to track their progress
47 Terms
bivariate correlations
relationships between 2 distributions of scores
If we sampled the entire population, in theory what kind of distribution would we get?
normal distribution
Most people are __ which is why we see more scores in the center of the x axis
average
What is central tendency?
the tendency of the measures to fall in the center of the distribution
What is the mean?
average score
2 multiple choice options
outliers pull the mean ___ them
towards
1 multiple choice option
What is the median?
middle score
1 multiple choice option
What are outliers?
extreme scores that may skew or flatten distributions of scores so that the distribution is no longer normal
extreme scores ___ distributions of scores
skew or flatten
1 multiple choice option
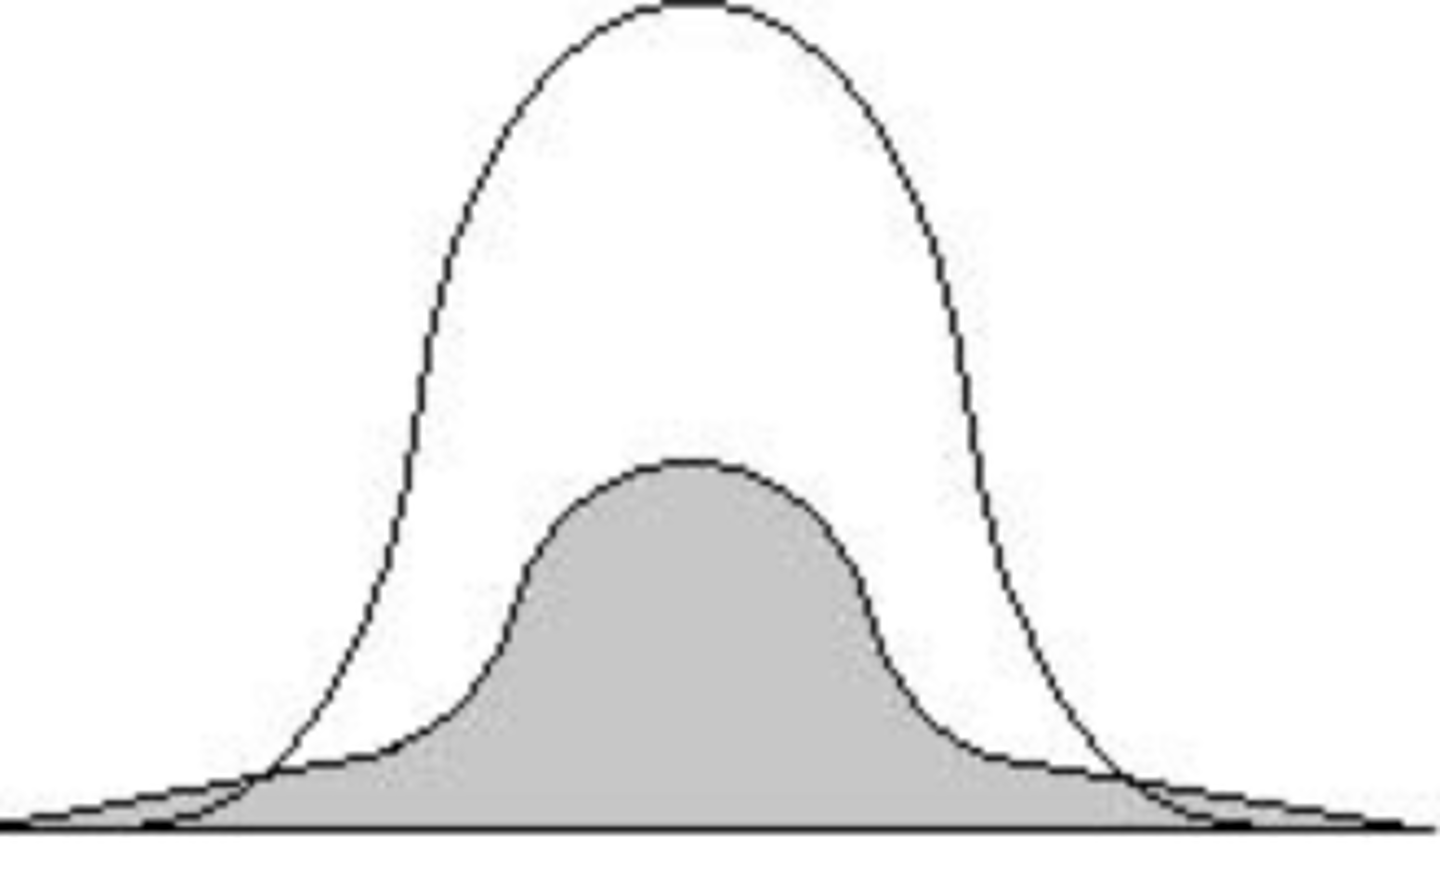
with platykurtic scores, the SD is
higher
1 multiple choice option
with leptokurtic scores the SD is
lower
1 multiple choice option
This is an example of a leptokurtic distribution
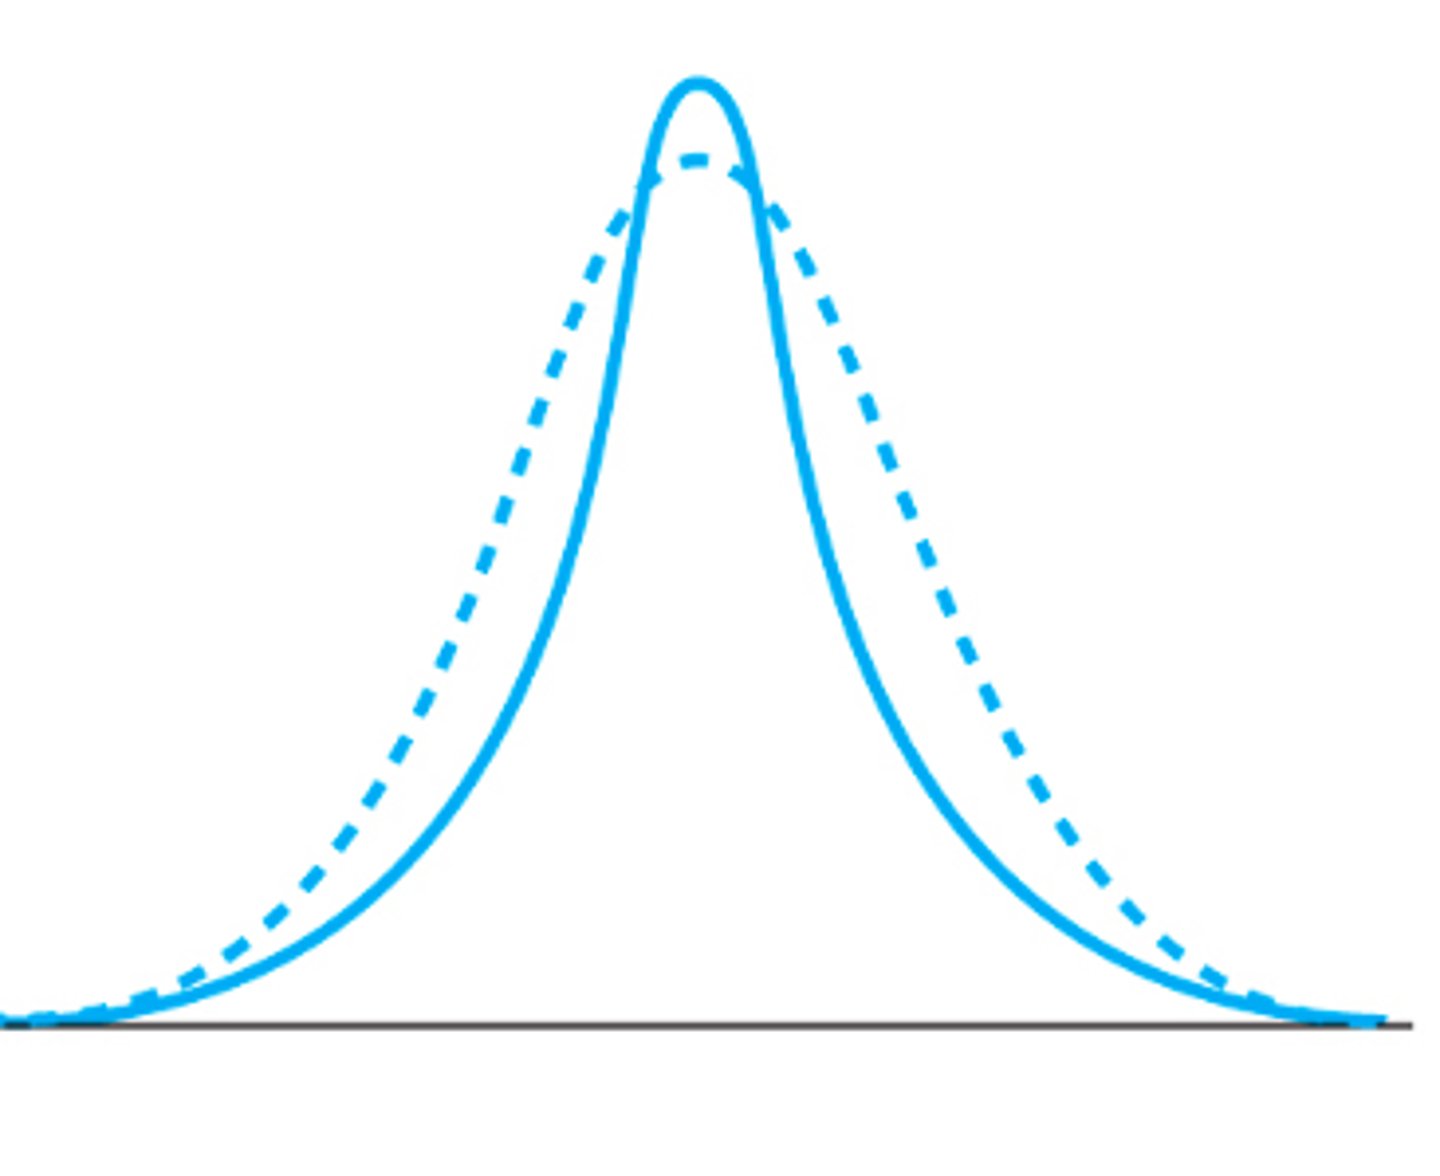
This is an example of a platykurtic distribution
which axis is the frequency of scores on?
y axis
What axis is the outcome measure on?
x axis
symmetrical scores have ___ means and median
equal
1 multiple choice option
This is an example of a negatively skewed distribution
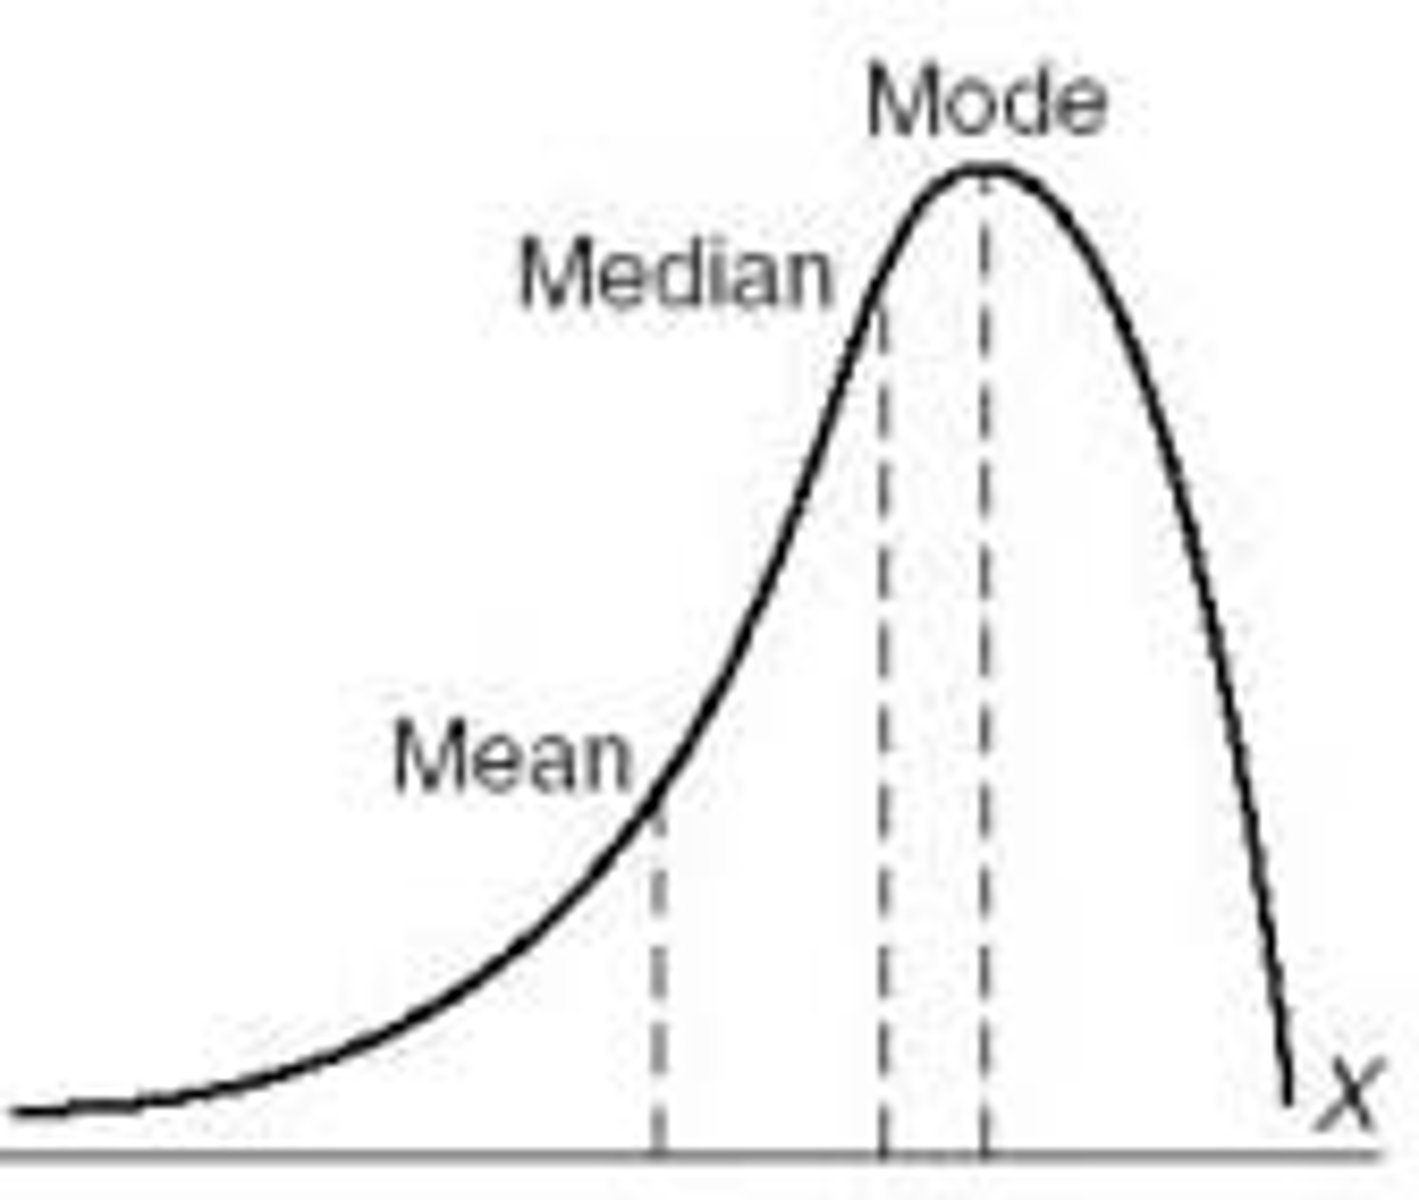
what happens to the mean with negatively skewed distributions
pulled left
1 multiple choice option
if the mean is < the median the distribution is skewed
negatively
1 multiple choice option
lots of scores on the high end of the scale
ceiling effect and negative skew
3 multiple choice options
This is an example of a positively skewed distribution
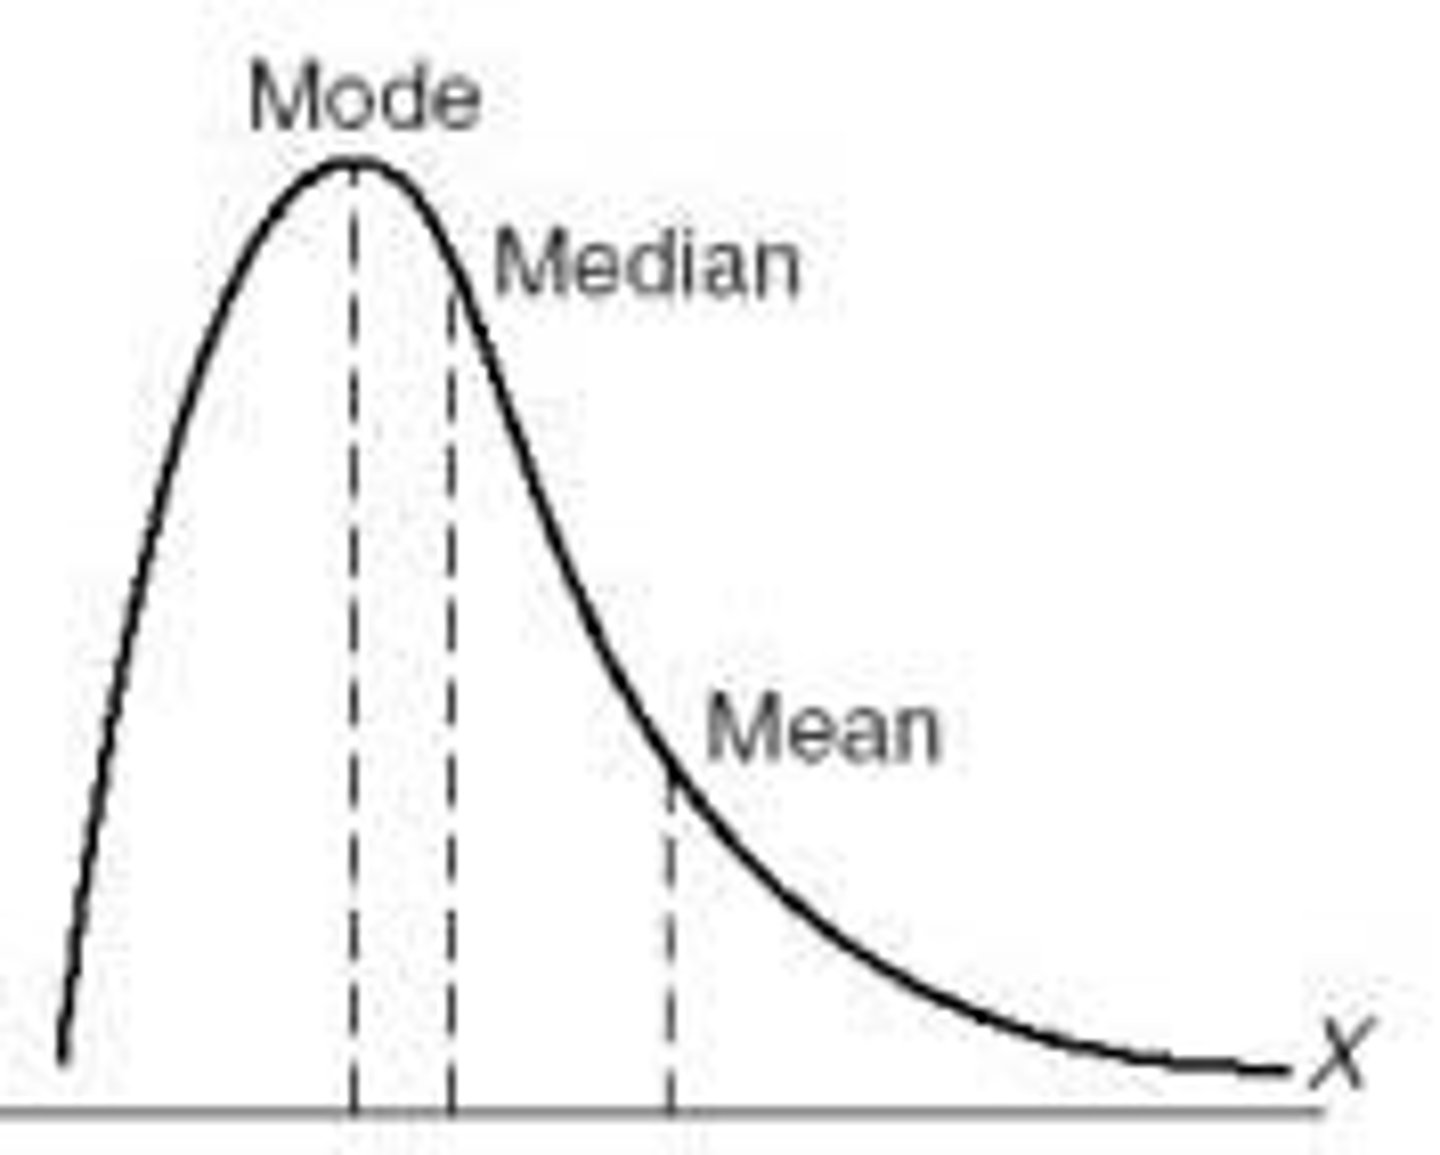
with positively skewed distributions, which way is the mean pulled?
to the right
when there is a high number of low scores
floor effect and positive skew
3 multiple choice options
with positive skewed distributions, the mean is pulled towards abnormally __ scores
high
1 multiple choice option
with negatively skewed deviations, the mean is pulled towards abnormally __ scores
low
1 multiple choice option
what is the range?
distance between minimum and maximum scores
what is the standard deviation?
average variation of each score from the mean
How many SD away from the mean is an outlier?
more than 3 standard deviations
95% of scores is how many SD from the mean?
2 SD
2 multiple choice options
What is a z score?
the number of standard deviations from the mean at which a score is located
What do z scores tell us?
where a particular score is located on a distribution
how do you calculate the Z score from a pts outcome measure results?
Take their score, and subtract the mean. Then divide that by the SD
For a confidence interval to be more confident, it needs to be
Wide
1 multiple choice option
For a confidence interval to be more precise, it needs to be
Narrow
1 multiple choice option
What does a 95% confidence interval mean?
95% confident that the true population mean falls within the range of CI
What does the standard error of the mean tell us
how closely we can estimate the population mean from our sample mean and standard deviation
As sample size increases, what happens to standard error of the mean
SEM decreases
2 multiple choice options
how are sample size and SEM related
inversely
1 multiple choice option
which will always be higher, SD or SEM?
SD
1 multiple choice option
what is the formula for high end of 95% confidence interval
mean + (1.96x SEM)
what is the formula for the low end of 95% confidence interval
mean - (1.96 x SEM)
Large error bars mean SD is
large
Large error bar means spread of scores is
large
1 multiple choice option
What is an error bar
one SEM above ad one below the mean of the sample
When can parametric statistics be run
when data is "fairly normally" distributed
T/F variability is always bad
false
Can we use parametric statistics on skewed data
no
1 multiple choice option