ANOVA
1/21
There's no tags or description
Looks like no tags are added yet.
Name | Mastery | Learn | Test | Matching | Spaced | Call with Kai |
|---|
No analytics yet
Send a link to your students to track their progress
22 Terms
ANOVA
Compare 2 or MORE treatments / groups
Compares groups to see if they are SIGNIFICANTLY DIFFERENT from each other
Shows amount of OVERLAP between Group Variance
Based on VARIANCE instead of Sample Mean Difference
T-Test (ERROR w/ doing MULTIPLE T-Tests)
- Type I Error ← ANOVA adjusts for this
- Slower ← ANOVA is much quicker
- Shows Significance in Mean Difference ← ANOVA shows Overall Significance in Group Differences
ANOVA FORMULA:
F = Variance (DIFFERENCE) between Sample Means / Variance (DIFFERENCE) EXPECTED w/ NO treatment effect
ANOVA Terminology
FACTOR (IV)
Main Variable that splits people into different groups in ANOVA
- What category the subjects are put into
EXAMPLE)
Temperature Condition (50, 70, 90) → Factor = Temperature
Types of Therapy (CBT, Medication, Control) → Factor = Therapy Type
Class Year (Freshmen, Sophomore, Junior, Senior) → Factor = Class Year
LEVELS
Specific groups INSIDE your IV (Factor)
EXAMPLE)
Factor : Temperature
Level : 50, 70, 90
Factor : Class Type
Level : Freshmen, Sophomore, Junior, Senior
Appropriate Research Designs for ANOVA
Independent-Measures
Repeated-Measures
Studies with more than ONE Factor
ANOVA Hypotheses
Null Hypotheses
Treatment has NO effect on Dependent Variable
H_0: μ_1 = μ_2 = μ_3
Alternative Hypotheses
At least ONE Population Mean is Different from Another
H_1: μ_1 ≠ μ_2 ≠ μ_3
H_1: μ_1 = μ_2 ≠ μ_3
ANOVA Logic
Total Variability
Combine ALL the scores into ONE general measure of Variability
Between-Treatment Variability
How DIFFERENT Group Means are from Each Other
- AKA, how much difference exists between the treatment conditions
EXAMPLE)
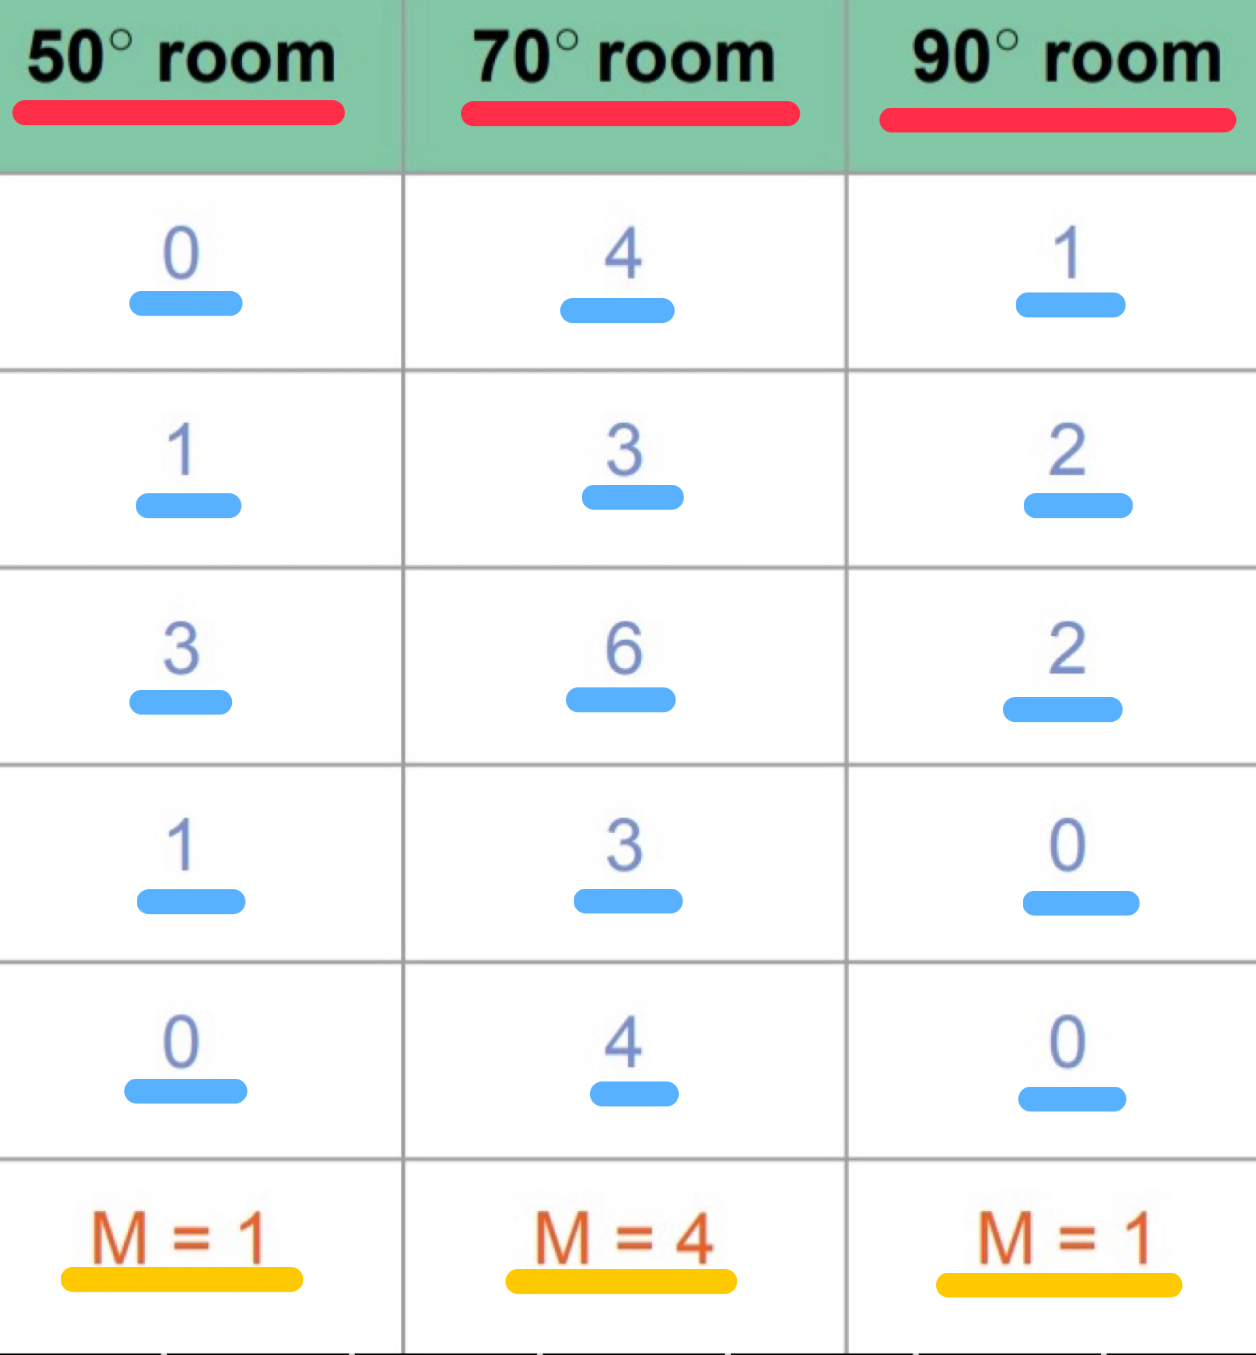
1) 50 Degree room → Mean =1
2) 70 Degree room → Mean = 4
3) 90 Degree room → Mean = 1
70 Degree room has HIGHER Mean → Between-Group Variability BIG
If Groups MEANS are FAR APART → Treatment(Temp.) actually MATTERS
If Groups are CLOSER TOGETHER → Treatment(Temp.) DOESN’T MATTER
- AKA, If all Group MEANS the SAME/CLOSER → Between-Group Variability SMALL/NONE
Within-Treatment Variability
How Much do people Vary INSIDE the SAME GROUP
EXAMPLE)
50 Degree room Scores: 0, 1, 3, 1, 0 … They VARY a LITTLE/SIMILAR (same pattern for other Groups)
People INSIDE Each Group are SIMILAR → Within-Group Variability SMALL
If people INSIDE Each Group VARY a LOT → Within-Group Variability BIG
Explanations of Variability
Systematic Treatment Differences
Differences CAUSED BY Treatment/FACTOR
Group DIFFERED b/c Treatment/FACTOR Had an EFFECT
Random, Unsystematic Differences
Differences CAUSED just b/c people Vary Naturally
Random Noise → NOTHING to do W/ Treatment/FACTOR
- Result of Individual Experiences
- Result of Experimental Error
F-Ratio
GENERAL FORMULA:
F = Variance BETWEEN Treatments / Variance WITHIN Treatments
IT’S ALSO KNOWN AS
F = Systematic Treatment Effects + Random, Unsystematic Differences / Random, Unsystematic Differences
NOTE: Denominator = Error Term
ANOVA Notation … i
Individual
____________________________
Context Example
Factor: Room Temperature
Levels: 50°, 70°, 90°
Each room has 5 scores.
Sample data (same as lecture):
50° room scores: 0, 1, 3, 1, 0
70° room scores: 4, 3, 6, 3, 4
90° room scores: 1, 2, 2, 0, 0
____________________________
(Example: In the 50° room, the score 3 is from person i = 3.)
An Individual’s SPECIFIC SCORE
i = 3
ANOVA Notation … j
Treatment Condition / FACTOR
____________________________
Context Example
Factor: Room Temperature
Levels: 50°, 70°, 90°
Each room has 5 scores.
Sample data (same as lecture):
(1) 50° room scores: 0, 1, 3, 1, 0
(2) 70° room scores: 4, 3, 6, 3, 4
(3) 90° room scores: 1, 2, 2, 0, 0
____________________________
Which Group the SCORE BELONGS TO
EXAMPLE)
j = 1 → 50° room
j = 2 → 70° room
j = 3 → 90° room
ANOVA Notation … k
Number of Treatment Conditions
____________________________
Context Example
Factor: Room Temperature
Levels: 50°, 70°, 90°
Each room has 5 scores.
Sample data (same as lecture):
(1) 50° room scores: 0, 1, 3, 1, 0
(2) 70° room scores: 4, 3, 6, 3, 4
(3) 90° room scores: 1, 2, 2, 0, 0
____________________________
How MANY Groups TOTAL
EXAMPLE)
3 rooms TOTAL → k = 3
ANOVA Notation … n
Number of Scores in Each Treatment Condition
____________________________
Context Example
Factor: Room Temperature
Levels: 50°, 70°, 90°
Each room has 5 scores.
Sample data (same as lecture):
(1) 50° room scores: 0, 1, 3, 1, 0
(2) 70° room scores: 4, 3, 6, 3, 4 → (5 people)
(3) 90° room scores: 1, 2, 2, 0, 0
____________________________
How MANY PEOPLE in Each Group
Each Room HAS 5 PEOPLE → n = 5
ANOVA Notation … N
Total Number of Scores In Entire Study … N = kn
____________________________
Context Example
Factor: Room Temperature
Levels: 50°, 70°, 90°
Each room has 5 scores.
Sample data (same as lecture):
(1) 50° room scores: 0, 1, 3, 1, 0
(2) 70° room scores: 4, 3, 6, 3, 4 → (5 people)
(3) 90° room scores: 1, 2, 2, 0, 0
15 Scores
____________________________
All Scores … N = 3 × 5 = 15
ANOVA Notation … X_ij
“Individual Score”
____________________________
Context Example
Factor: Room Temperature
Levels: 50°, 70°, 90°
Each room has 5 scores.
Sample data (same as lecture):
(1) 50° room scores: 0, 1, 3, 1, 0
(2) 70° room scores: 4, 3, 6, 3, 4 → (5 people)
(3) 90° room scores: 1, 2, 2, 0, 0
15 Scores
____________________________
Putting i and j next to each other (just a label)
EXAMPLE)
Person 5 in 90 Degree (group 3) room Scored 0 → X_53 = 0
reads as “The score from individual 5 in condition 3 is 0” … X_53 = 0
ANOVA Notation … X̄_.j
Mean of a Treatment (Average Score for each j (room/group))
____________________________
Context Example
Factor: Room Temperature
Levels: 50°, 70°, 90°
Each room has 5 scores.
Sample data (same as lecture):
(1) 50° room scores: 0, 1, 3, 1, 0
(2) 70° room scores: 4, 3, 6, 3, 4 → (5 people)
(3) 90° room scores: 1, 2, 2, 0, 0
15 Scores
____________________________
Example)
X̄_.1 (50 Degree room) = 1
X̄_.2 (70 Degree room) = 4
X̄_.3 (90 Degree room) = 1
ANOVA Notation … X̄_..
Mean(Average) of ALL Scores Combined … X̄_.. = 2 → same calc for OG Mean
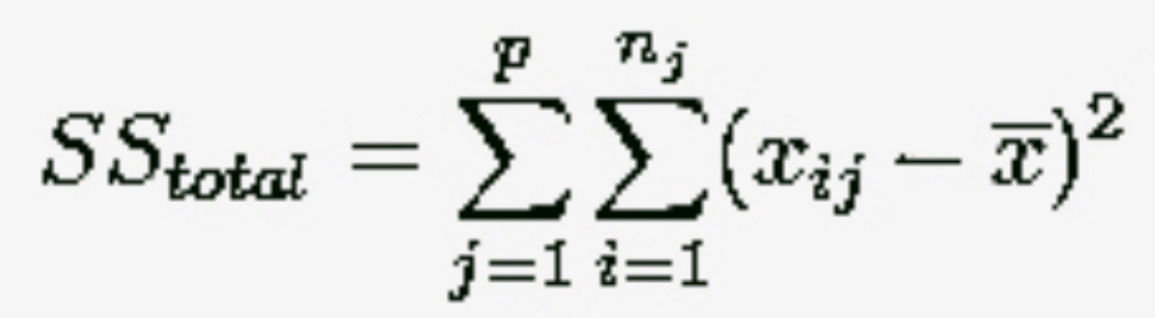
ANOVA Notation … SS_Total Variability
How Much ALL Scores DIFFER from X̄_..
Including STE & RUD
SS_TV = SS_Between + SS_Within
OR
SS_TV = ∑(X_ij -X̄_..)²
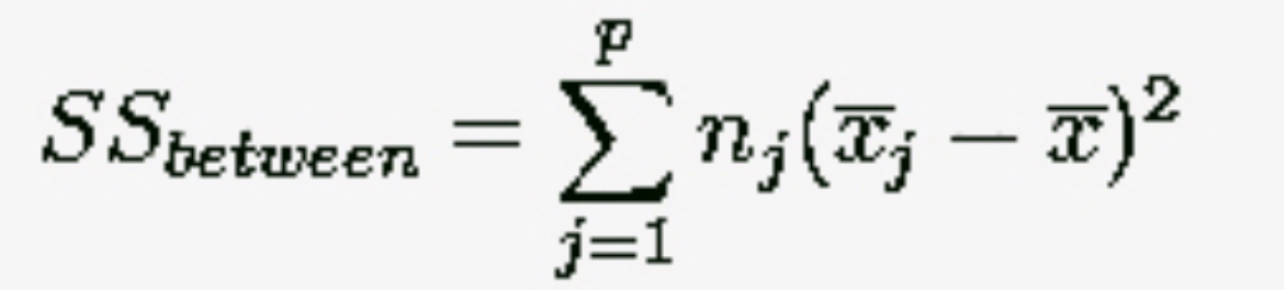
ANOVA Notation … SS_Between
Variability Between Treatments
SS_Between = n∑(X̄_.j - X̄_..)²
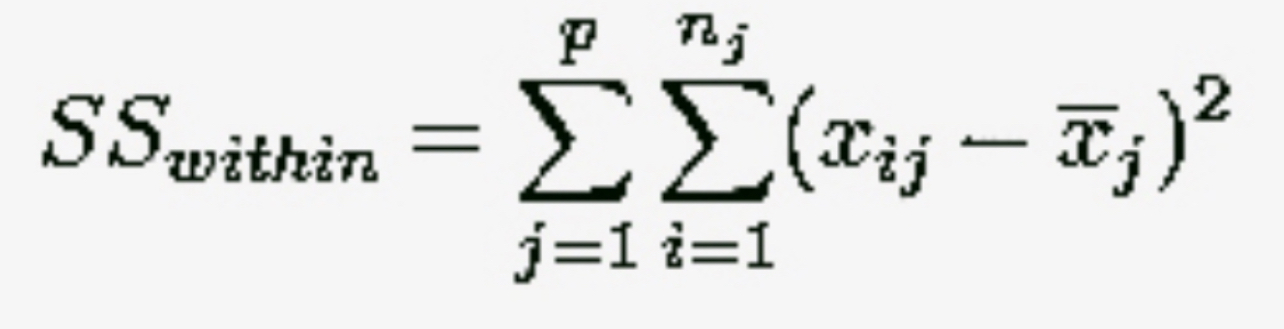
ANOVA Notation … SS_Within
Variability Within Treatments
SS_Within = ∑(X_ij - X̄_.j)²
ANOVA Notation … df
dfbetween = k - 1
dfwithin = k(n -1)
dftotal = kn - 1 … N - 1 … dfbetween + dfwithin
Significant F Statisics
Indicates NOT ALL Population Means are Equal
- μ ≠ μ
- omnibus test
DOESN'T Say WHICH μ are DIFFERENT from each other
Tests SPECIFIC HYPOTHESES … H_1
Planned & Unplanned Comparisons
POST-HOC Tests
Additional Hypotheses Test
- conducted AFTER ANOVA
- Determine EXACTLY WHICH Mean Differences are Significant OR Not
PLANNED COMPARISONS
SPECIFIC Mean Difference that are Relevant to SPECIFIC Hypotheses
- Researcher had in mind BEFORE STUDY was conducted
UNPLANNED COMPARISONS
Making ALL POSSIBLE COMPARISONS
- Chance a Significant Differences will APPEAR
Controlling Error Rates Post Hoc Comparisons
Type I Errors keep INCREASING when we make MULTIPLE COMPARISONS
FAMILYWISE ERROR RATE (FWR)
FWR = 1(1 - α)^k-1
PROBABILITY a Family of Conclusions will Contain at least ONE Type I Error
- Control this ERROR RATE
BONFERRONI α LEVEL
α = α/C
C ← TOTAL NUMBER of Mean Comparisons being Made