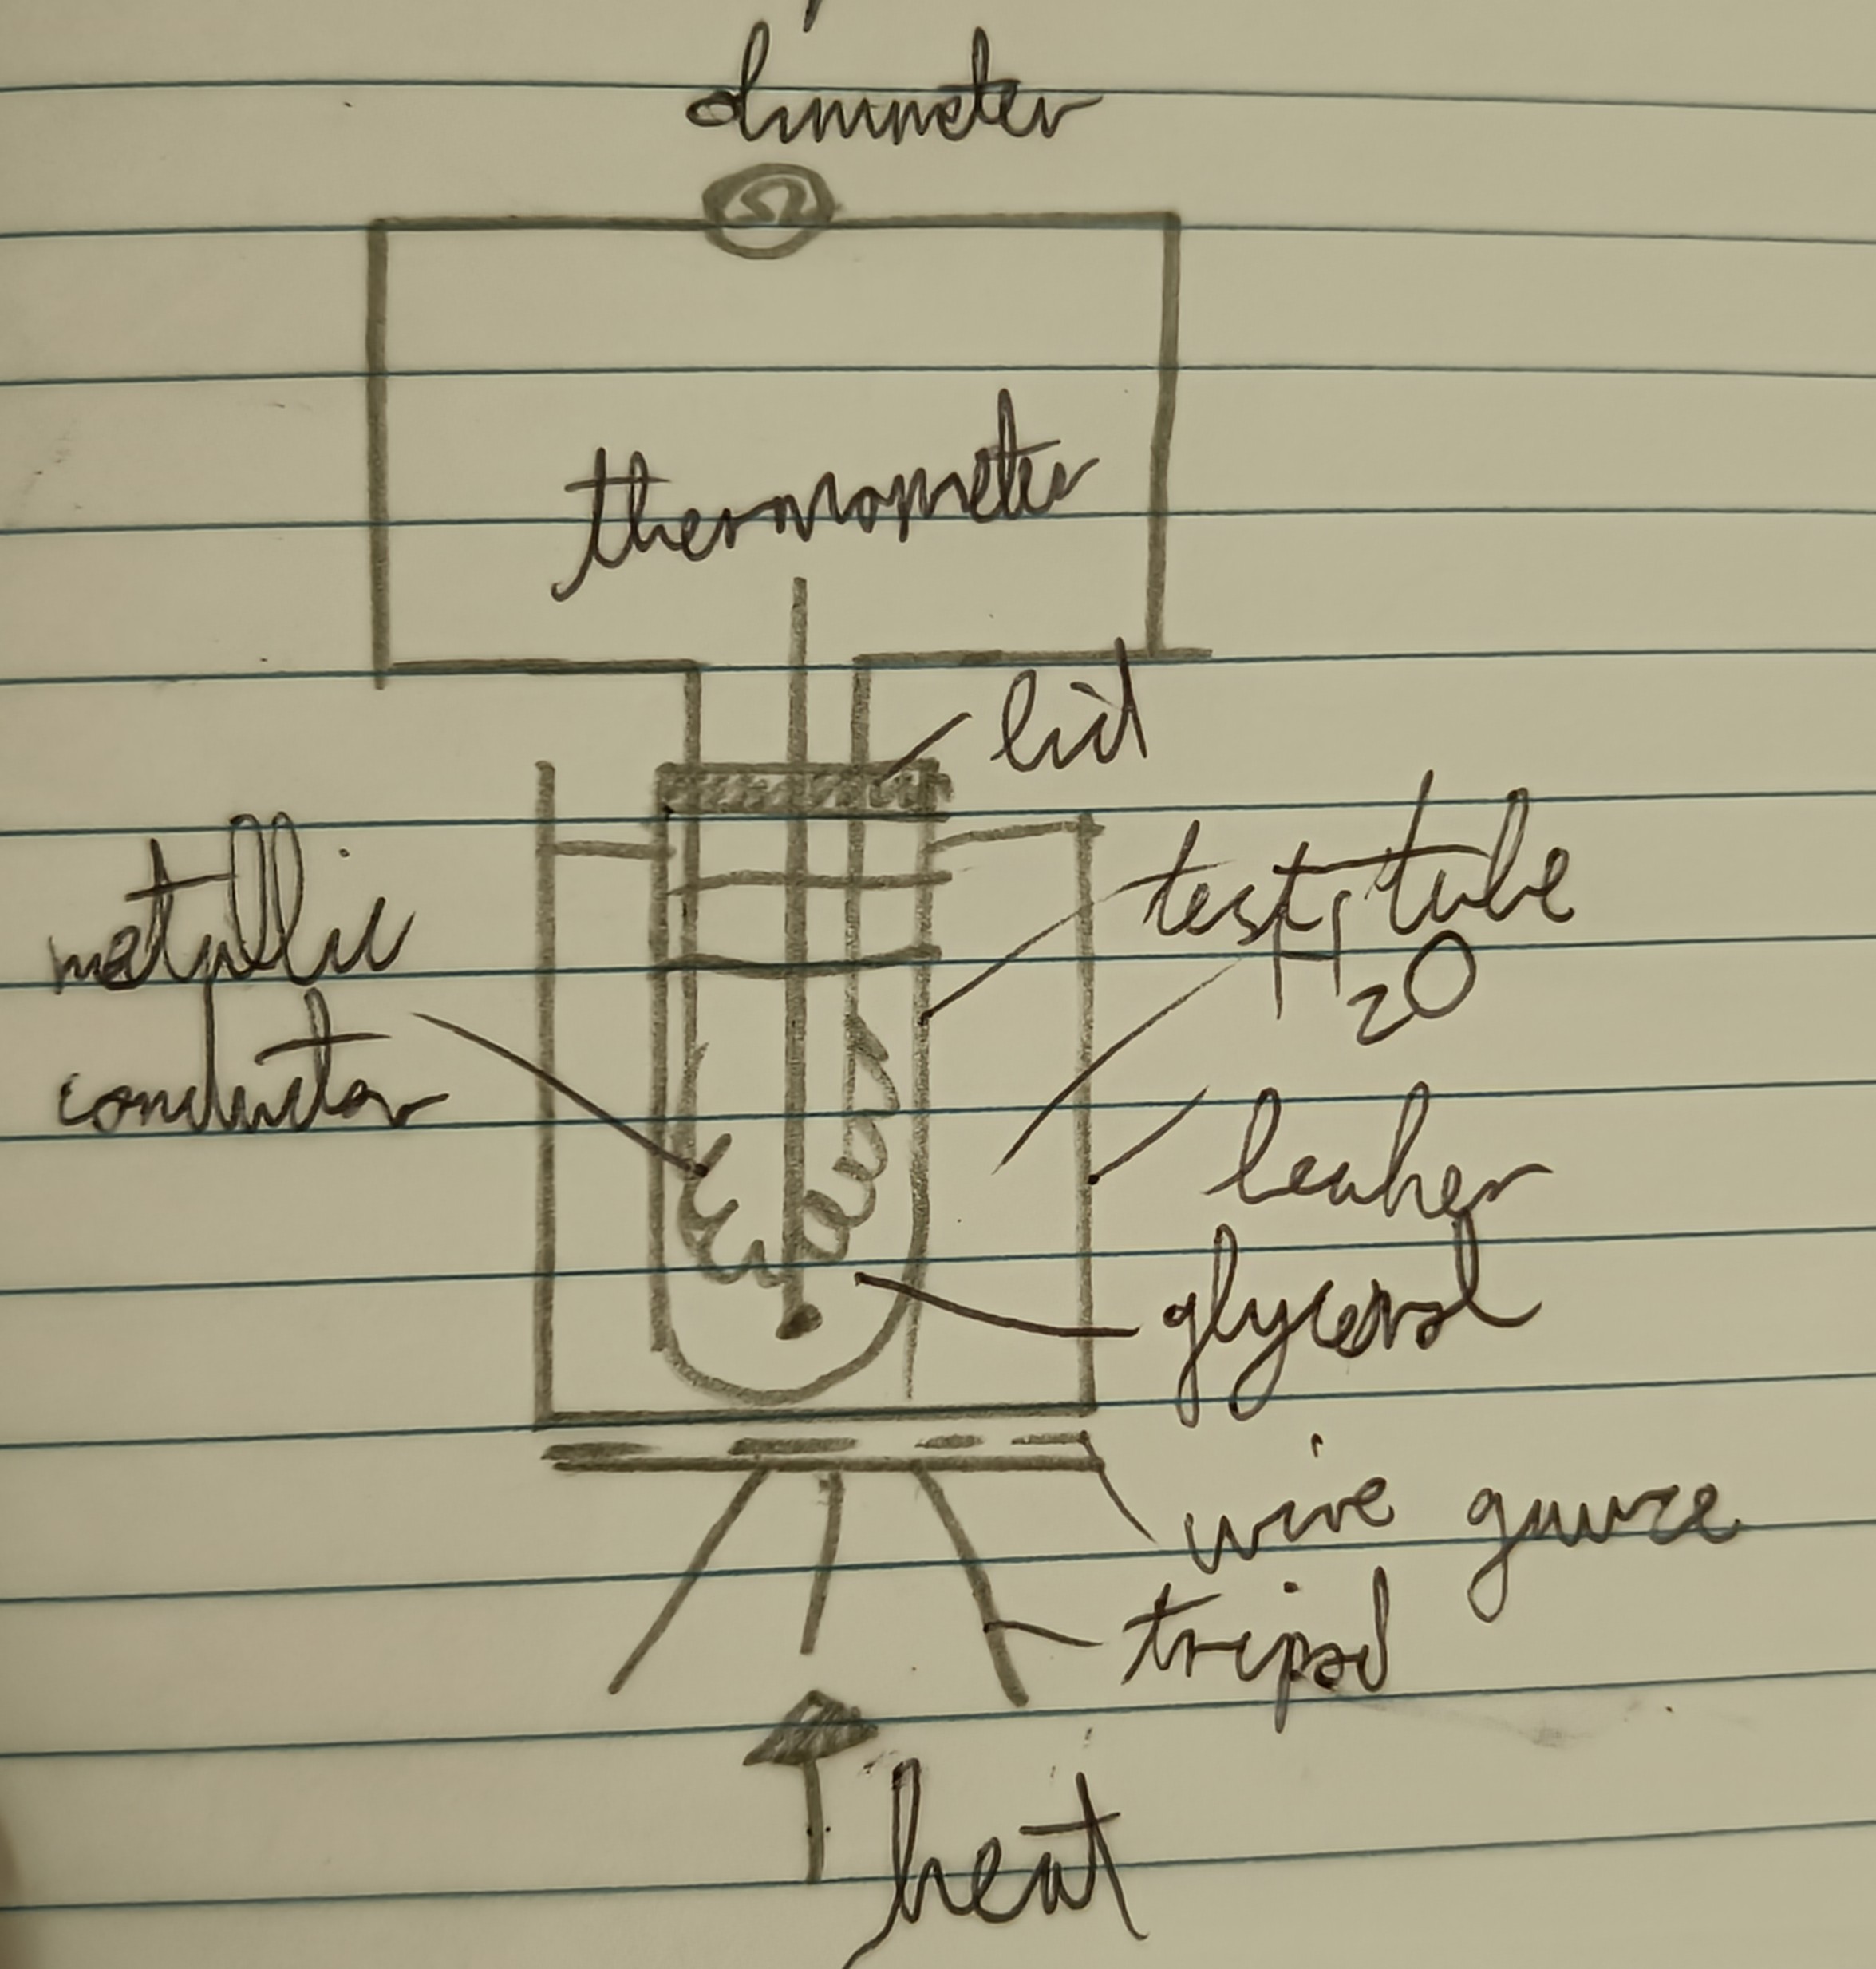
Experiment to investigate the variation of resistance of a metallic conductor with temperature
0.0(0)
Card Sorting
1/5
There's no tags or description
Looks like no tags are added yet.
Last updated 8:54 PM on 5/30/25
Name | Mastery | Learn | Test | Matching | Spaced | Call with Kai |
|---|
No analytics yet
Send a link to your students to track their progress
6 Terms
1
New cards
Draw a diagram of this experiment
2
New cards
Step 1
Set up appartus as shown
3
New cards
Step 2
Record the temperature and the resistance every 10 degrees Celsius
4
New cards
Step 3
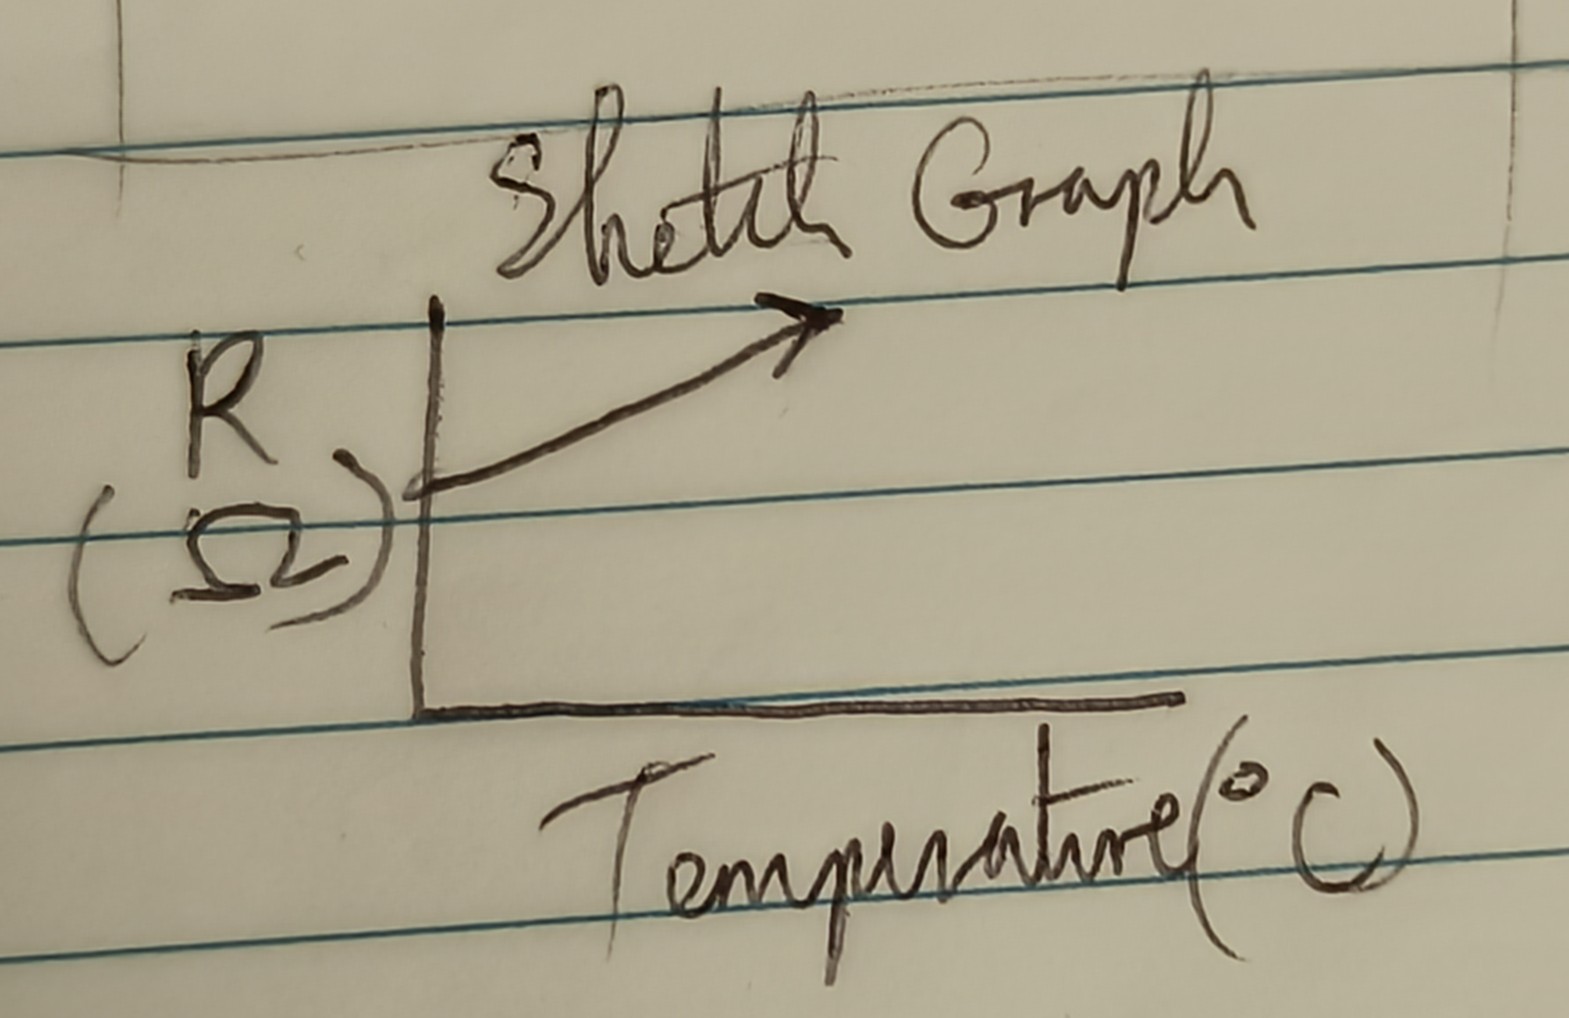
Plot a graph od resistance Vs. temperature
5
New cards
Draw a sketch graph of this experiment
6
New cards
What does glycerol conduct?
Heat but not electricity