Research Methods: Statistics I
1/46
There's no tags or description
Looks like no tags are added yet.
Name | Mastery | Learn | Test | Matching | Spaced | Call with Kai |
|---|
No analytics yet
Send a link to your students to track their progress
47 Terms
What are research methods in neuroscience?
The processes used to answer scientific questions, including:
Formulating hypotheses
Designing experiments
Collecting data
Analysing data using statistics
Modelling neurons
Presenting results clearly so they can be trusted.
What is the main goal of research methods?
To produce scientific results that are accurate, understandable, replicated and reliable.
What do neuron models help scientists do?
They simulate and explain neuronal behaviour using mathematical descriptions.
Why are mathematical models useful in neuroscience?
They help link biological mechanisms with quantitative explanations of neural activity.
Why are statistics needed in biology?
Because biological data always show variation. Statistics help scientists distinguish real biological patterns (signal) from random variation (noise)
What would happen if there were no variation in data?
Statistics would not be needed because all measurements would be identical.
In bioscience, what role do statistics play?
Statistics are a tool used to summarise data and draw conclusions about biological processes.
What two main things do statistics help scientists do?
Summarise data
Make inferences about populations
What are the main steps of the scientific research process?
Observation / literature review
Develop research question
Formulate hypotheses
Derive predictions
Design experiment / plan data collection
Collect data
Summarise and analyse data
Interpret results
At which stage are statistics mainly used in the research process?
During data analysis and interpretation, although they also influence experimental design.
What is a population?
The entire set of units or individuals that share a characteristic being studied.
What is a sample?
A subset of individuals taken from a population to estimate properties of the population.
Why do scientists use samples instead of measuring populations?
Because measuring every individual in a population is usually impossible or impractical.
What is the goal when selecting a sample?
The sample should be representative of the population.
What is a parameter?
A true value describing a population.
Example: population mean.
What is an estimate?
A value calculated from a sample used to approximate a population parameter.
What symbol represents the population mean?
μ (mu)
What symbol represents the sample mean?
x̄ (x-bar)
What symbol represents population variance?
σ²
What symbol represents sample variance?
s²
What important rule about samples should you remember?
Different random samples from the same population will produce different estimates.
How does sample size affect estimates?
Larger sample sizes usually give more accurate estimates of population parameters.
What is a variable?
A characteristic measured on units such as individuals or samples. For example height, weight, age, number of genes
What is a response variable?
The variable that changes in response to another variable and is the outcome being measured.
What is an explanatory variable?
The variable that explains or predicts changes in the response variable.
What are the two main categories of variables?
Numerical (quantitative)
Categorical (qualitative)
What are continuous variables?
Variables that can take any value within a range and are measured. Example:
Height = 170.2 cm
What are discrete variables?
Variables that are counted and take integer values.
Example:
Number of chromosomes.
What are interger values?
What are nominal variables?
Categories without a natural order.
Example:
Eye colour.
What are ordinal variables?
Categories with a natural order.
Example:
Small → Medium → Large.
Why are graphs used in scientific research?
To summarise data visually and reveal patterns or relationships.
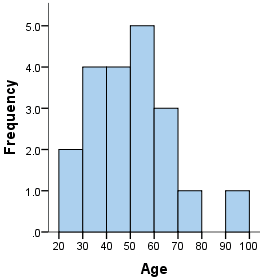
Which graph is used for a single numerical variable?
Histogram
What does a histogram show?
The distribution of numerical data.
Which graphs are used for categorical data?
Bar charts
Pie charts (less common)
Which graph is used for two numerical variables?
Scatterplot
Which graph is used for numerical data across categories?
Bar plot
Box-and-whisker plot
What information does a box plot show?
Median
Quartiles
Spread of the data
Why are box plots useful?
They show variation and distribution, not just averages.
What must every scientific graph include?
Clear axis labels
Units of measurement
A figure legend
Appropriate axis ranges
What is the purpose of a figure legend?
To explain what the graph shows and how data were measured.
What is a random sample? Why is it important?
A sample where every individual in the population has an equal and independent chance of being selected. It prevents bias and makes results more representative.
What is sampling bias?
A systematic difference between the sample estimate and the true population value.
Give an example of sampling bias in animal research.
Risk-taking fish are caught more often than shy fish, so the sample over-represents bold individuals.
How can sampling bias be reduced?
By selecting individuals using random numbers or random selection methods.
Parameter vs estimate?
Parameter = population value, Estimate = sample value.
Continuous vs discrete?
Continuous = measured, Discrete = counted.