Unit 1 & 2: Exploring Data Flash Cards
1/19
There's no tags or description
Looks like no tags are added yet.
Name | Mastery | Learn | Test | Matching | Spaced |
|---|
No study sessions yet.
20 Terms
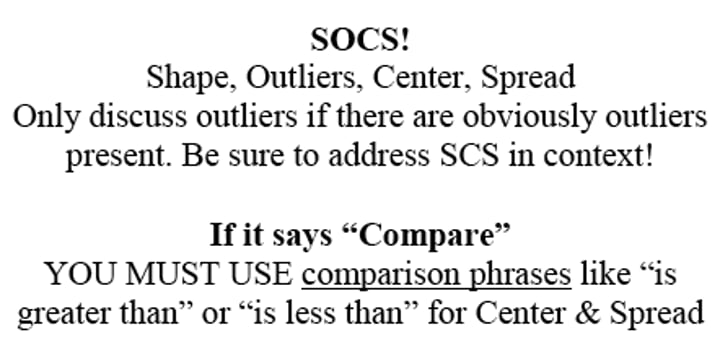
Describe a Distribution
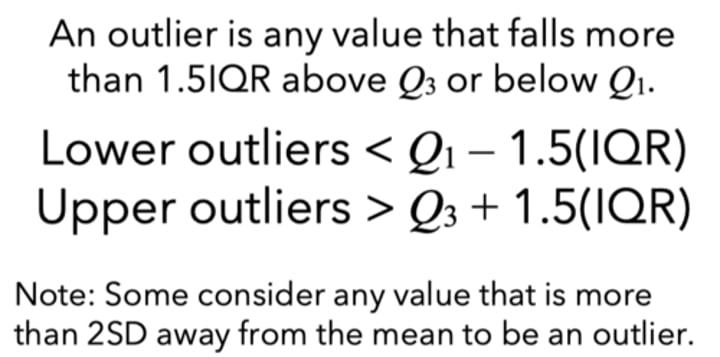
Outlier Rule
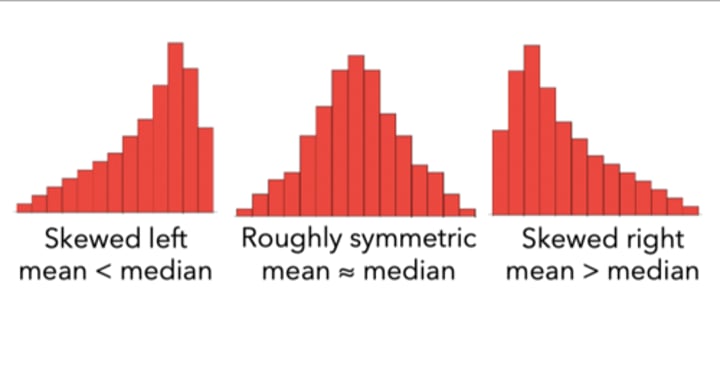
How can we use a graph to compare the mean and the median?
Remember to write "MEAN MEDIAN MODE" and put the inequality between the words in the direction of the skew.
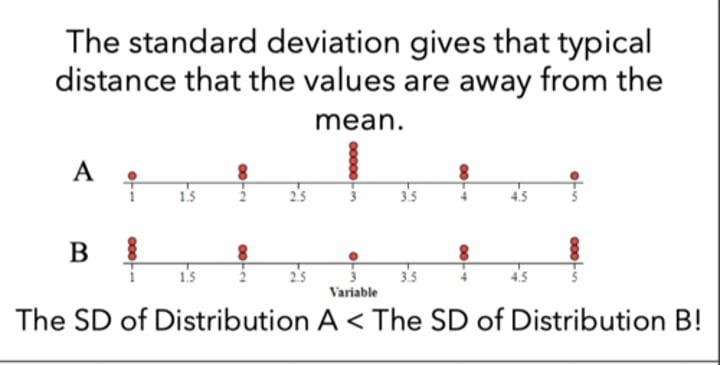
Interpret the standard deviation
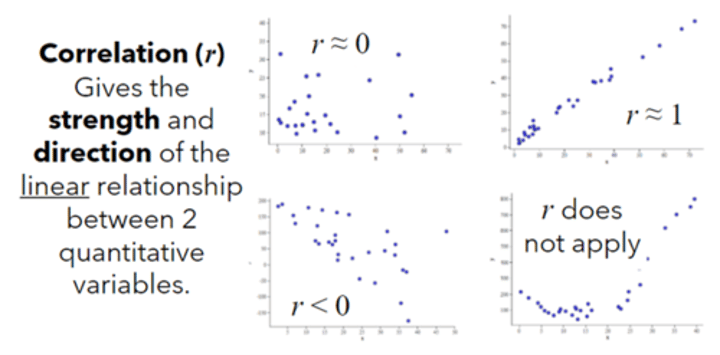
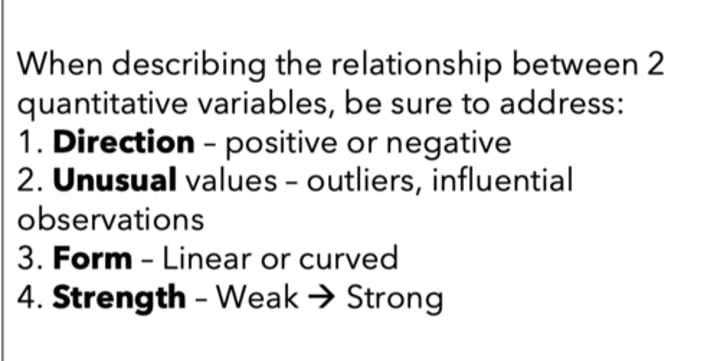
How do we describe the relationship between two variables (like in a scatterplot)?
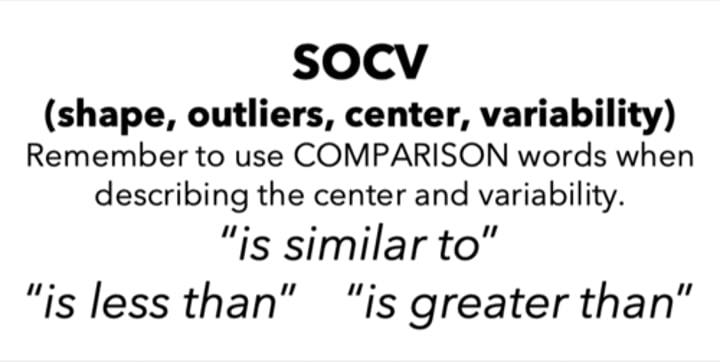
Compare two distributions
COMPARATIVE LANGUAGE!
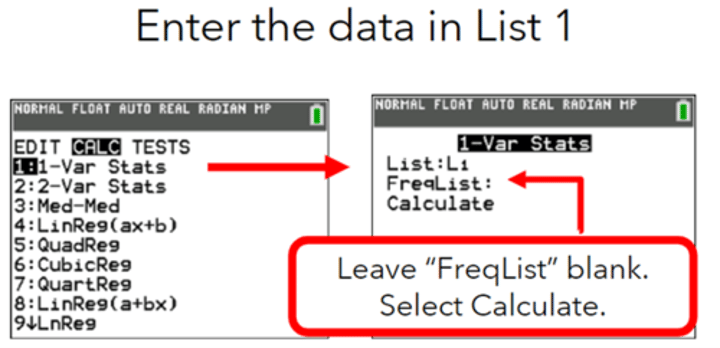
How to find the mean, SD, and 5-number summary using a graphing calculator
1-Var Stats
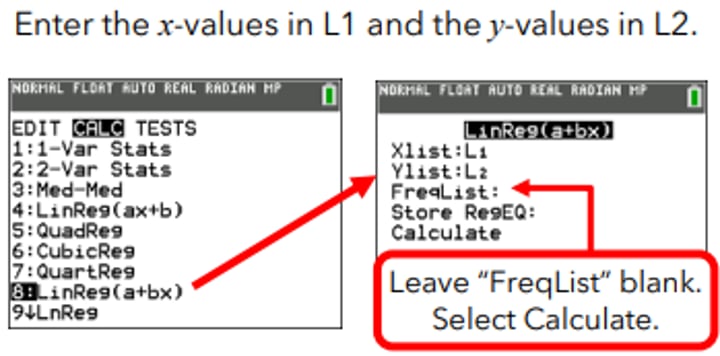
How to calculate a LSRL using a graphing calculator
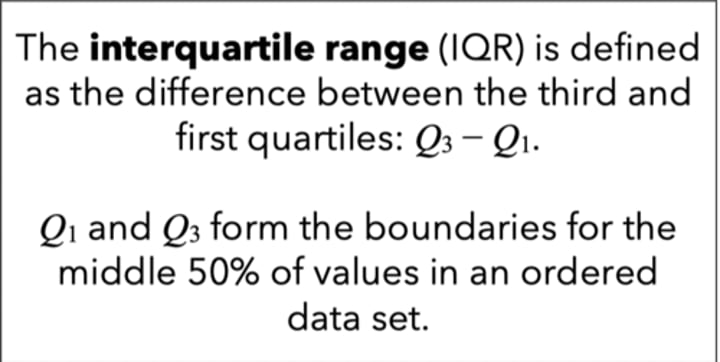
What is the IQR?
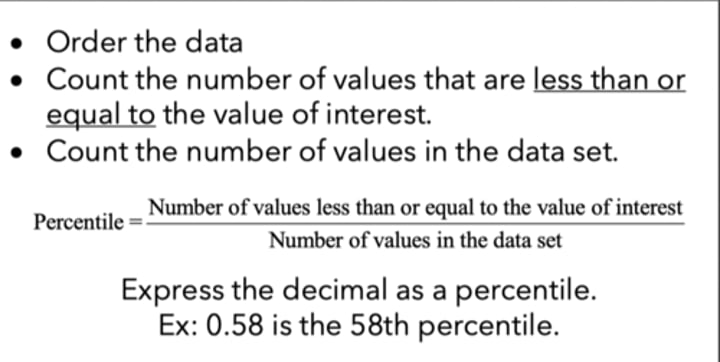
How do I calculate the percentile of a particular value in a data set?
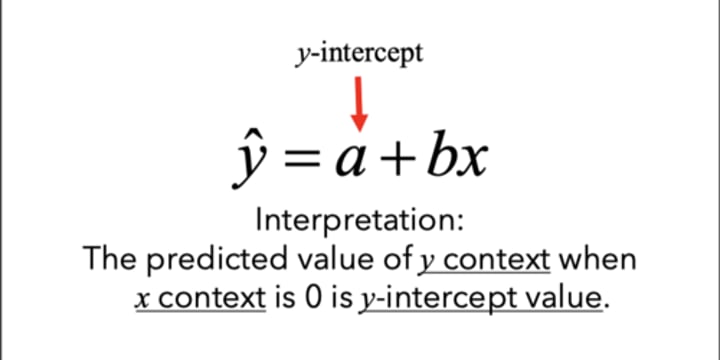
Interpret the y-intercept of the Least Squares Regression Line
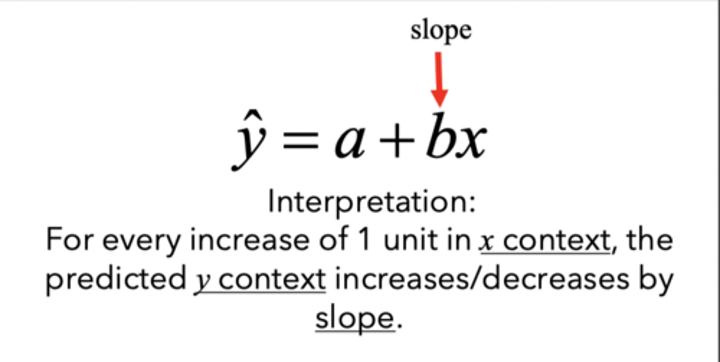
Interpret the slope of the Least Squares Regression Line
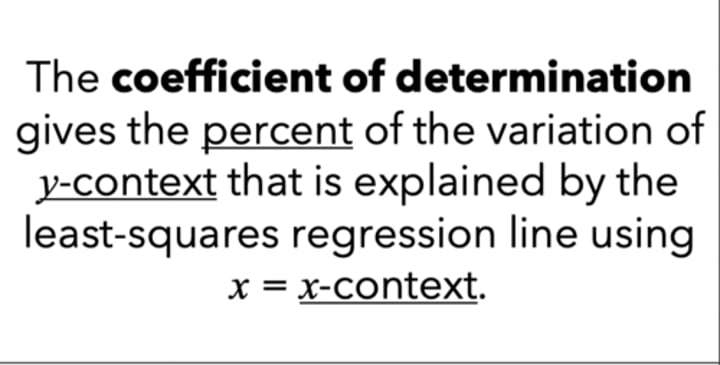
Interpret the coefficient of determination
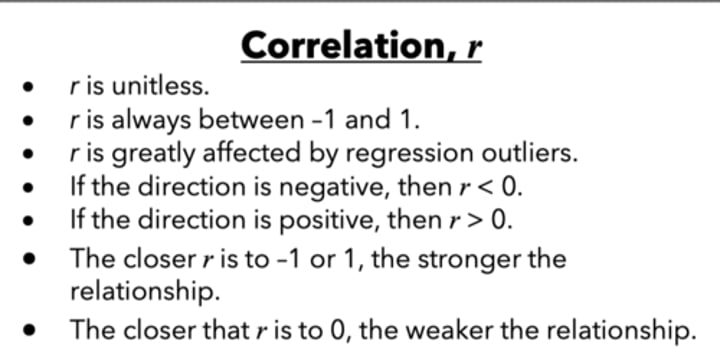
Properties of correlation r
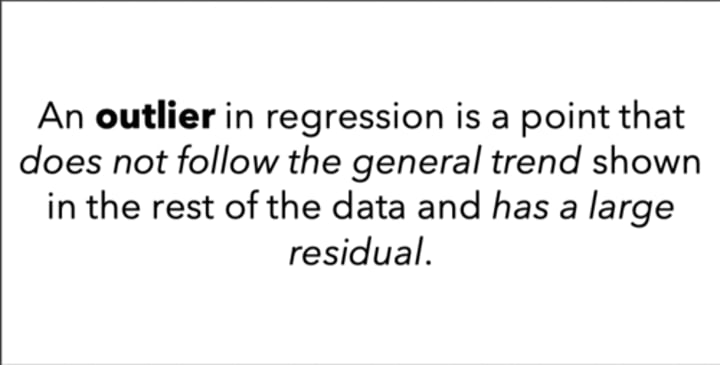
Regression Outlier
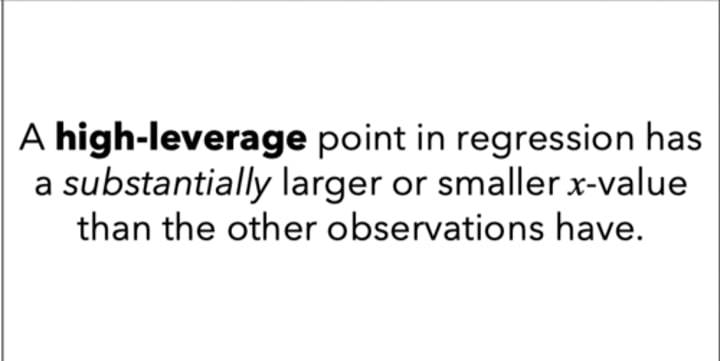
High-Leverage Point
Influential Point
An extreme value whose removal would drastically change the slope of the least-squares regression model.
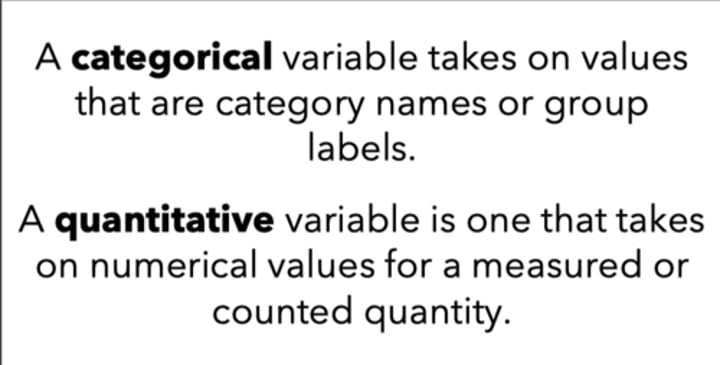
What is the difference between categorical and quantitative variables?
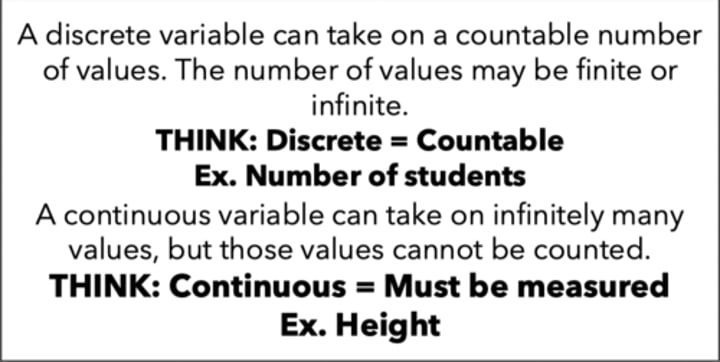
What is the difference between discrete and continuous variables?
Correlation r