Comprehensive Statistics and Research Methods for Psychology and Marketing
1/48
There's no tags or description
Looks like no tags are added yet.
Name | Mastery | Learn | Test | Matching | Spaced |
|---|
No study sessions yet.
49 Terms
Measurement
The process of assigning numbers or labels to objects, events, or people according to specific rules, so their characteristics can be studied.
Nominal Scale
Categories without order (e.g., gender, brand names).
Ordinal Scale
Categories with order, but not equal spacing (e.g., rankings).
Interval Scale
Ordered, with equal spacing, but no true zero (e.g., temperature in °C).
Ratio Scale
Ordered, equal spacing, and a true zero (e.g., income, age).
Experiment
A research method where variables are manipulated to study cause-and-effect.
Independent Variable (IV)
The variable the researcher manipulates.
Dependent Variable (DV)
The outcome measured, affected by the IV.
A/B Tests
A simple experiment comparing two versions (A vs. B) to see which performs better.
Pie Chart
Shows proportions of categories.
Bar Chart
Compares values across categories.
Line Chart
Shows trends over time or continuous data.
Parameter
A value describing a population (usually unknown).
Statistic
A value describing a sample (used to estimate a parameter).
Probability
The likelihood of an event occurring, expressed as a number between 0 and 1.
Proportion
A part of a whole, calculated as k/n (e.g., # successes total trials).
Discrete Variable
Countable number of possible outcomes.
Continuous Variable
Outcome (or value) can take on infinitely many values within an interval.
Discrete Probability Distribution
All the possible values of a discrete random variable, along with their probabilities of happening.
Continuous Probability Distribution
Describes the probabilities of the possible values of a continuous random variable.
Uniform Distribution
All outcomes are equally likely.
Mean
Average value.
Median
Middle value when ordered.
Mode
Most frequent value.
Range
Max - Min.
Variance
Average squared deviation from the mean.
Standard Deviation
Square root of variance; spread around mean.
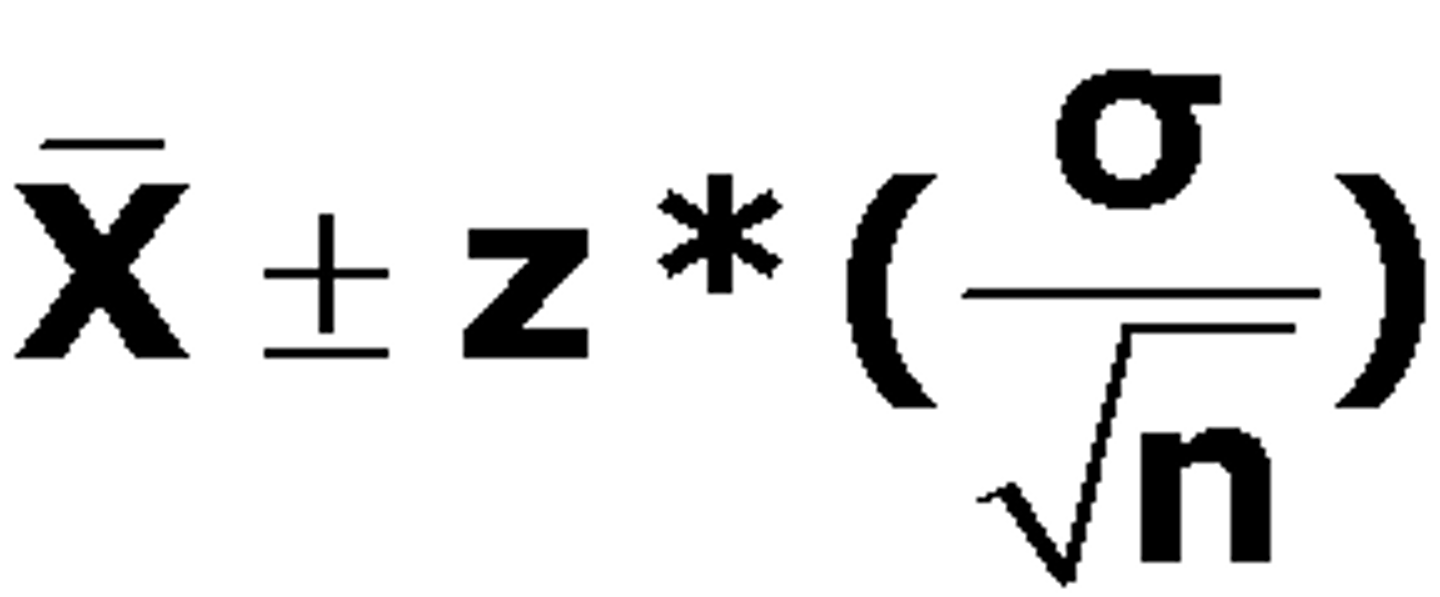
Confidence Interval
A range of values likely to contain the population parameter (e.g., 95% CI for a mean).
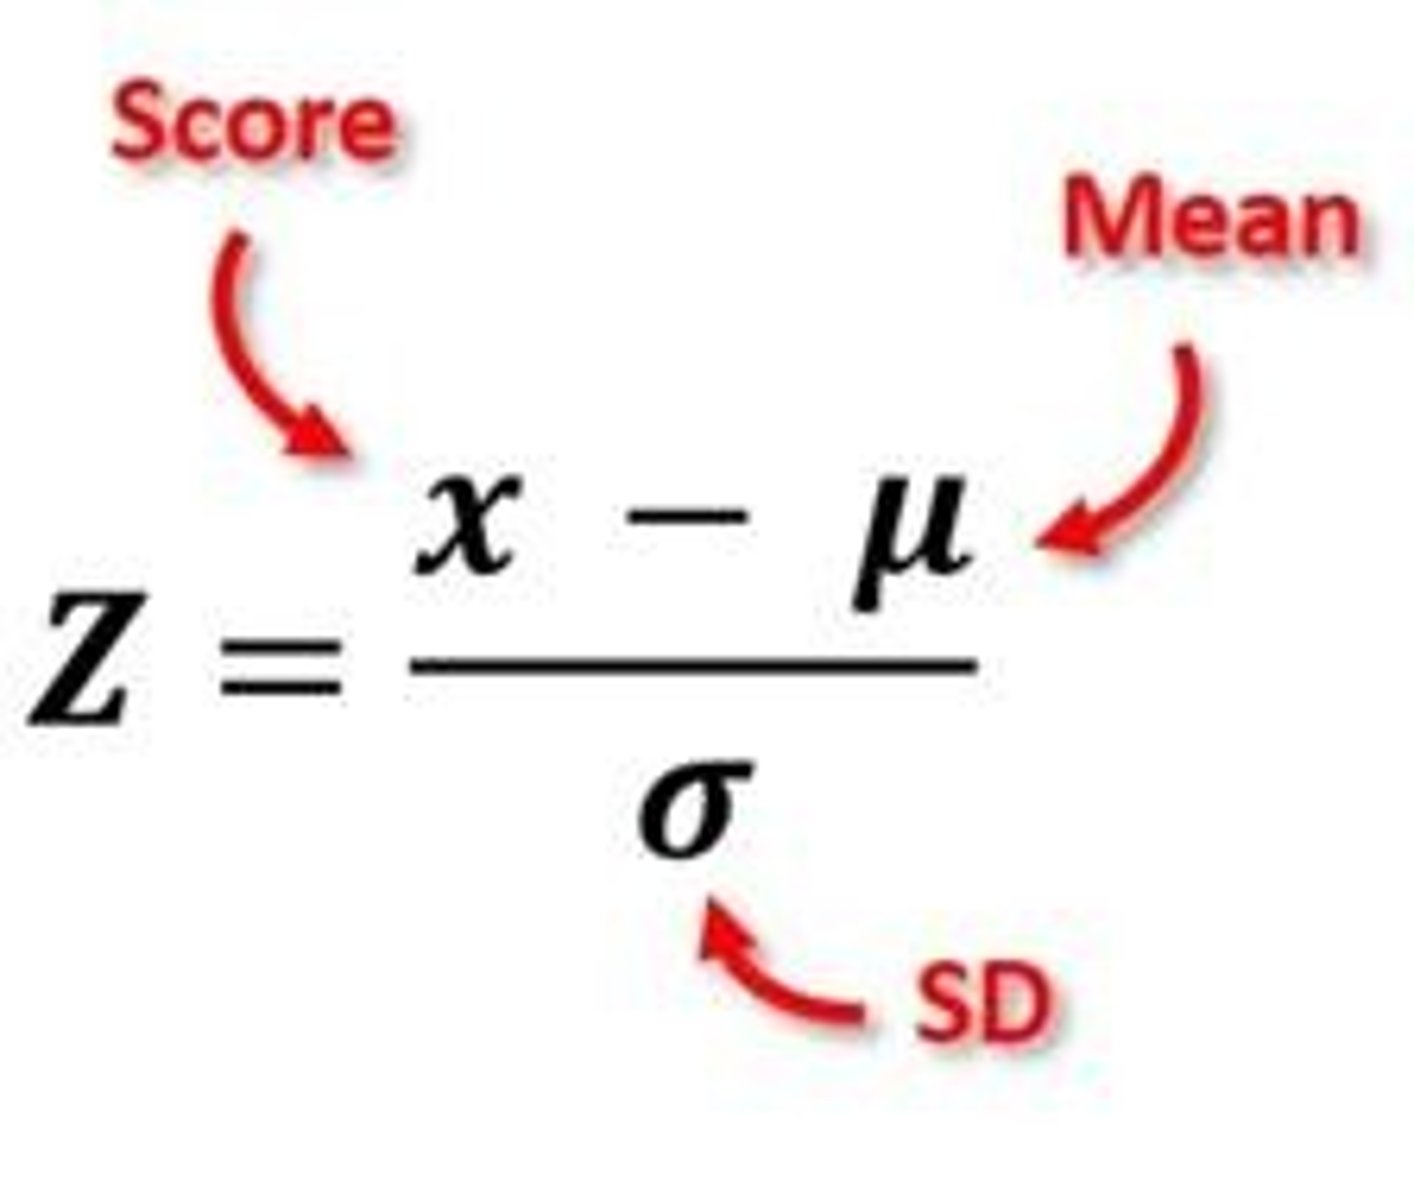
Z-score
Number of standard deviations a value is from the mean.
Normal distribution
A symmetric, bell-shaped distribution defined by mean (center) and standard deviation (spread).
Sampling
Selecting a subset from a population to make inferences about the whole.
Random sampling
Every member has an equal chance of selection.
Non-random sampling
Some members have different chances (e.g., convenience sampling).
Sampling distribution of the sample mean
Distribution of means from many random samples.
Shape of sampling distribution
Normal if sample size is large (central limit theorem).
Mean of sampling distribution
Same as population mean.
Standard deviation of sampling distribution
Smaller than population (depends on sample size).
Standard error
Standard deviation of the sampling distribution.
Central limit theorem (CLT)
The central limit theorem asserts that a distribution of a large, "large" means n ≥ 30, number of sample means or sample proportions will approximate a normal distribution regardless of the actual distribution of the population from which they were drawn.
Student's t-distribution
If n < 30, then we use the t-distribution, which is similar to a normal distribution, but with fatter tails.
t-distribution
A probability distribution similar to normal but with heavier tails; depends on sample size (degrees of freedom).
Hypothesis testing procedure
Specify HO and HA, specify the level of α, use the appropriate formula to calculate the value of the test statistic, compare the calculated value to the critical value in the appropriate table, state the result in terms of either rejecting or failing to reject the null hypothesis.
Null hypothesis (H₀)
Default assumption (no effect, no difference).
Alternative hypothesis (HA)
Competing claim (there is an effect or difference).
Significance level (α)
Threshold for rejecting H₀ (commonly 0.05).
One-tailed test
Used when you believe that the alternative hypothesis can only go in one direction from the null hypothesis.
Two-tailed test
Used when the alternative hypothesis could go either way.
p-value
A computed statistic that tells us the exact probability that this observed result occurred due to chance (random sampling error).
Decision rule for null hypothesis
If p ≤ α, reject H₀. If p > α, fail to reject H₀. (Note: never "accept" H₀, only fail to reject it.)