Microeconomic Exam #1 review
0.0(0)
Card Sorting
1/133
Earn XP
Description and Tags
Last updated 7:53 PM on 3/2/23
Name | Mastery | Learn | Test | Matching | Spaced | Call with Kai |
|---|
No analytics yet
Send a link to your students to track their progress
134 Terms
1
New cards
Scarcity
Scarcity:the limited nature of society’s resources or a low amount of resources or a low supply.
2
New cards
Economics
Economics:the study of how society manages its scarce resources
\
\
3
New cards
Principle 1
People face trade-offs
\
\
4
New cards
Efficiency
Efficiency: the property of society getting the most it can from its scarce resources.
5
New cards
Equality
Equality: the property of distributing economic prosperity or wealth uniformly or equally among the members of society.
\
\
6
New cards
Principle 2
The Cost of Something is What You Give Up to Get it
\
Ex1: The Cost of a sandwich is that you give up $10 from your pocket to get the sandwich
\
Ex1: The Cost of a sandwich is that you give up $10 from your pocket to get the sandwich
7
New cards
Opportunity cost
Opportunity cost: The Cost of Something is What You Give Up to Get it.
\
Ex 1: The opportunity cost of attending the Microeconomic lecture/class is that you can't have lunch at 12:30. You will have an early lunch. In this case, the opportunity cost is less.
\
Ex 2: The opportunity cost of going to a basketball game the evening before a test is you may not do well in the test. In this case, the opportunity cost is high.
\
Ex 1: The opportunity cost of attending the Microeconomic lecture/class is that you can't have lunch at 12:30. You will have an early lunch. In this case, the opportunity cost is less.
\
Ex 2: The opportunity cost of going to a basketball game the evening before a test is you may not do well in the test. In this case, the opportunity cost is high.
8
New cards
Principle 3
Rational People Think at the Margin
9
New cards
Rational people
Rational people: people who systematically and purposefully (thoughtfully, logically) do the best they can to achieve their objectives.
10
New cards
Marginal
Marginal: a small incremental adjustment to a plan of action.
11
New cards
A rational decision maker
A rational decision maker: takes an action if and only if the marginal benefit (MB) is at least as large or equal to the marginal cost (MC). (optimal at MB=MC)
\
Ex:
\-How many cups of coffee should I have this morning?
\-What metric will guide me to an efficient decision?
\
Ex:
\-How many cups of coffee should I have this morning?
\-What metric will guide me to an efficient decision?
12
New cards
Principle 4
People Respond to Incentives
\
Ex 1: price of good rises, consumers will buy less (bad incentive)
\
Ex 2: When an item is on sale or is given at discount, consumers will buy more (products on Amazon, Target etc.) (good incentive)
\
Ex 1: price of good rises, consumers will buy less (bad incentive)
\
Ex 2: When an item is on sale or is given at discount, consumers will buy more (products on Amazon, Target etc.) (good incentive)
13
New cards
Principle 5
Trade Can Make Everyone Better Off.
14
New cards
Principle 6
Markets Are Usually a Good Way to Organize Economic Activity
15
New cards
Market economy
Market economy: an economy that allocates resources through the decentralized decisions of many organizations/firms and households as they interact in markets for goods and services. Examples of market economies: United States, India, England, all European Countries, Brazil, Argentina etc.
Examples of non-market economies: China, Cuba, North Korea ...
\
\-Case 1: If Supply < Demand , P (?) (Prices will go up)
\
\-Case 2: If Supply > Demand, P (?) (Prices will go down)
\
\-Case 3: If Supply =Demand, it is called "market equilibrium"
Examples of non-market economies: China, Cuba, North Korea ...
\
\-Case 1: If Supply < Demand , P (?) (Prices will go up)
\
\-Case 2: If Supply > Demand, P (?) (Prices will go down)
\
\-Case 3: If Supply =Demand, it is called "market equilibrium"
16
New cards
Principle 7
Government Can Sometimes Improve Market Outcomes
17
New cards
Property
Property: the ability of an individual to own and exercise control over scarce resources.
18
New cards
Market failure
Market failure: a situation in which a market left on its own fails to allocate resources efficiently.
Ex: 1. Externality: the impact of one person's actions on the well-being of a bystander.
Example (?)
\
2\. Market power: the ability of a single economic actor (or small group of actors) to have a substantial influence on market prices.
Ex: 1. Externality: the impact of one person's actions on the well-being of a bystander.
Example (?)
\
2\. Market power: the ability of a single economic actor (or small group of actors) to have a substantial influence on market prices.
19
New cards
Principle 8
A Country's Standard of Living Depends on Its Ability to Produce Goods and Services
20
New cards
Productivity
Productivity: the quantity of goods and services produced by each unity of labor input. (high productivity implies a high standard of living)
21
New cards
Principle 9
Prices Rise When the Government Prints Too Much Money
22
New cards
Inflation
Inflation: an increase in the overall level of prices in the economy.
23
New cards
Principle 10
Society Faces a Short-Run Trade-Off between Inflation and Unemployment
24
New cards
Applications of Economic Theory
\
Application of Economic Theory:
\-economic models are used to analyze real-world issues
Steps to develop a model:
\
1\. Decide on the assumptions developed in the model
\
2\. Formulate a testable hypothesis
\
3\. Use economic data to test the hypothesis
\
4\. Revise the model if it fails to explain the economic data well
\
5\. Revisit model to help answer similar economic questions in the future.
25
New cards
Multiple Linear Regression
\
Multiple Linear Regression:
Expectation: there would be a significant relationship between the annual income and one or more of the other variables. There was no clear expectation about the relationship between income and family size. However and in particular, it was believed that, on an average, there is a positive relationship between income and
\
Ex:
\- educational level,
\
\-tenure with an employer (seniority),
\
\-age, and size of residence.
\
Here income is treated as the dependent variable, and all other variables are considered to be independent variables.
26
New cards
Economic Models: Assumptions and Key Questions
Economic Models: Assumptions and Key Questions:
__3 Economic Ideas:__
1. People are rational
2. People respond to economic incentives
3. Optimal decisions are made at the margin
__3 Economic Ideas:__
1. People are rational
2. People respond to economic incentives
3. Optimal decisions are made at the margin
27
New cards
* Economic Questions
Economic Questions:
What goods and services will be produced?
How will goods and services be produced?
Who will receive the goods and services produced?
\
What goods and services will be produced?
How will goods and services be produced?
Who will receive the goods and services produced?
\
28
New cards
Market
Market: A group of buyers and sellers of a good or service and the institution or arrangement by which they come together to trade.
29
New cards
People are Rational
People are Rational: Economists assume consumers and firms *use all available information* as they act to achieve their goals. Rational individuals weigh the benefits and costs of each action, and they choose an action only *if the benefits out weigh the costs*
Example: price determined for a good (smart watch price set by managers to maximize profit)
\
Example: price determined for a good (smart watch price set by managers to maximize profit)
\
30
New cards
Principle 4
Consumers and firms consistently respond to economic incentives.
\
◦Example: Security measures at a bank to protect against robberies—cost to do so outweighed the benefit
\
\
◦Example: Security measures at a bank to protect against robberies—cost to do so outweighed the benefit
\
31
New cards
Trade-off
Trade-off: The idea that because of scarcity, producing more of one good or service means producing less of another good or service.
\--Way to measure this COST, is opportunity cost > the value of what has to be given up to produce it
\
\--Way to measure this COST, is opportunity cost > the value of what has to be given up to produce it
\
32
New cards
Opportunity Cost
Opportunity Cost: the highest valued alternative that must be given up to engage in an activity
Example: College football game ticket price is $50. The OC of attending the game is the ticket price plus the value you place on what else you could do if you don’t attend the game (such as watching replays on TV, commentary, high-quality wi-fi, etc.)
\
Example: College football game ticket price is $50. The OC of attending the game is the ticket price plus the value you place on what else you could do if you don’t attend the game (such as watching replays on TV, commentary, high-quality wi-fi, etc.)
\
33
New cards
Economic Analysis
Economic Analysis:
*What goods and services will be produced?*
◦Determined by the choices that consumers and people working for firms or government make. (problem faced scarcity by trading off one good or service for another, each having an opportunity cost of what has to be given up)
*How goods or services will be produced?*
◦Firms choose how to produce the goods or services they sell. (trade-offs on inputs)
*Who will receive the goods or services?*
◦Depends on how the income is distributed
34
New cards
Types of Economies
\
Types of Economies:
Centrally planned economy: An economy in which the government decides how economic resources will be allocated. (Soviet Union, unsuccessful in producing low-cost, high quality goods and services, lower standard of living, political dictatorships)
\
Market economy: An economy in which the decisions of households and firms interacting in markets allocate resources. (privately owned firms making production decisions, US Western Europe, Competition for highest quality products at lowest cost)
\
Mixed Economy: An economy in which most economic decisions result from the interaction of buyers and sellers in markets but in which the government plays a significant role in the allocation of resources.
\
(US during the depression, social security system, minimum wage regulation, US Canada and Western Europe today, China today (mixed when before centrally planned)
\
35
New cards
Types of Markets
Types of Markets:
Market: A group of buyers and sellers of a good or service and the institution or arrangement by which they come together to trade. 2 types of mkts:
\
1\.Product mkt: A market for goods and services (computers/babysitting). Households are demanders and firms are suppliers.
\
2\.Factor mkt: A market for the factors of production (such as labor, capital, natural resources, and entrepreneurial ability)
Factors of production: are the inputs used to make goods and services.
***Labor:*** All types of work (part-time & full-time employment)
***Capital:*** physical capital (i.e. computers, machine tools) used to produce goods and services.
***Natural resources***: land, water, oil, raw materials that are used to produce goods.
***Entrepreneur***: someone who operates a business.
\
(entrepreneurial ability: the ability to bring together other factors of production to successfully produce and sell goods and services).
\
\
36
New cards
Free Market
\
**Free market**: A market with few government restrictions on how a good or service can be produced or sold or how factors of production can be used.
\
Adam Smith-*Wealth of Nations* (published in 1776). Key assumption is that individuals act in a rational self-interested way -taking actions that are most likely to make themselves financially better off.
*Free market mechanism*—PRICES-which are flexible acting as a signal to both consumers and producers (providing information). The market ***Invisible Hand*** (how the market leads firms to provide consumers with what they want). Firms respond individually to the changes in prices by making decisions that collectively end up satisfying the wants of consumers.
\
37
New cards
Entrepreneurs & Property Rights
**Entrepreneurs & Property Rights:**
*Role of Entrepreneurs in mkt system*: vital contribution to economic growth through their roles in responding to consumer demand and introducing new products. Govt. policies that encourage entrepreneurship are also likely to increase economic growth and raise the standard of living.
*For the market system to work—people must be willing to take risks.*
Property Rights: The rights individuals or firms have to the exclusive use of their property, including the right to buy or sell it.
◦Intellectual property-books, films, software, and ideas for new products or new ways at producing products. PATENT-govt granted exclusive right to produce and sell a new product for a period of time (20yrs)
\
38
New cards
Economic Models
**Economic Models:**
Rely on economic models to analyze real-world issues ranging from the role of government in monitoring smart devices to whether society should redistribute income.
\
Steps to develop a model:
1\.Decide on the assumptions developed in the model.
2\.Formulate a testable hypothesis
3\.Use economic data to test the hypothesis
4\.Revise the model if it fails to explain the economic data well
5\.Retail the revised model to help answer similar economic questions in the future.
**Economic variable**: Something measurable that can have different values, such as the incomes of doctors.
\
\*Hypotheses must be statements that could, in principle, turn out to be incorrect (not value judgements)
39
New cards
Efficiency and Equity
**Efficiency and Equity:**
*Productive Efficiency*: A situation in which a good or service is produced at the lowest possible cost.
\
*Allocative Efficiency*: A state of the economy in which production is in accordance with consumer preferences; in particular, every good or service is produced up to the point where the last unit provides a marginal benefit to society equal to the marginal cost of producing it.
\
*Voluntary Exchange*: A situation that occurs in markets when both the buyer and seller or a product are made better by the transaction.
*Equity*: The fair distribution of economic benefits. (no agreed-upon definition of fairness)—Note the *trade-off between efficiency and equity* (eg. Raising taxes on those with higher incomes, no incentive to open new businesses, etc.)
\
40
New cards
Economic Analysis :Types of Analysis: Positive vs Normative
**Economic Analysis:Types of Analysis: Positive vs Normative**
*Positive analysis*: Analysis concerned about what is (economics-measures the costs and benefits of different courses of action).
\
*Normative analysis*: Analysis concerned about what ought to be
\
Economics as a *social science*: studying human behavior-particularly decision-making behavior
\
*Positive analysis*: Analysis concerned about what is (economics-measures the costs and benefits of different courses of action).
\
*Normative analysis*: Analysis concerned about what ought to be
\
Economics as a *social science*: studying human behavior-particularly decision-making behavior
\
41
New cards
Two Branches of Econ: Macroeconomics and Microeconomics
**Two Branches of Econ: Macroeconomics and Microeconomics**
Microeconomics: The study of how households and firms make choices, how they interact in markets, and how the government attempts to influence their choices.
**Macroeconomics**: The study of the economy as a whole, including topics such as inflation, unemployment, and economic growth.
\
Microeconomics: The study of how households and firms make choices, how they interact in markets, and how the government attempts to influence their choices.
**Macroeconomics**: The study of the economy as a whole, including topics such as inflation, unemployment, and economic growth.
\
42
New cards
Microeconomic Issues
**Microeconomic Issues**
How consumers react to changes in product prices?
\
How firms decide what prices to charge from the products they sell?
\
Which government policy would most efficiently reduce teenage smoking?
\
What are the costs and benefits of approving the sale of a new prescription drug?
What is the most efficient way to reduce air pollution?
\
43
New cards
Macroeconomic Issues
**Macroeconomic Issues**
Why do economies experience periods of recession and increasing unemployment?
\
Why, over the long run, some economies have grown much faster than others?
\
What determines the inflation rate?
\
What determines the value of the U.S. dollar
\
Whether government intervention can reduce the severity of recessions
\
44
New cards
Circular Flow Diagram
Circular Flow Diagram:
Circular flow diagram-a model that illustrates how participants in markets are liked (two key groups-households and firms)
\
\*Households: all the individuals in a home. Suppliers of factors of production (i.e. labor). Owners of firms. In factor markets, households are suppliers and firms are demanders.
\
\*Firms: suppliers of goods and services. Use funds from selling goods and services to buy or hire the factors of production needed to make the goods and services.
\
45
New cards
Trade-offs
Trade-offs: A goods and services are scarce and so are economic resources.
46
New cards
PPF
PPF: A curve showing the maximum attainable combinations of two goods that can be produced with available resources and current technology.
\
Ex: Eg Tesla produces the Model S sedans and Model X SUVs, using workers, materials, robots, and other machinery. To build more sedans it must build less SUVs.
\
\
Ex: Eg Tesla produces the Model S sedans and Model X SUVs, using workers, materials, robots, and other machinery. To build more sedans it must build less SUVs.
\
47
New cards
Attainable
Attainable: All points on the frontier (A, B, C, D, and E) or inside the frontier (F) a are attainable-can be made with given resources.
48
New cards
Efficient
Efficient: The combinations on the frontier, all available resources are being fully utilized and the fewest possible resources are being used to produce a given amount of output.
\n
\n
49
New cards
Inefficient
Inefficient: The point F, maximum output is not being obtained from the available resources.
50
New cards
Unattainable
Unattainable: A combination that is not possible with current resources. (need more machines and more workers to achieve this point)
51
New cards
Opportunity cost
Opportunity cost: the highest valued alternative that must be given up to engage in an activity.
\n Tesla example: the OC of producing one more SUV is the number of sedans the company will be unable to produce due to shifting resources to SUV production.
B to C: The opportunity cost of producing 20 more SUVs per day is 20 fewer sedans
\n
\*What point on the PPF is best?
--We cannot tell without additional information. Such as what is the demand for Sedans vs. SUVs
\n
52
New cards
**Economic Growth (positive & negative)**
**Economic Growth (positive & negative):** *What happens when the resources available to an economy increase?*
\
It increases in labor force, capital stock and shifts outward of PPF.
\
It increases in labor force, capital stock and shifts outward of PPF.
53
New cards
Economic growth
Economic growth: the ability of the economy to increase the production of goods and services.
\n
\n
54
New cards
**Technical Change may not affect all sectors:**
__**Technical Change may not affect all sectors:**__
\
Technical Change in the car industry: If the technological or technical change happens only in the car industry, it will lead to more production of cars but not in “tanks”.
\
Technical Change in both industries: If a technological or technical change happens in both the car and “tanks” industry, it will lead to more production of cars and “tanks”.
\n
\
Technical Change in the car industry: If the technological or technical change happens only in the car industry, it will lead to more production of cars but not in “tanks”.
\
Technical Change in both industries: If a technological or technical change happens in both the car and “tanks” industry, it will lead to more production of cars and “tanks”.
\n
55
New cards
Trade
Trade: The act of buying and selling. (directly and indirectly)
\
Ex: Trade makes it possible for people to become better off by increasing both their production and consumption.
\n
\
Ex: Trade makes it possible for people to become better off by increasing both their production and consumption.
\n
56
New cards
**Specialization and the Gains from Trade**
\
**Specialization and the Gains from Trade**
\
Absolute advantage : The ability of an individual, firm, or a country to produce more of a good or service than its competitors using the same amount of resources.
\
**Comparative advantage**: The ability of an individual, a firm, or a country to **produce a good or service at a** ***lower opportunity cost*** than competitors.
\
**The basis for trade:** comparative advantage NOT absolute advantage
\n
\n
\
\
57
New cards
Trade and Specialization
**Trade and Specialization:**
\
* You: if you pick all apples-you produce 20 apples, 10 for you, 10 for your neighbor and you get 15 cherries in return
\
* Moves you from point A to B
\
* Neighbor produces all cherries. They produce 60 cherries, giving you 15, so 45 for the neighbor and 10 apples from trade.
\
* Moves your neighbor from point C to D
\n
\
* You: if you pick all apples-you produce 20 apples, 10 for you, 10 for your neighbor and you get 15 cherries in return
\
* Moves you from point A to B
\
* Neighbor produces all cherries. They produce 60 cherries, giving you 15, so 45 for the neighbor and 10 apples from trade.
\
* Moves your neighbor from point C to D
\n
58
New cards
**Conclusion Specialization and Trade:**
__**Conclusion Specialization and Trade:**__
\
Key Take Away:
\n
◦Individuals, firms, and countries are better off if they specialize in producing goods or services for which they have a comparative advantage and obtain the other goods and services they need by trading.
\n
\
Key Take Away:
\n
◦Individuals, firms, and countries are better off if they specialize in producing goods or services for which they have a comparative advantage and obtain the other goods and services they need by trading.
\n
59
New cards
Demand side of the market
__Demand side of the market__
\
**Perfectly competitive market:**
\n
(1) there are many buyers and sellers
(2) all firms are selling identical products
(3) no barriers to new firms entering the market.
\n
\
\
\
\
**Perfectly competitive market:**
\n
(1) there are many buyers and sellers
(2) all firms are selling identical products
(3) no barriers to new firms entering the market.
\n
\
\
\
60
New cards
**Demand schedule**
**Demand schedule:** A table that shows the relationship between the price of a product and the quantity of the product demanded.
\n
\n
61
New cards
Quantity demanded
Quantity demanded: The amount of a good or service **that a consumer** is willing and able to purchase at a given price.
\
\
62
New cards
Demand curve
Demand curve: A curve that shows the relationship between the price of a product and the quantity of the product demanded.
\
\
63
New cards
Market demand
Market demand: The **demand by all the consumers** of a given good or service.
64
New cards
Slopes downward
Slopes downward: consumers will buy more of a good as the price falls
\n
\n
65
New cards
Law of demand
Law of demand: A rule that states that, holding everything else constant, when the price of a product falls, the quantity demanded of the product will increase, and when the price of the product rises, the quantity demanded of the product will decrease.
66
New cards
The substitution effect
The substitution effect: The change in quantity demanded of a good because of a change in price makes the good more or less expensive relative to other goods that are substitutes.
\
***Ex: iPhone and Samsung phones are good substitutes***
If the price of an iPhone increases, the quantity demanded for iPhones goes down because the new price of an iPhone makes it more expensive than Samsung phones.
\n
If the price of an iPhone decreases, the quantity demanded for iPhones goes up because the new price of an iPhone makes it less expensive than Samsung phones.
\n
67
New cards
The income effect
The income effect: A change in the good’s price increases or decreases consumers’ purchasing power (amount of goods or services that you can purchase with a fixed income)
\
Ex: If the price of a Tesla Model 3 goes up, purchasing power will go down. If the price goes down, the purchasing power will go up.
\
* price increases, decreases purchasing power, decrease in quantity of the good
\
* price decreases, increases purchasing power, increase in quantity of the good
\
Ex: If the price of a Tesla Model 3 goes up, purchasing power will go down. If the price goes down, the purchasing power will go up.
\
* price increases, decreases purchasing power, decrease in quantity of the good
\
* price decreases, increases purchasing power, increase in quantity of the good
68
New cards
**Ceteris Paribus**
Ceteris Paribus means ““all else equal”
\n
\n
69
New cards
**Ceteris paribus (“all else equal”) condition**
Ceteris paribus condition are the requirement that when analyzing the relationship between two variables-such as price and quantity demanded-other variables must be held constant.
\n
\n
70
New cards
A shift in demand
Shift in demand is an increase or a decrease in demand
71
New cards
Shift to the right (outward)
The shift to the the right (outward) is if the consumers decide to buy more of a good or service at each price
72
New cards
**Shift to the left (inward)**
The shift to the right (inward) is if consumers decide to buy less of a good or service at each price.
73
New cards
Variables that shift market demand
There are 5 main topics in the variable shift market demand:
\
1. Income
2. Prices of related goods
3. Tastes
4. Population and demographics
5. Expected future prices
\
1. Income
2. Prices of related goods
3. Tastes
4. Population and demographics
5. Expected future prices
74
New cards
Normal good
Normal good is a good for which the demand increases as income rises and decreases as income falls (most goods).
75
New cards
Inferior good
Inferior good is a good for which the demand increases as income falls and decreases as income rises (instant noodles, canned food)
76
New cards
Substitutes
Substitutes are goods and services that can be used for the same purpose.
\
Ex:
* When goods are substitutes, the more you buy of one, the less you will buy of the other. (ex: Tea and Coffee)
* A decrease in the price of a substitute—Demand (D) shifts to the left
\
* An increase in the price of a substitute—Demand (D) shifts to the right
\
Ex:
* When goods are substitutes, the more you buy of one, the less you will buy of the other. (ex: Tea and Coffee)
* A decrease in the price of a substitute—Demand (D) shifts to the left
\
* An increase in the price of a substitute—Demand (D) shifts to the right
77
New cards
Complements
Complements are goods and services that are used together. (ex: Smart watches and apps, Macbook and charger)
\
* When two goods are complements, the more consumers buy of one good the more they will buy of another
* A decrease in the price of a complement: Demand (D) shifts to the right
* An increase in the price of a complement: Demand (D) shifts to the left
\n \n
\
* When two goods are complements, the more consumers buy of one good the more they will buy of another
* A decrease in the price of a complement: Demand (D) shifts to the right
* An increase in the price of a complement: Demand (D) shifts to the left
\n \n
78
New cards
Tastes
1. Tastes increase: Demand (D) shifts to the right
2. Tastes decrease: Demand (D) shifts to the left
79
New cards
Demographic
the demographic is the characteristics of a population with respect to age, race, and gender. As demographic change so will preferences for a good.
80
New cards
Expected future prices
Expected decline in prices: postpone purchases and current Demand (D) shifts to the left
\
Expected increase in prices: make purchases now and current Demand (D) shifts to the right.
\
Expected increase in prices: make purchases now and current Demand (D) shifts to the right.
81
New cards
Supply side of the market
Quantity supplied: The amount of a good or service that a firm is willing and able to sell at a given price.
\n
\
Law of supply says: holding all else constant (Ceteris Paribus),
If the price of a good rises, producing the good is more profitable, and the quantity supplied will increase and
If the price of a good falls, selling the good is less profitable, and the quantity supplied will decrease.
\n
\n
\
Law of supply says: holding all else constant (Ceteris Paribus),
If the price of a good rises, producing the good is more profitable, and the quantity supplied will increase and
If the price of a good falls, selling the good is less profitable, and the quantity supplied will decrease.
\n
82
New cards
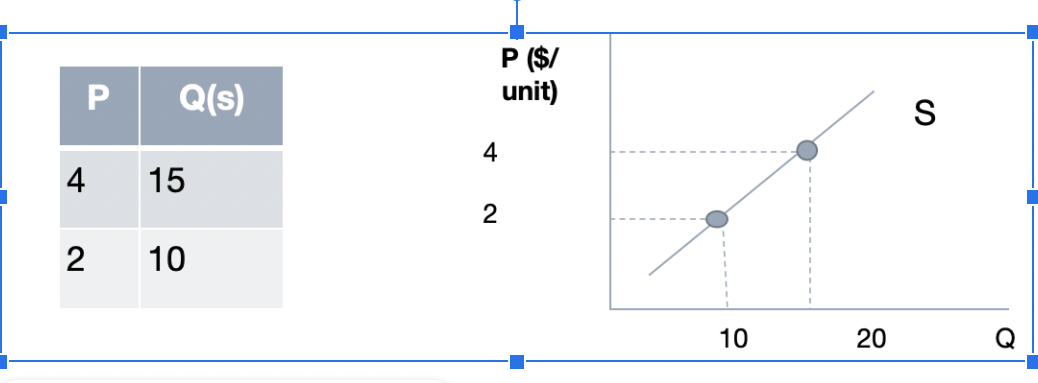
Supply schedule
The supply schedule is a table that shows the relationship between the price of a product and the quantity supplied of the product.
\
\
\
\
83
New cards
Supply curved
The supply curved is the table that shows the relationship between the price of a product and the quantity of the product supplied.
84
New cards
Law of supply
The Law of supply is a rule that states that, holding everything else constant, increases in price causes increases in the quantity supplied, and decreases in price decreases the quantity supplied.
\
If other variables affect the willingness to supply a good change, the supply curve will shift—an increase or a decrease in supply.
increase in supply: shift to the right (S to S1)
decrease in supply: shift to the left (s to S2)
\n
\
If other variables affect the willingness to supply a good change, the supply curve will shift—an increase or a decrease in supply.
increase in supply: shift to the right (S to S1)
decrease in supply: shift to the left (s to S2)
\n
85
New cards
Variables that shift market supply
There are 5 main topics in the variable shift market supply:
\
1. Prices of input
2. Technological change
3. Prices of related goods in production
4. Number of firms in the market
5. Expected futures prices
\
\
\
\
1. Prices of input
2. Technological change
3. Prices of related goods in production
4. Number of firms in the market
5. Expected futures prices
\
\
\
86
New cards
Prices of inputs
Prices of an input increases: cost of producing increases, supply curve shifts to the left
\
Prices of an input decreases: cost of producing decreases, supply curve shifts to the right
\n
\
Prices of an input decreases: cost of producing decreases, supply curve shifts to the right
\n
87
New cards
Technological Change (TC)
Increase in TC (positive TC): (productivity of workers or machines increase), costs down, firm increases quantity supplied at every price, **shift to right of supply.**
\
**Decrease in TC (negative TC):** (earthquake/natural disaster), less productive, costs increase, firm decreases quantity supplied at every price, **shift to left of supply.**
\
**Decrease in TC (negative TC):** (earthquake/natural disaster), less productive, costs increase, firm decreases quantity supplied at every price, **shift to left of supply.**
88
New cards
Prices of related goods
Substitutes in production: Substitutes in production: alternative goods a firm can produce (similar components, etc.)
* **price of substitute increases: supply curve shift to the left**
\
Complements in production: goods produced together (eg same geological formations/oil and natural gas)-production of one results in more production of the other good
* **increase in the price of a complement in production, shifts supply to the right. Ex:** increase in the price of oil will cause the supply curve for natural gas to shift
\n
\
89
New cards
Number of firms in the market
A change in the number of firms in the market will change supply.
* **New firms enter:** supply curve shifts to the right
* **Firms leave:** supply curve shifts to the left
\
**A change in supply** refers to a shift in the supply curve (change in one variable other than the price of the product that affects the willingness to sell the product)
\
**A change in quantity supplied** refers to a movement along the supply curve as a result of a change in the product’s price.
\
A to B: movement along the supply curve due to change in the price of product
\
B to C: a shift in supply due to other factors (inputs prices decrease, etc)
90
New cards
Market Equilibrium
The Market Equilibrium is a situation in which quantity demanded equals quantity supplied. It is the point where the demand curve crosses the supply curve
\n
\n
91
New cards
Competitive market equilibrium
The Competitive market equilibrium is a market equilibrium with many buyers and sellers (key assumption of this case)
\
(Supply = Demand @ (P\**, Q*\*)
\
(Supply = Demand @ (P\**, Q*\*)
92
New cards
Surplus
A Surplus is a situation in which the quantity supplied is greater than the quantity demanded. **Q(s) > Q(d)**
\
Ex: If Tesla makes 10,000 Model Ys and the quantity demanded is 6,000. Then Tesla has a surplus of 4,000 Model Ys
\
(P\* = 50)
(Q\*= 100)
\
Q(s)-Q(d)
surplus = 75
\
Ex: If Tesla makes 10,000 Model Ys and the quantity demanded is 6,000. Then Tesla has a surplus of 4,000 Model Ys
\
(P\* = 50)
(Q\*= 100)
\
Q(s)-Q(d)
surplus = 75
93
New cards
Shortage
A Shortage is a situation in which the quantity demanded is greater than the quantity supplied (price below equilibrium) **Q(d) > Q(s)**
\
Ex: If Tesla makes 9,000 Model 3s and the quantity demanded is 12,000. Then Tesla has a surplus of 3,000 Model 3s.
\n (P\* = 50)
(Q\*= 100)
\
Q(d)-Q(s)
\
Shortage = 45
\n
\
Ex: If Tesla makes 9,000 Model 3s and the quantity demanded is 12,000. Then Tesla has a surplus of 3,000 Model 3s.
\n (P\* = 50)
(Q\*= 100)
\
Q(d)-Q(s)
\
Shortage = 45
\n
94
New cards
Economic efficiency
A Economic efficiency is when every consumer is paying the market price is able to buy as much as he/she wants.
\
* Consumers prefer to pay a lower price
* Sellers prefer to receive a higher price
\
* Consumers prefer to pay a lower price
* Sellers prefer to receive a higher price
95
New cards
Government intervention
__A Government intervention have 3 things:__
\
1. Price ceiling
2. Price floor
3. taxes
\
\
1. Price ceiling
2. Price floor
3. taxes
\
96
New cards
Price ceiling
A Price ceiling is a legally determined maximum price that sellers may charge **(consumers)**. **If the price ceiling is below the equilibrium price, then the price ceiling is binding, and the quantity demanded exceeds the quantity supplied (shortage). A binding price ceiling causes a shortage.**
\
A price ceiling is a legal maximum on the price of a good or service. An example is rent control. If the price ceiling is below the equilibrium price, then the price ceiling is binding, and the quantity demanded exceeds the quantity supplied (shortage). Because of the resulting shortage, sellers must in some way ration the good or service among buyers.
97
New cards
Price floor
A Price floor is a legally determined minimum price that sellers may receive (sellers, ex market for farm products, milk). **If the price floor is above the equilibrium price, then the price floor is binding, and the quantity supplied exceeds the quantity demanded (surplus). A binding price floor causes a surplus.**
\
A price floor is a legal minimum on the price of a good or service. An example is the minimum wage. If the price floor is above the equilibrium price, then the price floor is binding, and the quantity supplied exceeds the quantity demanded (surplus). Because of the resulting surplus, buyers’ demands for the good or service must in some way be rationed among sellers.
98
New cards
Consumer surplus
A consumer surplus is the **difference** **between the highest price** a consumer is willing to pay for a good or service **and the actual price** the consumer pays.
\n
*The area below the demand curve and above the price measures the consumer surplus in a market .*
\n
\n
*The area below the demand curve and above the price measures the consumer surplus in a market .*
\n
99
New cards
Producer surplus
A Producer surplus is the difference between the lowest price a firm would be willing to accept for a good or service and the price it actually receives. **Producer surplus** is the amount a seller is paid minus the cost of production.
\n
\n
100
New cards
Economic surplus
An Economic surplus is when a measure of the benefit to society from the production of a good or service.
\n
\n