MIcroeconomics Exam 1 Study guide
1/75
There's no tags or description
Looks like no tags are added yet.
Name | Mastery | Learn | Test | Matching | Spaced | Call with Kai |
|---|
No analytics yet
Send a link to your students to track their progress
76 Terms
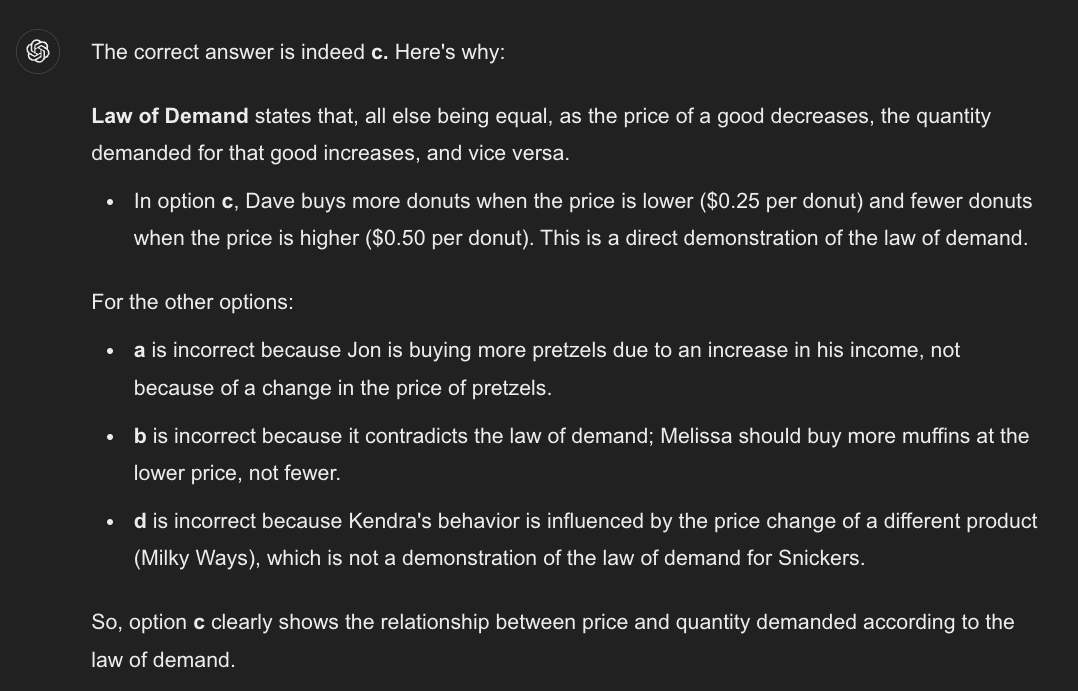
Which of the following demonstrates the law of demand?
a. After Jon got a raise at work, he bought more pretzels at $1.50 per pretzel than he did before his raise.
b. Melissa buys fewer muffins at $0.75 per muffin than at $1 per muffin, other things equal.
c. Dave buys more donuts at $0.25 per donut than at $0.50 per donut, other things equal.
d. Kendra buys fewer Snickers at $0.60 per Snickers since the price of Milky Ways fell to $0.50 per Milky Way.
c. Dave buys more donuts at $0.25 per donut than at $0.50 per donut, other things equal.
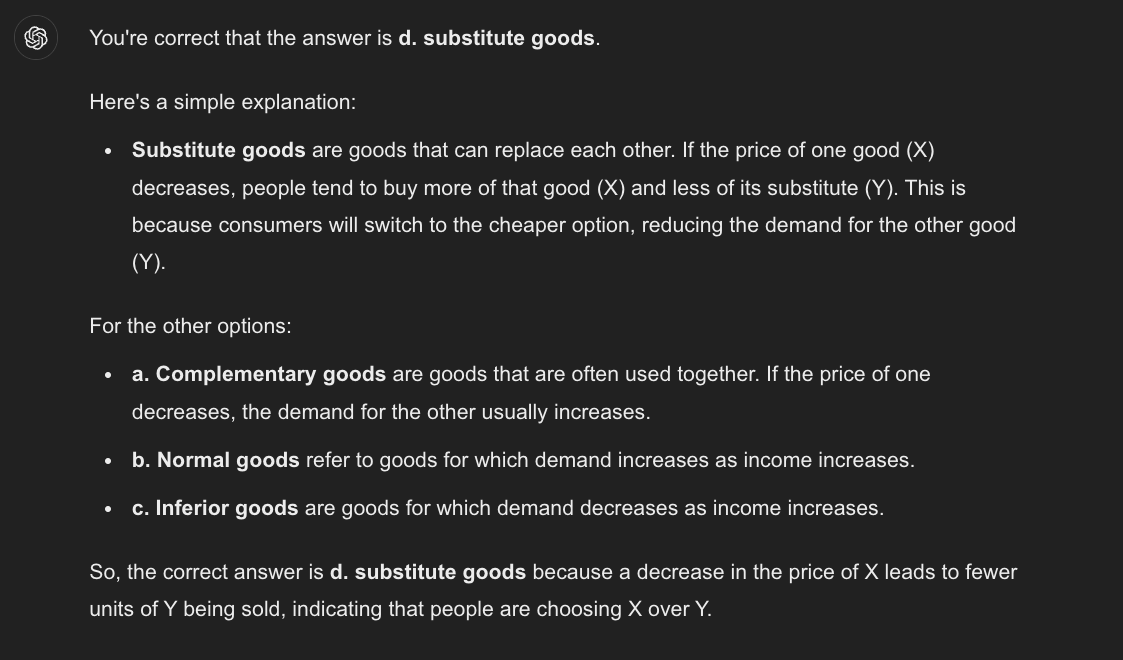
Suppose that a decrease in the price of good X results in fewer units of good Y being sold. This implies that X and Y are
a. complementary goods.
b. normal goods.
c. inferior goods.
d. substitute goods.
d. substitute goods.
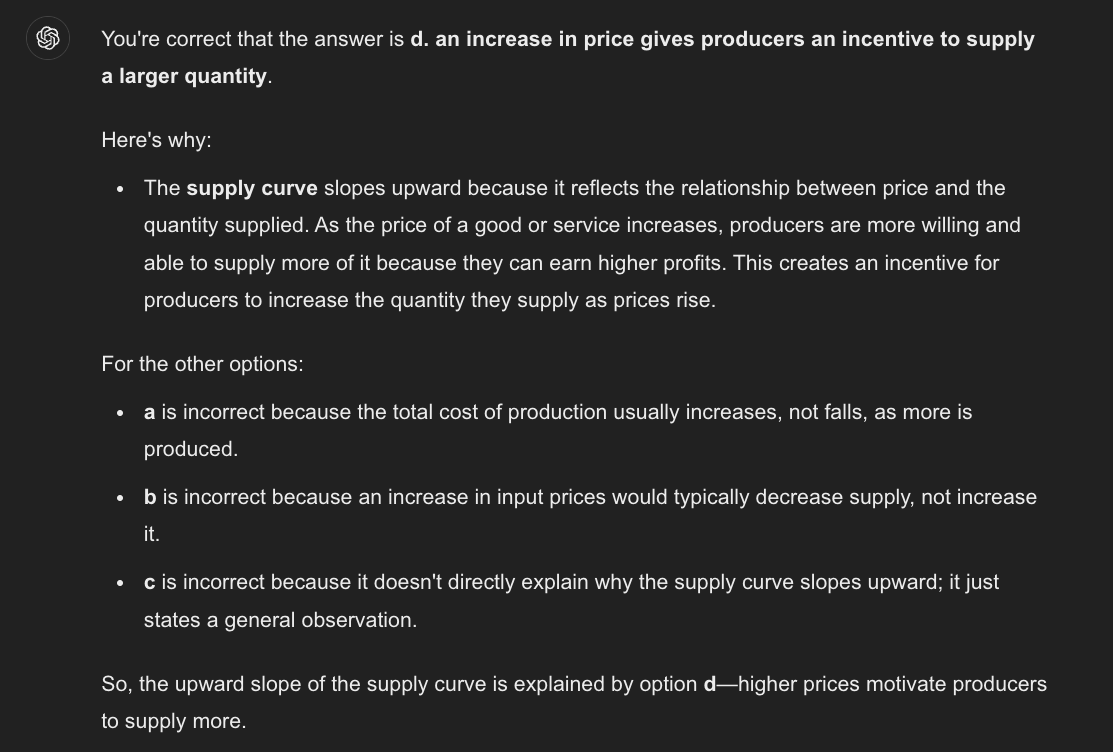
A supply curve slopes upward because
a. as more is produced, total cost of production falls.
b. an increase in input prices increases supply.
c. the quantity supplied of most goods and services increases over time.
d. an increase in price gives producers an incentive to supply a larger quantity
d. an increase in price gives producers an incentive to supply a larger quantity

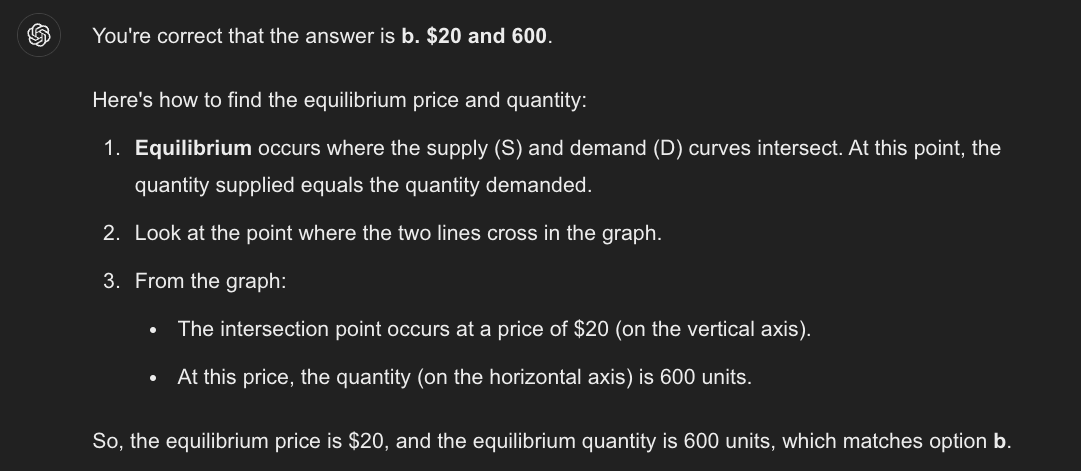
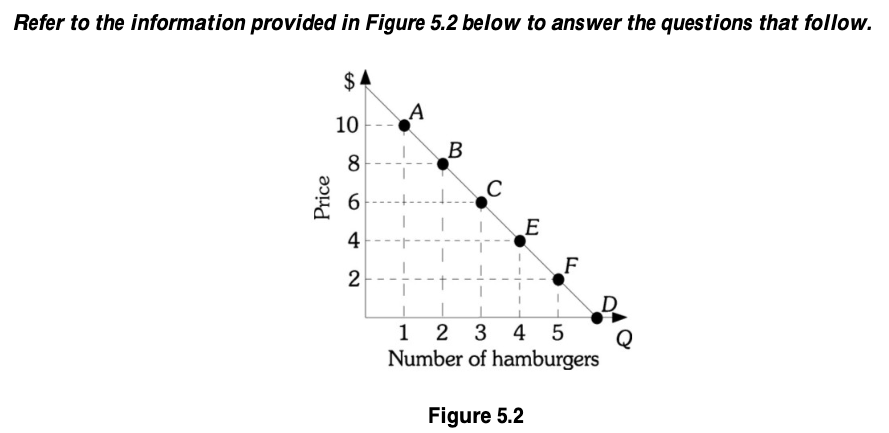
Refer to Figure 4-10. In this market, equilibrium price and quantity, respectively, are
a. $15 and 400.
b. $20 and 600.
c. $25 and 500.
d. $25 and 800
b. $20 and 600.
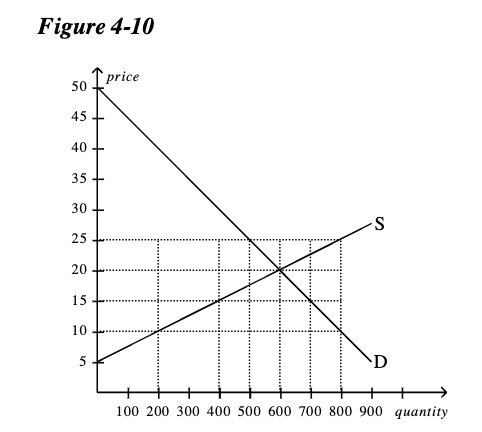
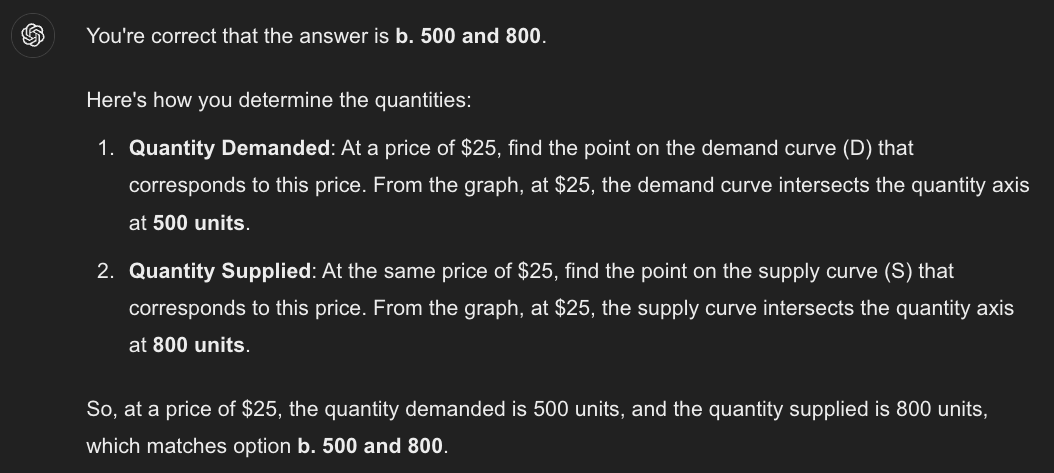
Refer to Figure 4-10. If price is $25, then quantity demanded and quantity supplied, respectively, are
a. 500 and 500.
b. 500 and 800.
c. 600 and 600.
d. 800 and 500.
b. 500 and 800.
If the demand for oranges is unitarily elastic, the absolute value of the price elasticity of demand for oranges is
a. 10.0.
b. 100.0.
c. 0.10.
d. 1.0
d. 1.0
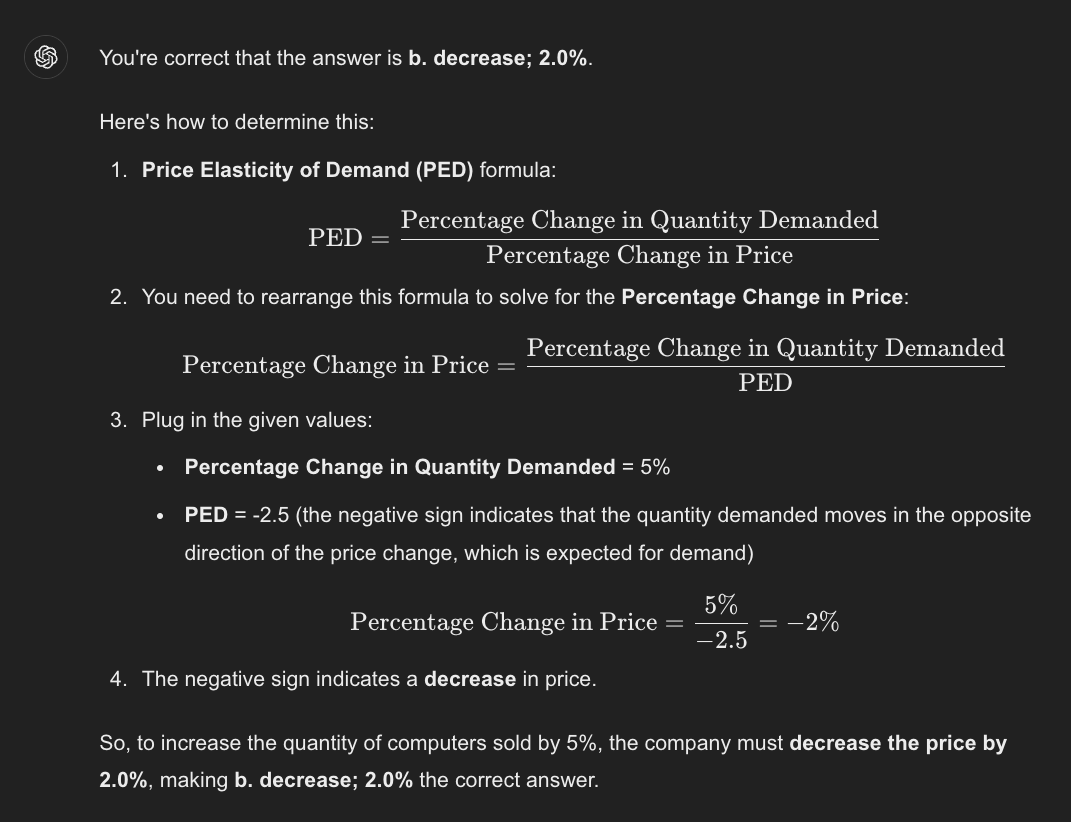
The ABC Computer Company wants to increase the quantity of computers it sells by 5%. If the price elasticity of demand is -2.5, the company must ________ price by ________.
a. decrease; 0.5%
b. decrease; 2.0%
c. increase; 0.5%
d. increase; 2.0%
b. decrease; 2.0%

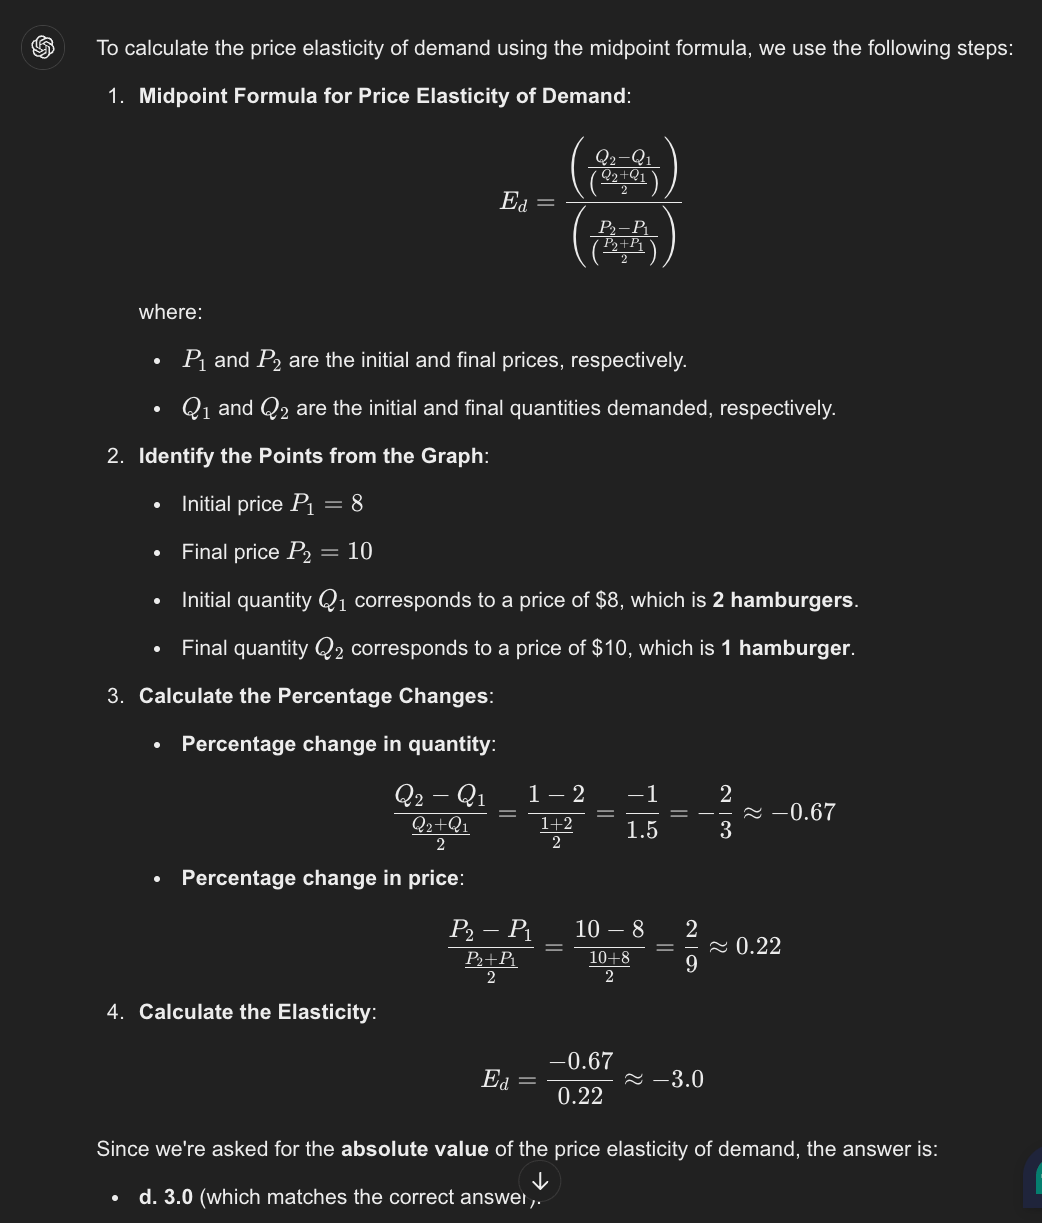
Refer to Figure 5.2. Using the midpoint formula, if the price of a hamburger is increased from $8 to $10, the absolute value of the price elasticity of demand equal
a. 2.5.
b. 33.3
c. 0.36.
d. 3.0
d. 3.0

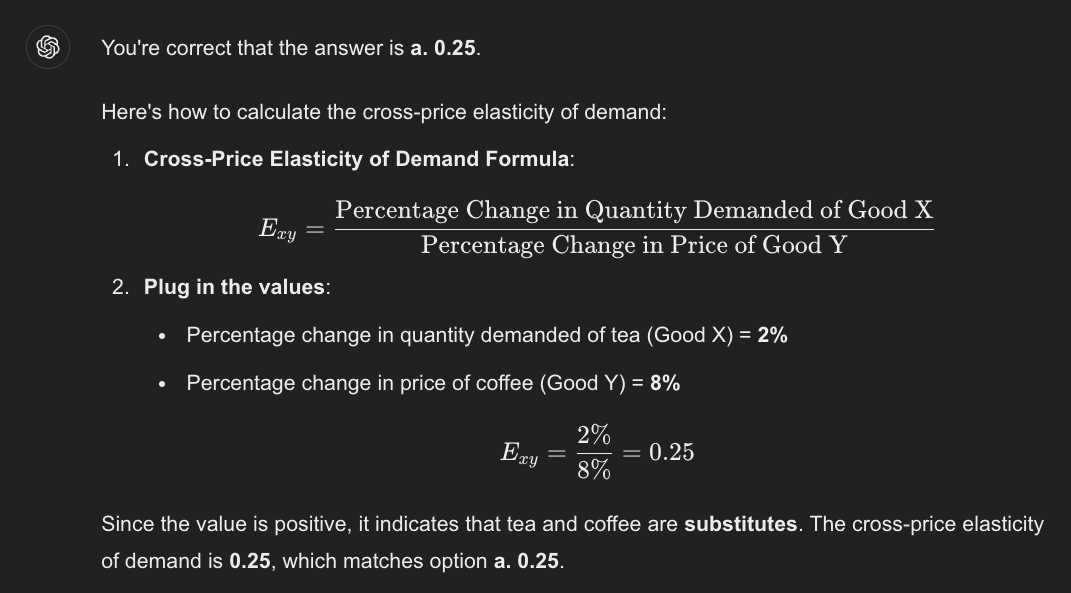
If the quantity demanded of tea increases by 2% when the price of coffee increases by 8%, the cross-price elasticity of demand between tea and coffee is
a. 0.25.
b. -4.
c. -25.
d. 4
a. 0.25.
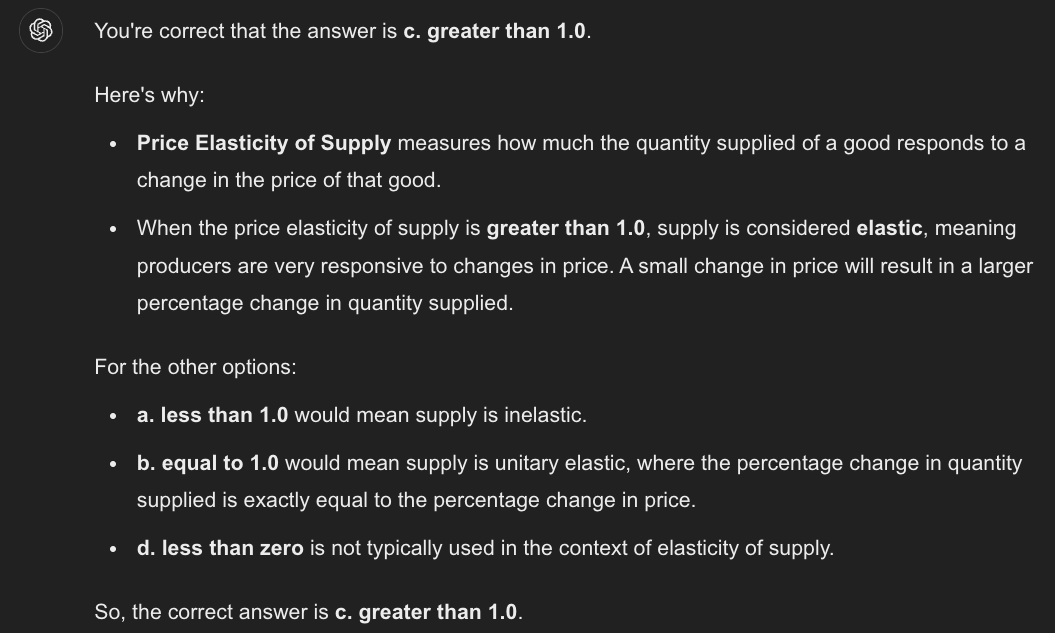
In output markets, supply is said to be elastic if the price elasticity of supply is ____________.
a. less than 1.0.
b. equal to 1.0.
c. greater than 1.0.
d. less than zero.
c. greater than 1.0.
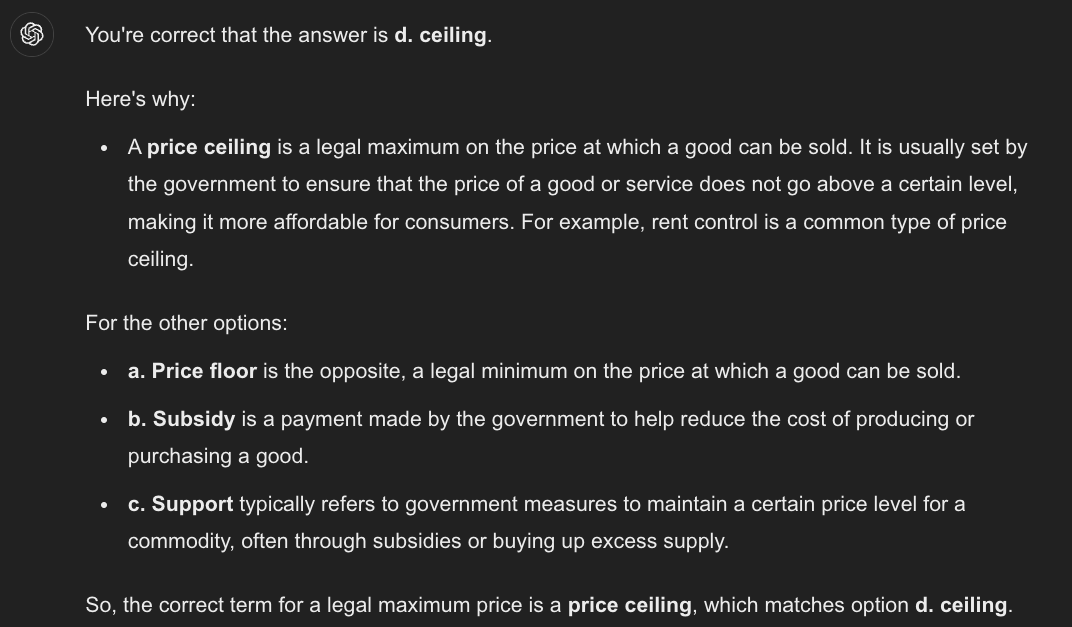
A legal maximum on the price at which a good can be sold is called a price
a. floor.
b. subsidy.
c. support.
d. ceiling.
d. ceiling.
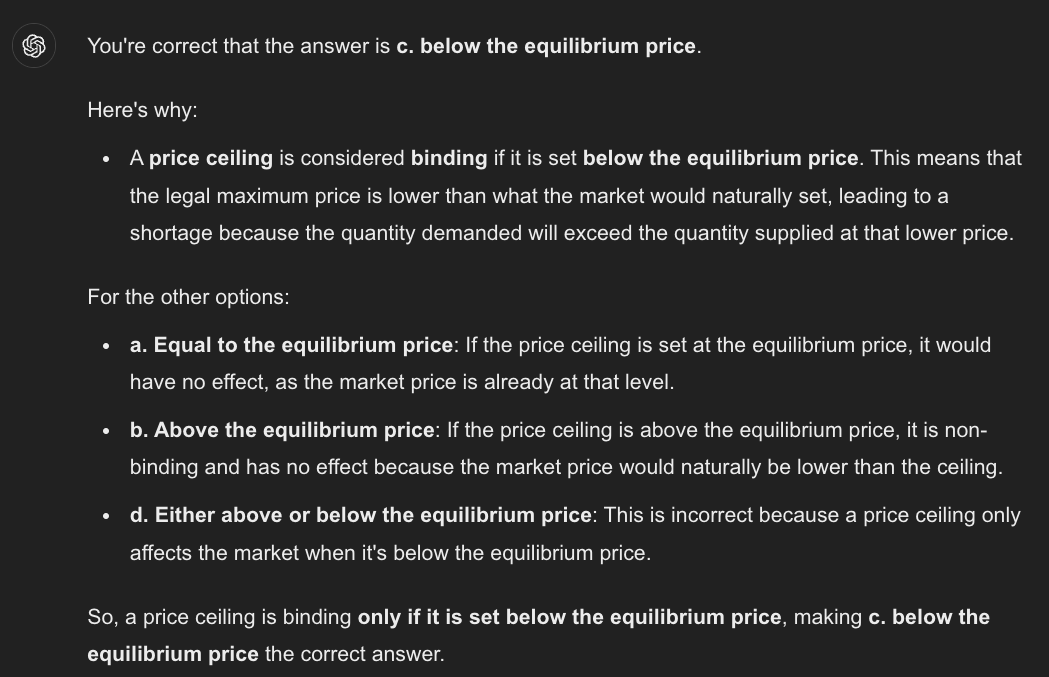
A price ceiling will be binding only if it is set
a. equal to the equilibrium price.
b. above the equilibrium price.
c. below the equilibrium price.
d. either above or below the equilibrium price
c. below the equilibrium price.
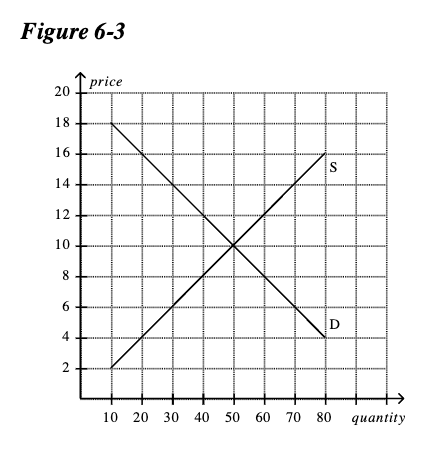
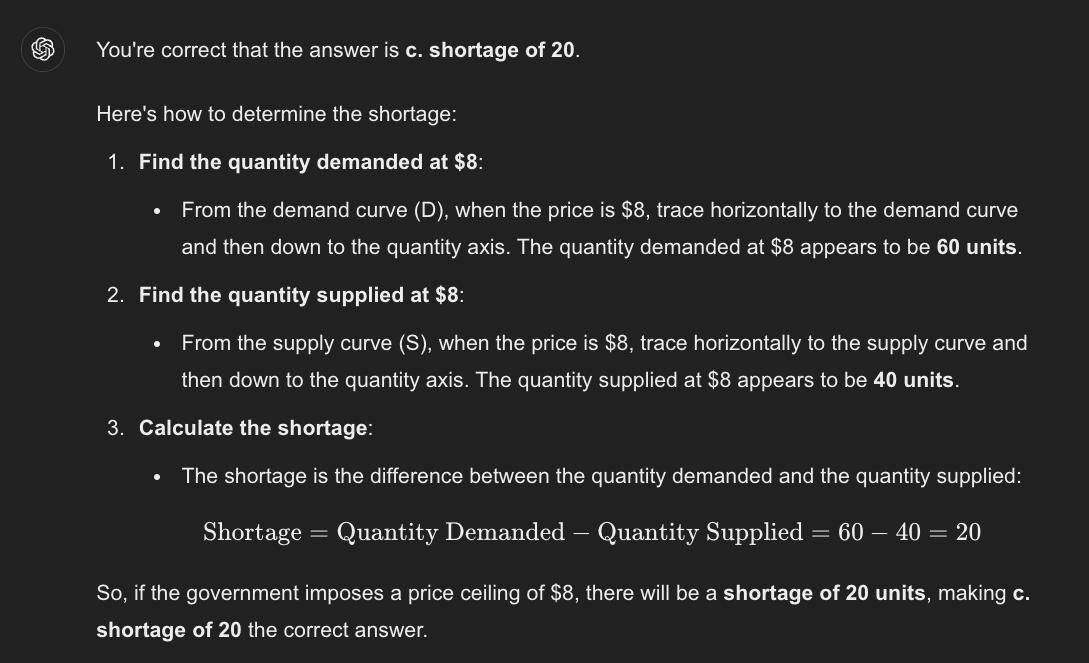
If the government imposes a price ceiling of $8 on this market, then there will be a
a. shortage of 0.
b. shortage of 10.
c. shortage of 20.
d. shortage of 40.
c. shortage of 20.

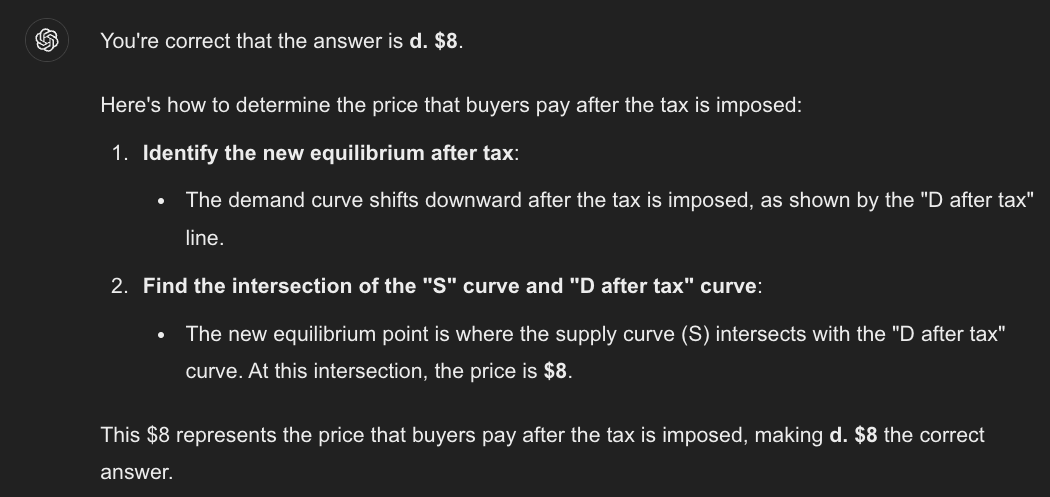
The price that buyers pay after the tax is imposed is
a. $5.
b. $6.
c. $7.
d. $8
d. $8
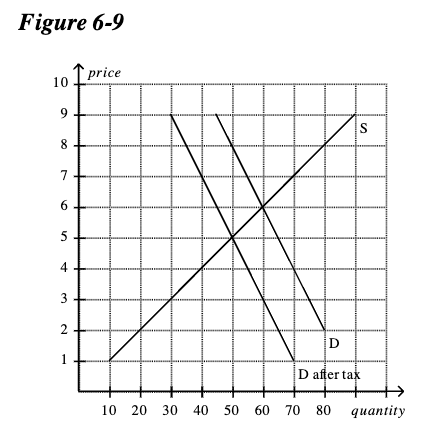
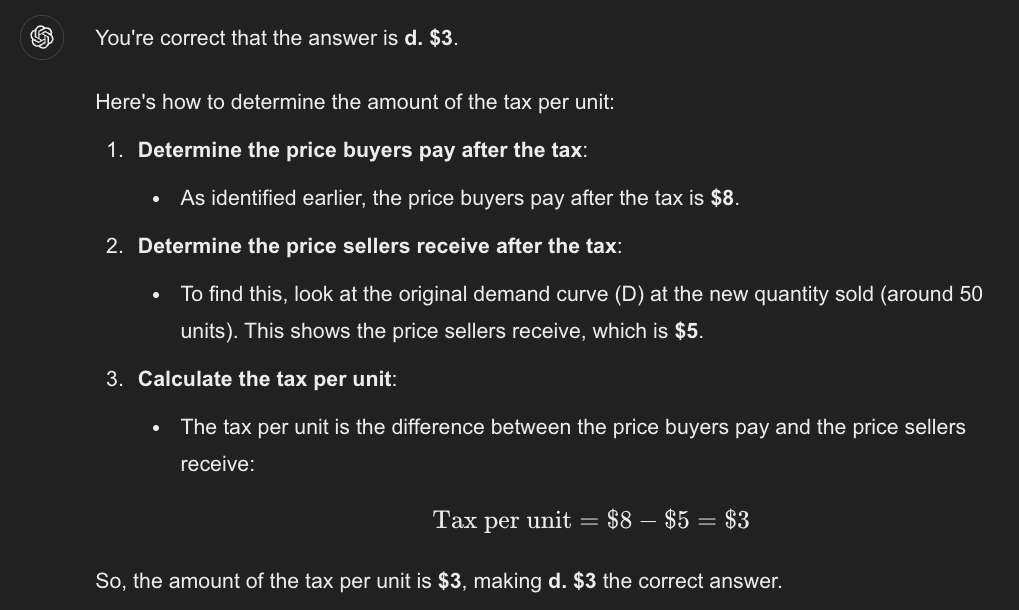
The amount of the tax per unit is
a. $1.
b. $1.50.
c. $2.
d. $3.
d. $3.

What is a market? Are they all highly organized? Give an example of an organized market and one that is less organized.
What is a Market?
Definition: A market is any place where buyers and sellers come together to exchange goods or services. This doesn't have to be a physical place; it can also be online or even a concept, like the stock market.
Are All Markets Highly Organized?
Not all markets are highly organized. Some have strict rules, set locations, and clear procedures, while others are more informal and less structured.
Example of an Organized Market:
Stock Market: The New York Stock Exchange (NYSE) is a highly organized market. It has specific rules, operates at set times, and involves many regulations to ensure fair trading.
Example of a Less Organized Market:
Farmer's Market: A local farmer's market is less organized. While it has some structure (like opening hours and vendor stalls), it's much more informal, with sellers setting their prices and negotiating directly with buyers.

What is competition? What are the characteristics of a competitive market What are the assumptions of the perfectly competitive market?
What is Competition?
Definition: Competition in economics refers to the rivalry among sellers trying to attract buyers by offering better products, lower prices, or other benefits. It’s the driving force that helps keep prices reasonable and improves the quality of goods and services.
Characteristics of a Competitive Market:
Many Buyers and Sellers: There are numerous participants in the market, so no single buyer or seller can control the market price.
Homogeneous Products: The goods offered by different sellers are very similar, if not identical.
Free Entry and Exit: Firms can freely enter or leave the market without significant barriers.
Price Takers: Both buyers and sellers accept the market price as given; they do not have the power to influence it.
Assumptions of a Perfectly Competitive Market:
Large Number of Buyers and Sellers: There are so many buyers and sellers that none can influence the price; everyone is a "price taker."
Identical Products: All firms sell a product that is exactly the same, so consumers don’t prefer one seller over another.
Perfect Information: All buyers and sellers have complete knowledge of the product, prices, and market conditions.
No Barriers to Entry or Exit: Firms can enter the market when they see the opportunity for profit and can leave if they start losing money.
No Externalities: The actions of buyers or sellers do not affect third parties who are not involved in the transaction.
Profit Maximization: Firms aim to maximize their profits, which they do by producing at the level where marginal cost equals marginal revenue.

What is a price taker? Give an example?
What is a Price Taker?
Definition: A price taker is a buyer or seller who cannot influence the market price of a good or service. Instead, they must accept the market price as given. In other words, they "take" the price that the market determines.
Example of a Price Taker:
Farmers Selling Wheat: Imagine a farmer who grows wheat. In a large, competitive wheat market, no single farmer produces enough wheat to influence the overall market price. If the market price of wheat is $5 per bushel, the farmer must sell their wheat at this price—if they try to sell it for more, buyers will simply purchase from another farmer. Hence, the farmer is a price taker.
What is a monopoly and how does it differ from a competitive market?
What is a Monopoly?
Definition: A monopoly is a market structure where a single seller controls the entire supply of a good or service, and therefore has significant control over the market price. In a monopoly, there are no close substitutes for the product, and barriers to entry are so high that no other firms can enter the market.
How Does a Monopoly Differ from a Competitive Market?
Number of Sellers:
Monopoly: Only one seller controls the entire market.
Competitive Market: Many sellers are offering the same or similar products.
Price Control:
Monopoly: The monopolist has significant control over the price because they are the only supplier. They can set the price higher to maximize profits.
Competitive Market: Sellers are price takers and have no control over the market price; they must accept the price determined by supply and demand.
Barriers to Entry:
Monopoly: There are high barriers to entry, such as patents, government regulations, or large capital requirements, which prevent other firms from entering the market.
Competitive Market: There are low or no barriers to entry, allowing firms to enter or exit the market freely.
Product Differentiation:
Monopoly: The product is unique with no close substitutes, making the monopolist the only choice for consumers.
Competitive Market: Products are identical or very similar, leading to more choices for consumers.
Profit:
Monopoly: The monopolist can earn long-term economic profits due to the lack of competition.
Competitive Market: In the long run, firms in a competitive market typically earn normal profits (zero economic profit) because any economic profits attract new firms, increasing competition.
Explain the law of demand. What happens to the quantity demanded when the price rises? When the price falls?
The Law of Demand:
Definition: The law of demand states that, all else being equal, as the price of a good or service increases, the quantity demanded decreases, and as the price decreases, the quantity demanded increases. This is because consumers tend to buy more of something when it’s cheaper and less when it’s more expensive.
What Happens to Quantity Demanded When the Price Rises?
When the price rises: The quantity demanded generally decreases. For example, if the price of a movie ticket goes up from $10 to $15, fewer people may decide to go to the movies because it’s now more expensive.
What Happens to Quantity Demanded When the Price Falls?
When the price falls: The quantity demanded generally increases. Using the same example, if the price of a movie ticket drops from $10 to $5, more people might decide to go to the movies because it’s now cheaper.
Why Does This Happen?
Substitution Effect: When the price of a good rises, consumers might switch to a cheaper alternative, reducing the quantity demanded of the higher-priced good.
Income Effect: When the price of a good rises, it effectively reduces consumers' purchasing power, meaning they can’t buy as much as before, leading to a decrease in quantity demanded.
What is a demand schedule? Can the data in the schedule be plotted on a graph? What will the resulting graph look like? Give and example.
What is a Demand Schedule?
Definition: A demand schedule is a table that shows the quantity of a good or service that consumers are willing and able to purchase at various prices. It helps illustrate the relationship between price and quantity demanded.
Can the Data in the Demand Schedule Be Plotted on a Graph?
Yes: The data from a demand schedule can be plotted on a graph to create a demand curve.
What Will the Resulting Graph Look Like?
The Demand Curve: When plotted, the demand schedule typically results in a downward-sloping curve on a graph. This slope represents the law of demand: as the price decreases, the quantity demanded increases, and as the price increases, the quantity demanded decreases
Example:
Demand Schedule for Ice Cream Cones:
Price per Cone | Quantity Demanded (cones) |
$5 | 1 |
$4 | 2 |
$3 | 4 |
$2 | 7 |
$1 | 10 |
Graph Example: If you plot the above data on a graph:
X-axis: Quantity Demanded
Y-axis: Price
You will see a downward-sloping line or curve that illustrates the inverse relationship between price and quantity demanded.
What is the market demand curve and how is it derived from the individual demand curves?
What is the Market Demand Curve?
Definition: The market demand curve shows the total quantity of a good or service that all consumers in a market are willing and able to purchase at various prices. It is a graphical representation of the market demand, which aggregates the demand from all individual consumers.
How is the Market Demand Curve Derived from Individual Demand Curves?
Derivation: The market demand curve is derived by horizontally summing the individual demand curves of all consumers in the market. This means that for each price level, you add up the quantities demanded by all individuals to get the total quantity demanded in the market.
Example:
Imagine two consumers in a market for ice cream cones:
Consumer A’s Demand: At $3, Consumer A demands 2 cones.
Consumer B’s Demand: At $3, Consumer B demands 3 cones.
Market Demand at $3: Add the quantities from both consumers, so the total market demand is 2 + 3 = 5 cones.

Are the demand curves for everyone exactly the same? If not, what characteristic do all demand curves share?
Are the Demand Curves for Everyone Exactly the Same?
No: Demand curves for different individuals are not exactly the same. Each person has their own preferences, income, and willingness to pay, which affects how much of a good they are willing to buy at different prices. Therefore, individual demand curves can vary widely.
What Characteristic Do All Demand Curves Share?
Downward Slope: Despite differences in individual demand curves, all demand curves share a key characteristic—they slope downward from left to right. This means that as the price of a good or service decreases, the quantity demanded increases, and as the price increases, the quantity demanded decreases. This consistent downward slope reflects the law of demand, which is a fundamental principle in economics.
This downward slope is universal because it reflects basic consumer behavior: people generally buy more of a good when it’s cheaper and less when it’s more expensive.
What is the difference between a change in demand and a change in the quantity demanded? What factors shift the entire demand curve? What factor moves a person from one spot to another on the same demand curve?
Difference Between a Change in Demand and a Change in Quantity Demanded:
Change in Demand:
Definition: A change in demand means the entire demand curve shifts to the right (increase in demand) or to the left (decrease in demand).
Reason: This shift happens due to factors other than price, such as changes in income, consumer preferences, or the prices of related goods.
Example: If people suddenly prefer electric cars over gas cars, the demand curve for electric cars shifts to the right, meaning more people want to buy them at every price.
Change in Quantity Demanded:
Definition: A change in the quantity demanded refers to a movement along the same demand curve due to a change in the price of the good.
Reason: This happens only because of a change in the price of the good itself.
Example: If the price of ice cream drops, people buy more ice cream, moving from one point on the demand curve to another lower down.
Factors That Shift the Entire Demand Curve:
Income: If people’s incomes increase, they generally buy more, shifting the demand curve to the right.
Consumer Preferences: If a good becomes more popular, the demand increases, shifting the curve to the right.
Prices of Related Goods:
Substitutes: If the price of a substitute (e.g., Pepsi for Coke) goes up, demand for the other good increases.
Complements: If the price of a complement (e.g., peanut butter for jelly) goes down, demand for the related good increases.
Expectations: If people expect prices to rise in the future, they may buy more now, increasing current demand.
Number of Buyers: More buyers in the market increase demand, shifting the curve to the right.
Factor That Moves a Person from One Spot to Another on the Same Demand Curve:
Price of the Good: The only factor that causes a movement along the same demand curve is a change in the price of the good itself. If the price goes up, you move to a point higher on the curve with a lower quantity demanded. If the price goes down, you move to a point lower on the curve with a higher quantity demanded.
Discuss the impact of a change in income on the demand curve.
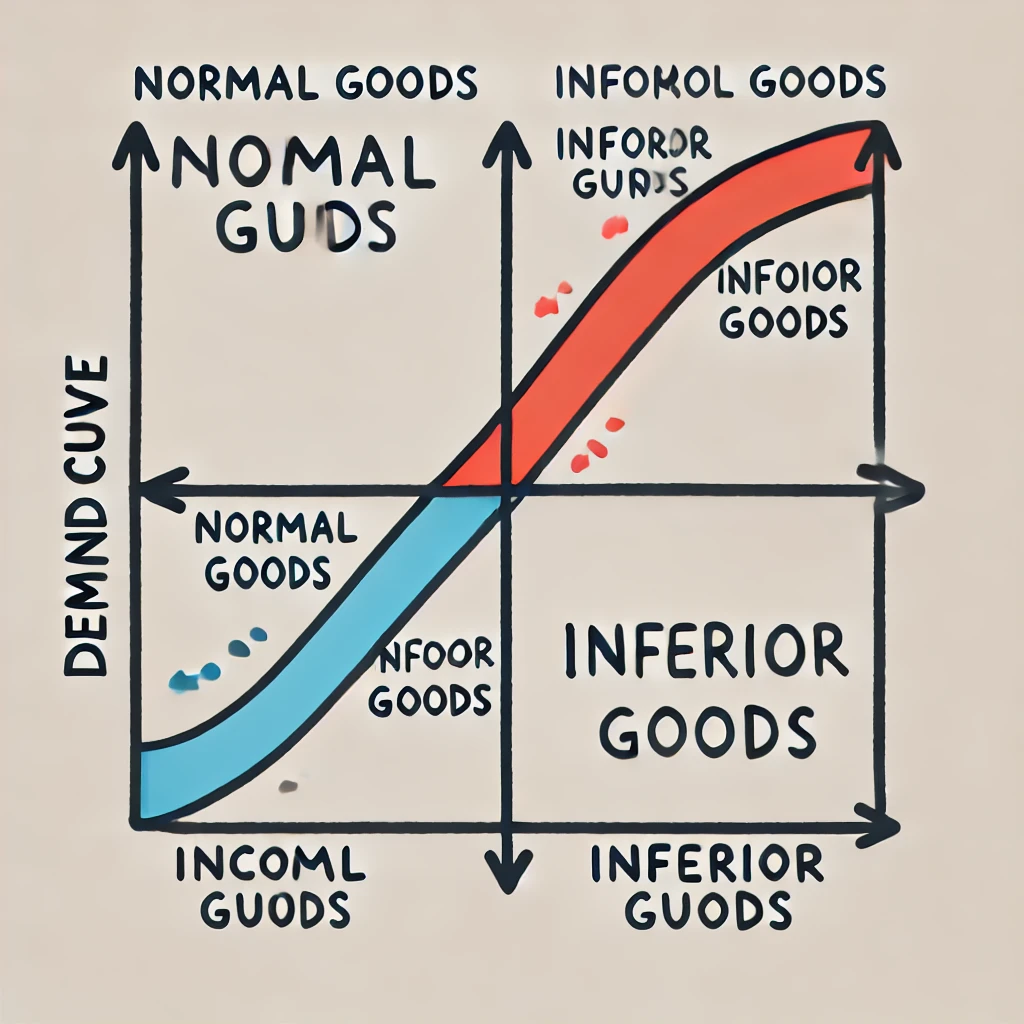
Impact of a Change in Income on the Demand Curve:
Normal Goods:
Definition: Normal goods are goods for which demand increases as income increases. Examples include cars, electronics, and dining out.
Impact on Demand Curve:
Increase in Income: When people's income increases, they can afford to buy more of these goods, so the demand curve shifts to the right. This means at every price level, a higher quantity of the good is demanded.
Decrease in Income: When income decreases, people buy less of these goods, so the demand curve shifts to the left, indicating a lower quantity demanded at each price level.
Inferior Goods:
Definition: Inferior goods are goods for which demand decreases as income increases. Examples include generic brands, instant noodles, or second-hand clothes.
Impact on Demand Curve:
Increase in Income: As people’s income rises, they tend to buy fewer inferior goods, so the demand curve shifts to the left.
Decrease in Income: When income decreases, people may buy more inferior goods, causing the demand curve to shift to the right.
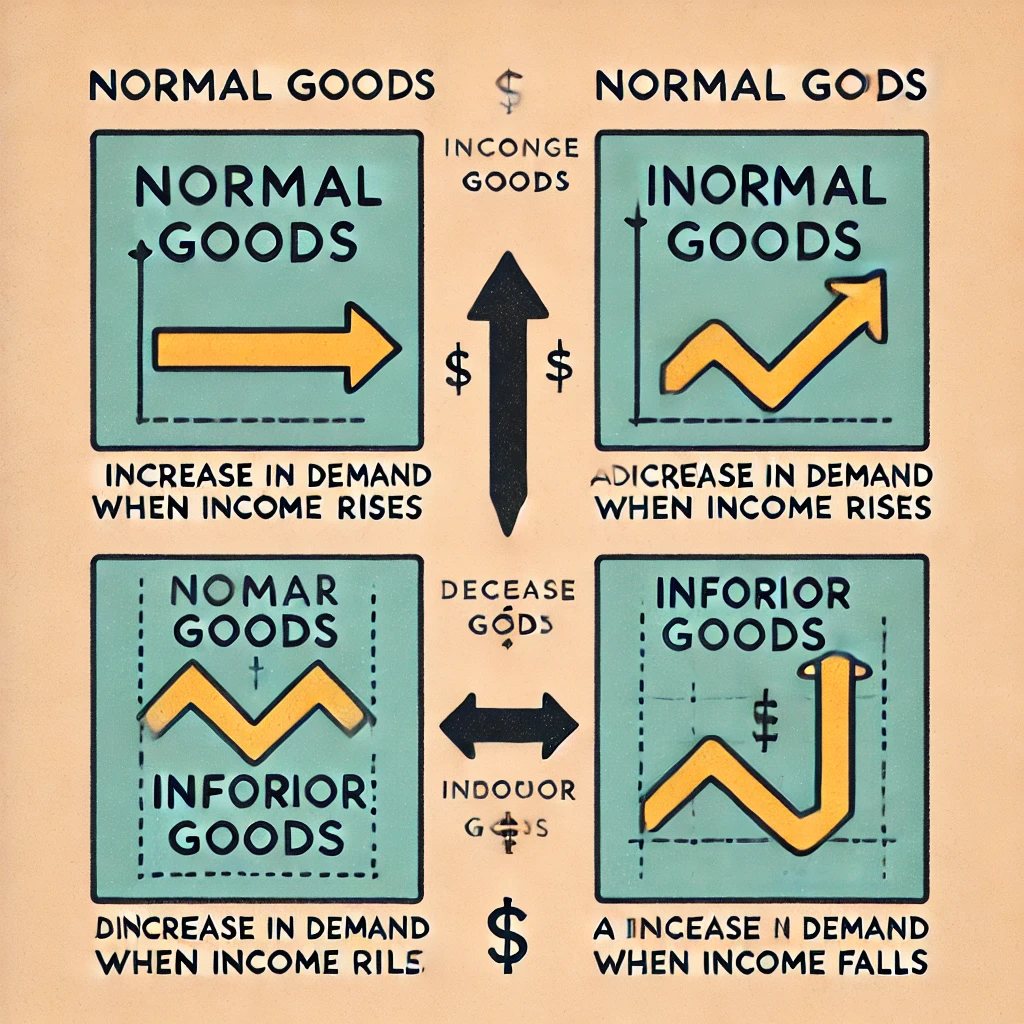
Summary:
Income Increase:
For normal goods: Demand curve shifts right.
For inferior goods: Demand curve shifts left.
Income Decrease:
For normal goods: Demand curve shifts left.
For inferior goods: Demand curve shifts right.
This shift reflects how changes in income affect consumers' purchasing decisions, leading to changes in overall market demand for different types of goods.
What are inferior goods and normal goods? Does a change in income affect both goods the same way?
What Are Inferior Goods and Normal Goods?
Normal Goods:
Definition: Normal goods are goods for which demand increases when income increases. These are typically higher-quality or more desirable products that people buy more of as they have more money.
Examples: New cars, brand-name clothing, dining at restaurants.
Inferior Goods:
Definition: Inferior goods are goods for which demand decreases as income increases. These are usually lower-cost alternatives that people tend to buy less of when they can afford better options.
Examples: Generic brands, instant noodles, second-hand clothes.
Does a Change in Income Affect Both Goods the Same Way?
No, it doesn’t. A change in income affects normal goods and inferior goods in opposite ways:
For Normal Goods:
Income Increases: Demand increases, shifting the demand curve to the right.
Income Decreases: Demand decreases, shifting the demand curve to the left.
For Inferior Goods:
Income Increases: Demand decreases, shifting the demand curve to the left.
Income Decreases: Demand increases, shifting the demand curve to the right.
Summary:
When people have more money, they tend to buy more normal goods and fewer inferior goods. When they have less money, they do the opposite: they buy more inferior goods and fewer normal goods.
Discuss the impact of a change in the price of related goods on the demand curve.
Impact of a Change in the Price of Related Goods on the Demand Curve:
The price of related goods can affect the demand for a particular good in two main ways, depending on whether the goods are substitutes or complements.
1. Substitute Goods:
Definition: Substitute goods are products that can replace each other. If the price of one good rises, consumers may switch to the other good, increasing its demand.
Impact on Demand Curve:
Price of Substitute Increases: If the price of a substitute good rises, the demand for the original good increases, shifting its demand curve to the right.
Example: If the price of coffee increases, people might buy more tea instead, increasing the demand for tea.
Price of Substitute Decreases: If the price of a substitute good decreases, the demand for the original good decreases, shifting its demand curve to the left.
Example: If the price of coffee decreases, people might buy less tea, decreasing the demand for tea.
2. Complementary Goods:
Definition: Complementary goods are products that are used together. If the price of one good changes, it directly affects the demand for its complement.
Impact on Demand Curve:
Price of Complement Increases: If the price of a complementary good increases, the demand for the original good decreases, shifting its demand curve to the left.
Example: If the price of printers increases, the demand for printer ink might decrease because fewer people are buying printers.
Price of Complement Decreases: If the price of a complementary good decreases, the demand for the original good increases, shifting its demand curve to the right.
Example: If the price of smartphones decreases, the demand for smartphone cases might increase because more people are buying phones.
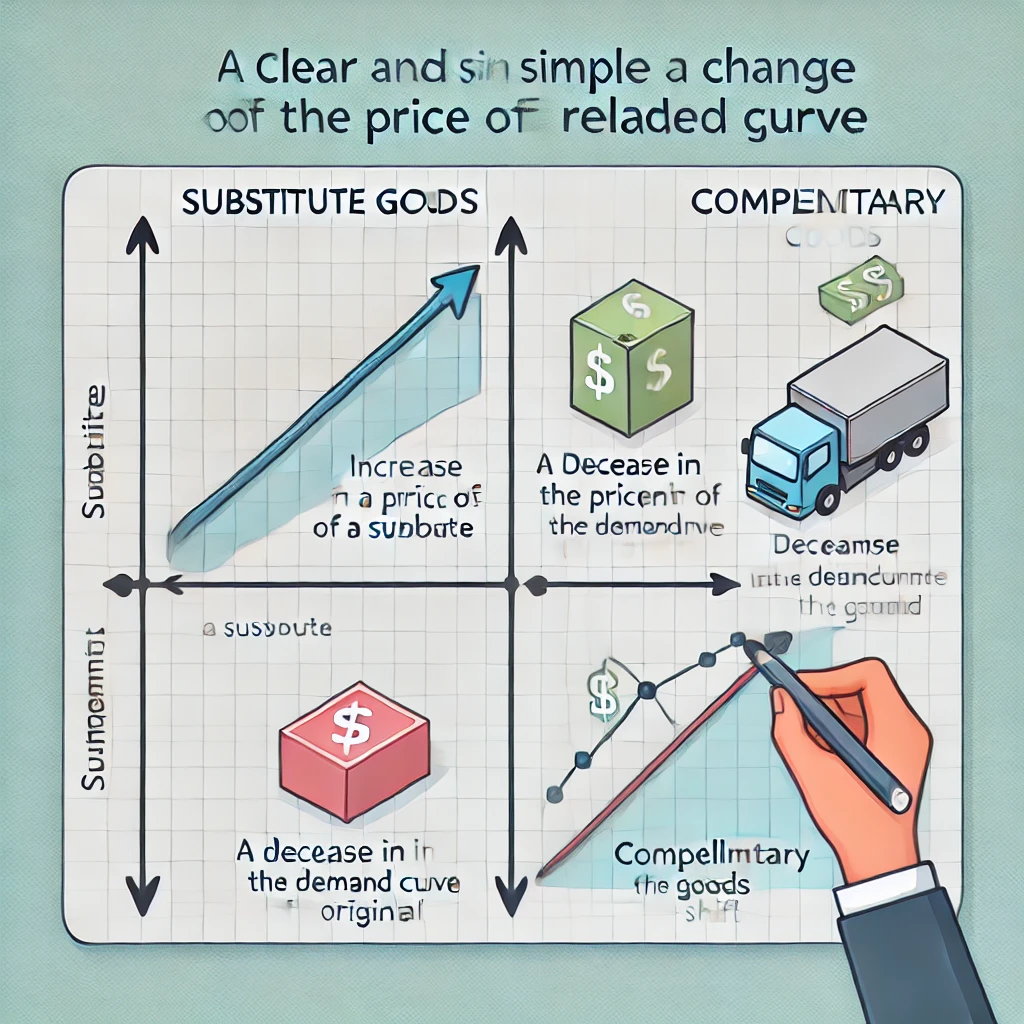
Summary:
Substitute Goods: An increase in the price of a substitute increases demand for the related good (shift right), and a decrease in the price decreases demand (shift left).
Complementary Goods: An increase in the price of a complement decreases demand for the related good (shift left), and a decrease in the price increases demand (shift right).
How are goods related to each other? Discuss the differencenbetween a complement good and a substitute good
How Are Goods Related to Each Other?
Goods can be related to each other in different ways, primarily as complements or substitutes. The relationship between goods affects how the demand for one good changes when the price of another good changes.
Difference Between a Complement Good and a Substitute Good:
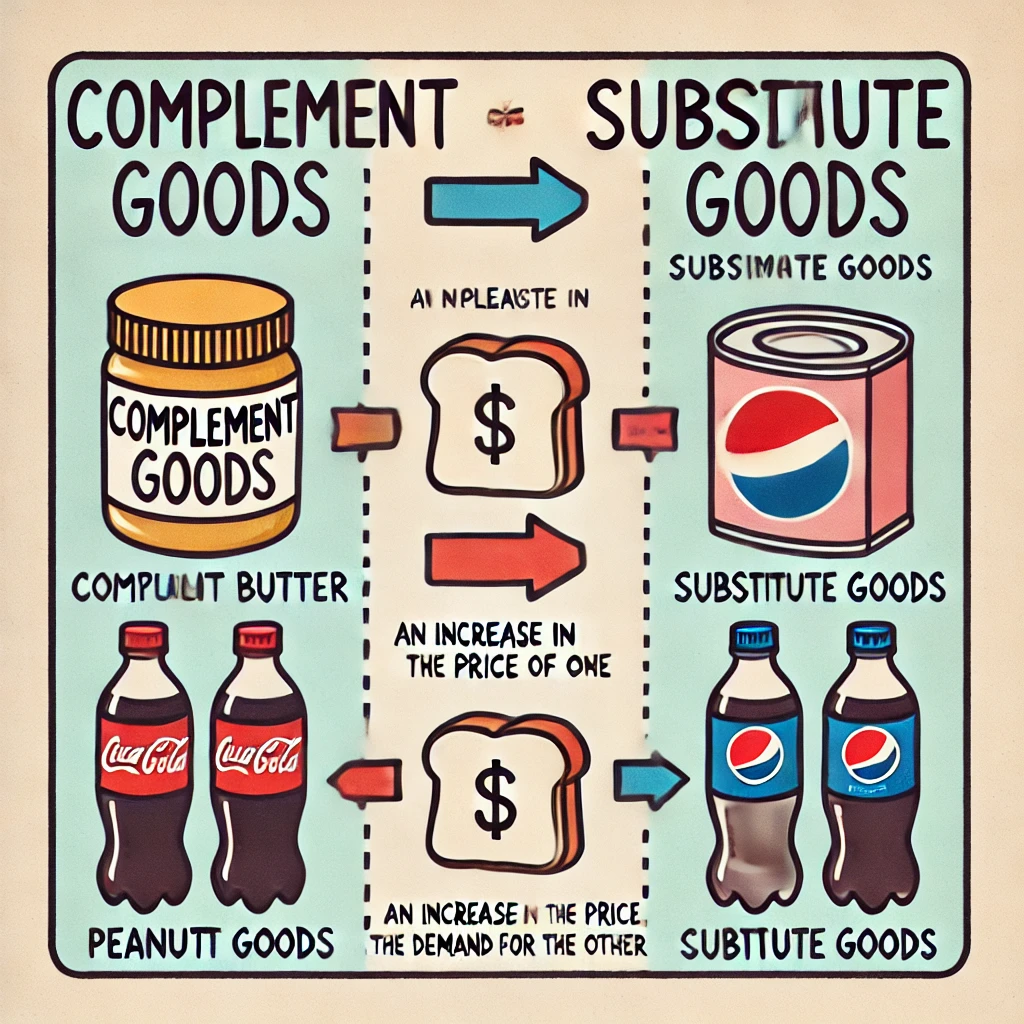
1. Complement Goods:
Definition: Complement goods are products that are typically used together. When you buy one, you usually need or want the other.
Example:
Peanut Butter and Jelly: These are often used together in sandwiches. If the price of peanut butter goes up, people might buy less peanut butter and therefore also buy less jelly.
Impact on Demand:
If the price of one complement increases, the demand for the other usually decreases (demand curve shifts left).
If the price of one complement decreases, the demand for the other usually increases (demand curve shifts right).
2. Substitute Goods:
Definition: Substitute goods are products that can replace each other. If you can’t or don’t want to buy one, you might buy the other instead.
Example:
Coke and Pepsi: If the price of Coke goes up, some people might switch to buying Pepsi instead.
Impact on Demand:
If the price of a substitute increases, the demand for the other good usually increases (demand curve shifts right).
If the price of a substitute decreases, the demand for the other good usually decreases (demand curve shifts left).
Summary:
Complement Goods: Used together, demand for one decreases when the price of the other increases, and vice versa.
Substitute Goods: Used in place of each other, demand for one increases when the price of the other increases, and vice versa.
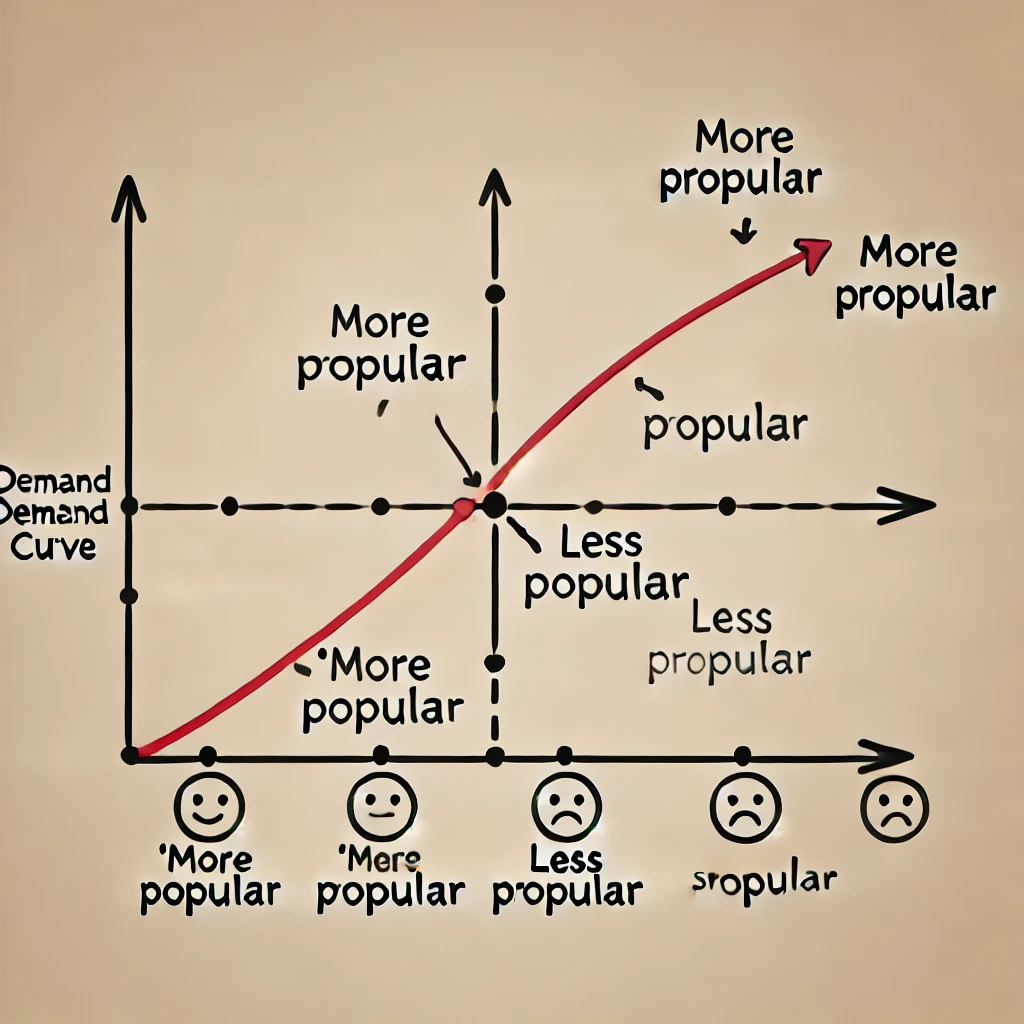
Discuss the impact of a change in tastes and preferences on the demand curve.
Impact of a Change in Tastes and Preferences on the Demand Curve:
Definition: Tastes and preferences refer to the desires and preferences of consumers for certain goods or services. These can be influenced by various factors such as trends, advertising, health considerations, and cultural shifts.
How Tastes and Preferences Affect the Demand Curve:
Increase in Popularity:
Impact: When a good or service becomes more popular or desirable, the demand for it increases.
Demand Curve Shift: The demand curve shifts to the right, meaning that at every price level, consumers are willing to buy more of the good.
Example: If a celebrity endorses a new type of sneaker, and it becomes the latest trend, more people will want to buy that sneaker, increasing its demand.
Decrease in Popularity:
Impact: If a good or service falls out of favor, the demand for it decreases.
Demand Curve Shift: The demand curve shifts to the left, meaning that at every price level, consumers are willing to buy less of the good.
Example: If there’s a health scare related to a particular food item, people might stop buying it, leading to a decrease in demand.
Summary:
A positive change in tastes and preferences (more popularity) causes the demand curve to shift to the right, increasing demand.
A negative change in tastes and preferences (less popularity) causes the demand curve to shift to the left, decreasing demand.
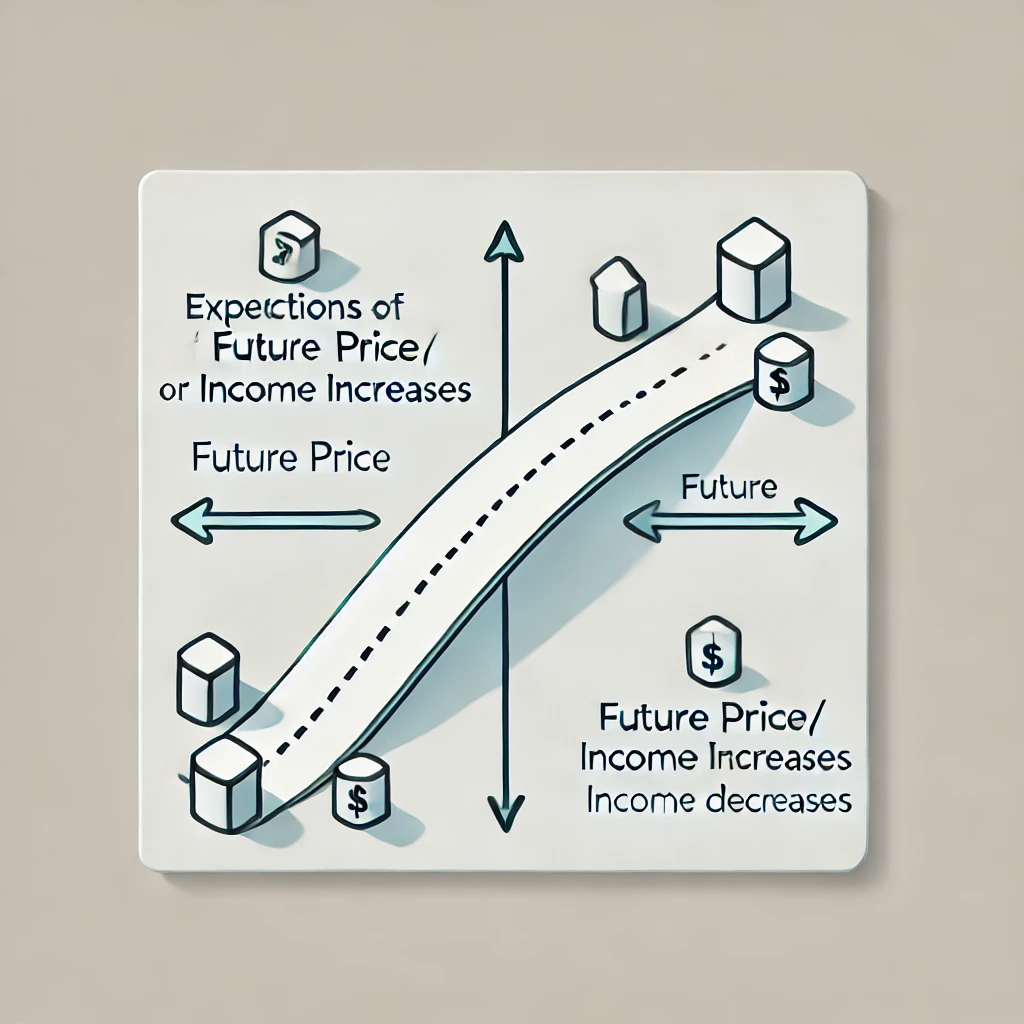
Discuss the impact of a change in expectations of the demand curve. Give examples
Impact of a Change in Expectations on the Demand Curve:
Expectations about the future can significantly influence consumer behavior and, consequently, the demand curve. When consumers expect future changes in prices, income, or the availability of goods, their current demand can shift.
1. Expectations of Future Price Increases:
Impact: If consumers expect the price of a good to rise in the future, they are likely to buy more of it now to avoid paying a higher price later.
Demand Curve Shift: The demand curve shifts to the right, indicating an increase in current demand.
Example: If people expect the price of gasoline to increase next week, they might fill up their tanks now, increasing the current demand for gasoline.
2. Expectations of Future Price Decreases:
Impact: If consumers expect the price of a good to decrease in the future, they may delay their purchases, reducing current demand.
Demand Curve Shift: The demand curve shifts to the left, indicating a decrease in current demand.
Example: If people expect a new smartphone model to be released soon, and the current model's price to drop, they may hold off on buying the current model, reducing its current demand.
3. Expectations of Future Income Changes:
Impact: If consumers expect their income to increase in the future, they may start purchasing more expensive goods now, increasing current demand for normal goods.
Demand Curve Shift: The demand curve shifts to the right.
Example: If someone expects to receive a bonus at work, they might start spending more on luxury items now, increasing demand for those goods.
Conversely, if they expect their income to decrease (e.g., due to a recession or job loss), they might cut back on spending now, decreasing demand for normal goods and shifting the demand curve to the left.
Summary:
Future Price Increase Expected: Demand curve shifts right (current demand increases).
Future Price Decrease Expected: Demand curve shifts left (current demand decreases).
Future Income Increase Expected: Demand curve shifts right (current demand increases for normal goods).
Future Income Decrease Expected: Demand curve shifts left (current demand decreases for normal goods).
Discuss the impact of a change in the number of buyers on the demand curve. Give an example.
Impact of a Change in the Number of Buyers on the Demand Curve:
The number of buyers in a market directly affects the overall demand for a good or service. When the number of buyers increases or decreases, the demand curve shifts accordingly.
1. Increase in the Number of Buyers:
Impact: When more buyers enter the market, the total demand for the good or service increases.
Demand Curve Shift: The demand curve shifts to the right, indicating an increase in demand at every price level.
Example: Imagine a small town where a new factory opens, bringing in a large number of workers and their families. The increased population leads to higher demand for housing, groceries, and other goods, shifting the demand curves for these items to the right.
2. Decrease in the Number of Buyers:
Impact: When the number of buyers in the market decreases, the total demand for the good or service decreases.
Demand Curve Shift: The demand curve shifts to the left, indicating a decrease in demand at every price level.
Example: Suppose a college town experiences a decline in student enrollment. Fewer students lead to reduced demand for local apartments, food, and entertainment, shifting the demand curves for these goods to the left.
Summary:
More Buyers: Demand curve shifts right (demand increases).
Fewer Buyers: Demand curve shifts left (demand decreases).
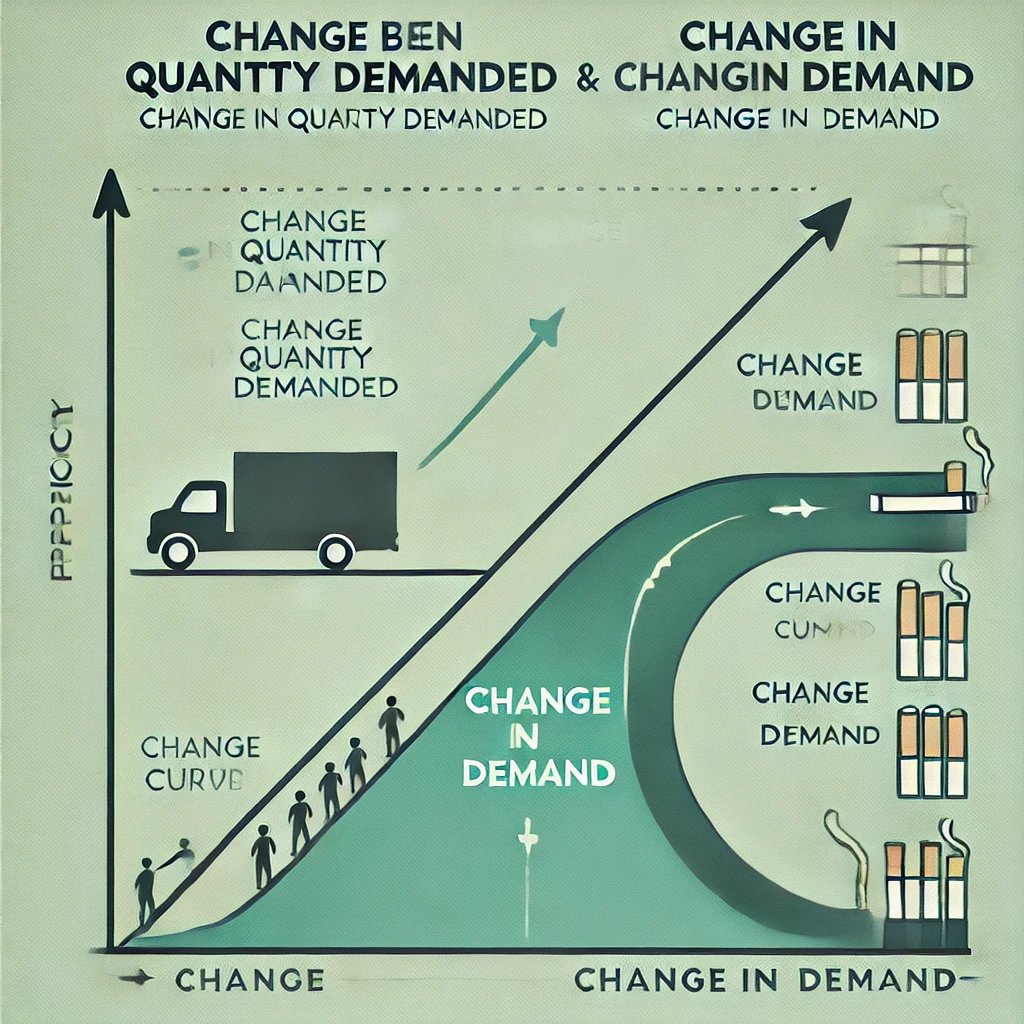
Use the example of smoking to illustrate the difference between a change in the quantity demanded and a change in demand. Change the price of cigarettes. How do customers respond to the price change? Have the CDC report on the dangers of smoking. How do customers respond to the information change? Which one is a change in demand and which is a change in quantity demanded?
Example of Smoking: Illustrating the Difference Between a Change in Quantity Demanded and a Change in Demand
1. Change in Quantity Demanded:
Scenario: Imagine that the price of cigarettes increases due to higher taxes.
Impact: As the price of cigarettes rises, consumers buy fewer cigarettes because they are more expensive.
Response: This is a movement along the same demand curve. The higher price leads to a lower quantity demanded, but the demand curve itself does not shift.
Conclusion: This is a change in quantity demanded because the change in behavior is solely due to a change in the price of cigarettes.
2. Change in Demand:
Scenario: The CDC releases a report highlighting the dangers of smoking, including new evidence linking smoking to severe health risks.
Impact: As a result of this new information, many people decide to quit smoking or never start, even if the price of cigarettes remains the same.
Response: The overall demand for cigarettes decreases, meaning that at every price level, fewer cigarettes are demanded.
Conclusion: This is a change in demand because the demand curve shifts to the left due to a non-price factor (the health information provided by the CDC).
Summary:
Change in Quantity Demanded: Caused by a change in the price of cigarettes. Consumers respond by moving to a different point on the same demand curve.
Change in Demand: Caused by new information about the dangers of smoking. Consumers respond by reducing their demand at all price levels, shifting the demand curve to the left.
Explain the law of supply. Distinguish between a change in supply and a hange in quantity supplied.
The Law of Supply:
Definition: The law of supply states that, all else being equal, as the price of a good or service increases, the quantity supplied increases, and as the price decreases, the quantity supplied decreases. This happens because higher prices provide an incentive for producers to produce and sell more goods, while lower prices reduce the incentive to produce.
Distinguishing Between a Change in Supply and a Change in Quantity Supplied:
1. Change in Quantity Supplied:
Definition: A change in quantity supplied refers to a movement along the existing supply curve due to a change in the price of the good or service.
Cause: It is solely caused by a change in the good’s price.
Example: If the price of wheat increases, farmers may decide to sell more wheat, leading to a movement up along the supply curve.
Visual Representation: The movement along the curve could be shown as moving from one point to another on the same supply curve.
2. Change in Supply:
Definition: A change in supply refers to a shift in the entire supply curve, either to the right (increase in supply) or to the left (decrease in supply).
Cause: This shift is caused by factors other than the good’s price, such as changes in production technology, input costs, number of sellers, or government policies.
Example: If a new technology makes it cheaper to produce wheat, farmers can produce more wheat at every price level, shifting the supply curve to the right.
Visual Representation: The shift of the entire curve to the right or left indicates an increase or decrease in supply.
Summary:
Change in Quantity Supplied: Movement along the supply curve due to a change in price.
Change in Supply: Shift of the entire supply curve due to non-price factors.
A change in price changes which one; supply or change in quantity supplied?
A change in price changes the quantity supplied, not the supply.
Change in Quantity Supplied: This refers to a movement along the supply curve, which occurs when the price of the good or service changes. For example, if the price of a product goes up, producers are typically willing to supply more, resulting in a movement up along the existing supply curve.
Supply: The overall supply of a good refers to the entire supply curve, which can shift due to factors like changes in production technology, input costs, or the number of sellers. A change in price does not shift the supply curve; it only causes movement along the curve.
So, price changes affect the quantity supplied, not the supply itself.
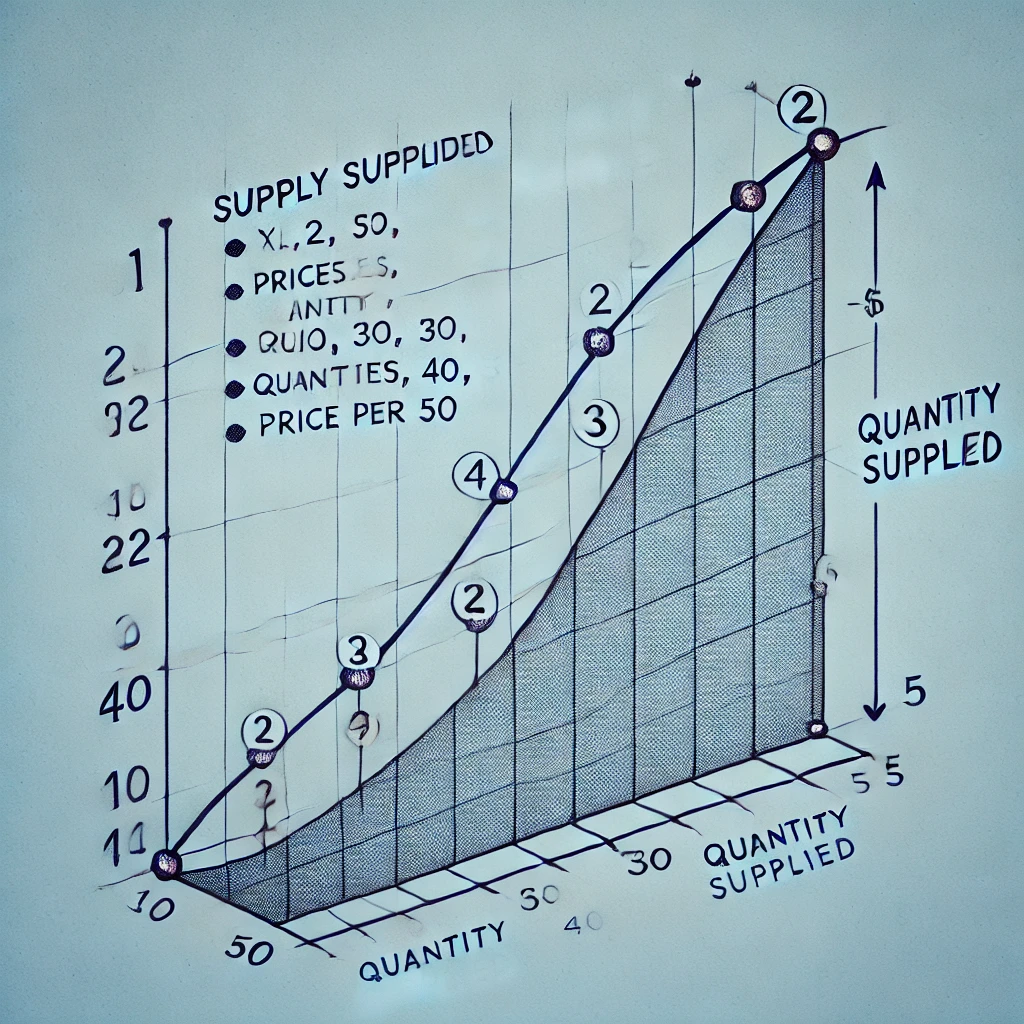
Convert a supply schedule to a graph. Is the graph upward or downward sloping? Why?
Converting a Supply Schedule to a Graph:
A supply schedule is a table that shows the quantity of a good that producers are willing to supply at different prices. To convert this to a graph, you plot the prices on the y-axis (vertical axis) and the quantities supplied on the x-axis (horizontal axis). Each point on the graph represents a price-quantity pair from the supply schedule.
Example Supply Schedule:
Price per Unit | Quantity Supplied |
$1 | 10 |
$2 | 20 |
$3 | 30 |
$4 | 40 |
$5 | 50 |
Plotting the Supply Curve:
X-axis: Quantity Supplied
Y-axis: Price per Unit
When you plot the points from the supply schedule on the graph and connect them, you get the supply curve.
Is the Graph Upward or Downward Sloping?
Upward Sloping: The supply curve is upward sloping, meaning it goes from the bottom left to the top right.
Why Is the Supply Curve Upward Sloping?
Reason: The supply curve is upward sloping because, according to the law of supply, as the price of a good increases, producers are willing to supply more of it. Higher prices provide an incentive for producers to increase production since they can earn more revenue. Conversely, if the price decreases, producers are less willing to supply as much because it’s less profitable.
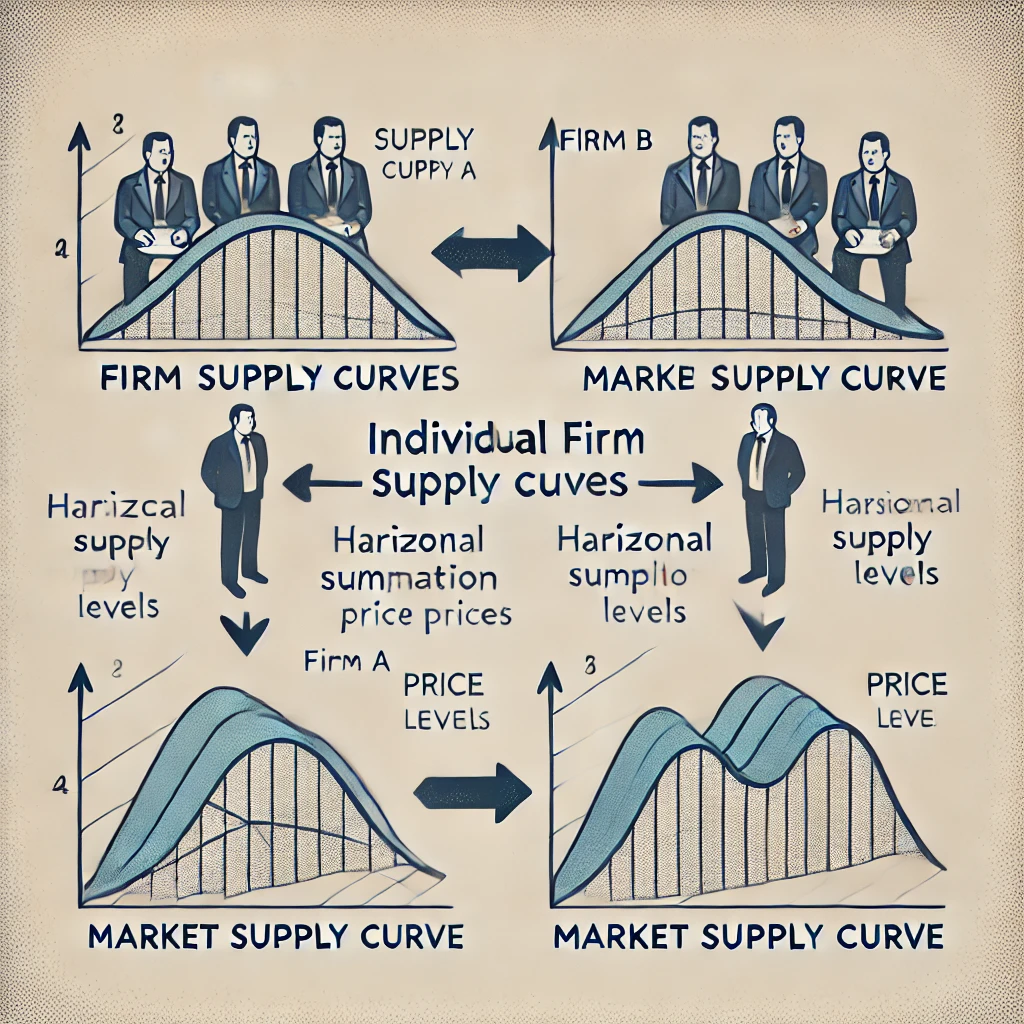
How do we get from individual firm supply to the market supply?
How Do We Get from Individual Firm Supply to Market Supply?
To understand market supply, we need to aggregate or sum up the supply from all individual firms in the market.
Steps to Get from Individual Firm Supply to Market Supply:
Individual Firm Supply:
Each firm has its own supply curve, which shows the quantity of a good that it is willing to supply at different prices.
Horizontal Summation:
To find the market supply, you add up the quantities supplied by all individual firms at each price level. This process is called horizontal summation because you are summing quantities along the horizontal axis (quantity) for a given price level.
Constructing the Market Supply Curve:
After summing the quantities for each price, you plot these total quantities against the price on a graph. The resulting curve is the market supply curve.
The market supply curve also slopes upward, just like the individual supply curves, but it represents the total supply from all firms in the market.
Example:
Individual Firm Supply:
Firm A Supply:
At $1: 10 units
At $2: 20 units
At $3: 30 units
Firm B Supply:
At $1: 5 units
At $2: 15 units
At $3: 25 units
Market Supply:
Summing Quantities:
At $1: 10 (Firm A) + 5 (Firm B) = 15 units
At $2: 20 (Firm A) + 15 (Firm B) = 35 units
At $3: 30 (Firm A) + 25 (Firm B) = 55 units
Market Supply Curve:
Plot the summed quantities (15, 35, 55) against the corresponding prices ($1, $2, $3) to form the market supply curve.
Summary:
The market supply curve is derived by adding up the quantities supplied by all individual firms at each price level. This aggregation gives us a complete picture of the total supply available in the market.
What factors change the supply?
Impact of input prices?
Impact of production technology?
Impact of expectations?
Impact of the number of sellers?
Factors That Change the Supply:
Several factors can cause the supply curve to shift, indicating a change in the quantity of goods that producers are willing to supply at every price level. These factors include input prices, production technology, expectations, and the number of sellers.
1. Impact of Input Prices:
Definition: Input prices refer to the cost of resources needed to produce a good or service, such as labor, raw materials, and capital.
Impact:
Increase in Input Prices: When input prices rise, the cost of production increases, making it less profitable to produce the same quantity of goods. This causes the supply curve to shift to the left, indicating a decrease in supply.
Decrease in Input Prices: When input prices fall, production becomes cheaper, encouraging producers to supply more goods at each price level. This shifts the supply curve to the right, indicating an increase in supply.
2. Impact of Production Technology:
Definition: Production technology refers to the methods and processes used to produce goods and services.
Impact:
Improvement in Technology: Advances in production technology can make production more efficient, reducing costs and allowing producers to supply more at each price level. This shifts the supply curve to the right, indicating an increase in supply.
Technological Decline (Rare): If technology were to become less efficient (although rare), it would reduce the quantity supplied at each price level, shifting the supply curve to the left.
3. Impact of Expectations:
Definition: Expectations refer to producers’ beliefs about future market conditions, such as future prices or demand for their product.
Impact:
Expectations of Higher Future Prices: If producers expect prices to rise in the future, they might hold back some of their current supply to sell later at higher prices, reducing current supply and shifting the supply curve to the left.
Expectations of Lower Future Prices: If producers expect prices to fall in the future, they might increase their current supply to sell more before prices drop, shifting the supply curve to the right.
4. Impact of the Number of Sellers:
Definition: The number of sellers in a market refers to the total number of businesses or producers supplying a particular good or service.
Impact:
Increase in Number of Sellers: When more sellers enter the market, the total market supply increases because more goods are being produced at each price level. This shifts the supply curve to the right.
Decrease in Number of Sellers: When sellers leave the market, the total market supply decreases, shifting the supply curve to the left.
Summary:
Input Prices: Higher input prices decrease supply (shift left); lower input prices increase supply (shift right).
Production Technology: Improved technology increases supply (shift right); declining technology would decrease supply (shift left).
Expectations: Expectations of higher future prices decrease current supply (shift left); expectations of lower future prices increase current supply (shift right).
Number of Sellers: More sellers increase supply (shift right); fewer sellers decrease supply (shift left).
What is the market equilibrium and how is it achieved? What does “market clearing price” mean? Is it the same as the equilibrium price?
What Is Market Equilibrium and How Is It Achieved?
Market equilibrium is the point where the quantity of a good or service demanded by consumers equals the quantity supplied by producers. At this point, the market is "balanced," and there is no tendency for the price to change, assuming other factors remain constant.
How Is Market Equilibrium Achieved?
Interaction of Supply and Demand: Market equilibrium is achieved through the interaction of supply and demand.
If the price is too high: There will be a surplus of goods (supply exceeds demand). Producers will lower prices to sell the excess stock.
If the price is too low: There will be a shortage (demand exceeds supply). Consumers will bid up prices as they compete for the limited goods available.
Adjustments: These price adjustments continue until the quantity demanded equals the quantity supplied, and the market reaches equilibrium.
What Does “Market Clearing Price” Mean?
Market Clearing Price: This is the price at which the quantity demanded equals the quantity supplied, meaning all goods produced are sold, and there are no leftover goods or unmet consumer demand. It "clears" the market of any surplus or shortage.
Is the Market Clearing Price the Same as the Equilibrium Price?
Yes: The market clearing price is the same as the equilibrium price. Both terms describe the price at which the market is in balance, with no surplus or shortage.
Summary:
Market Equilibrium: The point where supply equals demand, with no pressure to change prices.
Market Clearing Price/Equilibrium Price: The price at which market equilibrium is achieved, where the quantity supplied equals the quantity demanded.
What is a surplus in a market? What causes it?
What Is a Surplus in a Market?
Definition: A surplus occurs in a market when the quantity supplied of a good or service exceeds the quantity demanded at the current price. In other words, there are more goods available than consumers are willing or able to buy.
What Causes a Surplus?
Price Above Equilibrium:
Main Cause: A surplus is typically caused when the price of a good or service is set above the equilibrium price. At this higher price, producers are willing to supply more, but consumers are not willing to buy as much, leading to excess supply.
Example: If a company sets the price of its product too high, they might produce more than what consumers are willing to purchase, resulting in a surplus of unsold goods.
Increase in Supply Without a Corresponding Increase in Demand:
If producers increase the supply of a good (e.g., due to better technology or more resources) but the demand remains unchanged, it can lead to a surplus.
Example: If farmers have a particularly good harvest and produce more wheat than usual, but the demand for wheat remains the same, there will be a surplus of wheat.
Summary:
A surplus occurs when the quantity supplied exceeds the quantity demanded.
It is typically caused by prices being set too high, leading to less consumer demand at those higher prices.
Surpluses can also occur if supply increases significantly without a matching increase in demand.
What is a shortage in a market? What causes it?
What Is a Shortage in a Market?
Definition: A shortage occurs in a market when the quantity demanded of a good or service exceeds the quantity supplied at the current price. This means there aren’t enough goods available to meet the demand at that price level.
What Causes a Shortage?
Price Below Equilibrium:
Main Cause: A shortage typically occurs when the price of a good or service is set below the equilibrium price. At this lower price, consumers want to buy more of the good than producers are willing to supply.
Example: If the price of a popular new smartphone is set too low, more people will want to buy it than the number of phones available, leading to a shortage.
Decrease in Supply Without a Corresponding Decrease in Demand:
If there is a sudden reduction in supply (e.g., due to production issues, natural disasters, or supply chain disruptions) without a matching decrease in demand, it can lead to a shortage.
Example: If a natural disaster destroys a large portion of the wheat crop, the supply of wheat decreases, but the demand remains the same, leading to a shortage of wheat.
Summary:
A shortage occurs when the quantity demanded exceeds the quantity supplied.
It is typically caused by prices being set too low, leading to higher consumer demand and insufficient supply.
Shortages can also occur if supply decreases significantly without a corresponding decrease in demand.
Do either shortages or surpluses exist in a well-functioning market? Why not?
Do Shortages or Surpluses Exist in a Well-Functioning Market?
In a well-functioning market, shortages and surpluses do not persist for long. Here’s why:
1. Market Mechanism and Price Adjustments:
Price Adjustments: In a well-functioning market, prices adjust to balance supply and demand. This self-correcting mechanism helps eliminate shortages and surpluses.
Eliminating Surpluses:
If there is a surplus (excess supply), the price tends to decrease. As prices fall, demand increases, and supply decreases, moving the market back toward equilibrium.
Eliminating Shortages:
If there is a shortage (excess demand), the price tends to increase. As prices rise, demand decreases, and supply increases, again moving the market toward equilibrium.
2. Role of Market Equilibrium:
Market Equilibrium: The point where the quantity demanded equals the quantity supplied is known as the equilibrium price. In a well-functioning market, this price naturally emerges, ensuring that there is no persistent shortage or surplus.
Market Clearing: At the equilibrium price, the market "clears," meaning all goods produced are sold, and all consumer demands are met.
Summary:
Shortages and surpluses do not exist in a well-functioning market for long because prices adjust to bring the market back to equilibrium. The market mechanism ensures that supply matches demand over time, eliminating persistent imbalances.
How does the market react to a change in either supply or demand?
Explain, using an example, the steps a market takes to go from one equilibrium to another.
How Does the Market React to a Change in Either Supply or Demand?
When there is a change in either supply or demand, the market responds by moving toward a new equilibrium. The process involves price adjustments that help balance the new levels of supply and demand. Here's how it works, with an example:
Example: Increase in Demand for Electric Cars
1. Initial Equilibrium:
Starting Point: Imagine the market for electric cars is in equilibrium. The quantity of electric cars demanded equals the quantity supplied, and the price is stable.
2. Change in Demand:
Scenario: Suppose there is an increase in demand for electric cars due to rising environmental awareness and government incentives for purchasing electric vehicles.
Impact on Demand Curve: The demand curve shifts to the right, meaning at every price level, more people want to buy electric cars.
3. Market Reaction:
Initial Shortage: At the original price, the quantity demanded now exceeds the quantity supplied, creating a shortage.
Price Increase: In response to the shortage, producers raise the prices of electric cars. This price increase incentivizes producers to supply more cars (movement along the supply curve) and also reduces the quantity demanded by some consumers (movement along the new demand curve).
4. New Equilibrium:
Adjustment Process: The market continues to adjust until the quantity supplied equals the new quantity demanded at a higher price.
New Equilibrium: Eventually, the market reaches a new equilibrium at a higher price and quantity, where the increased demand is fully met by the supply.
Summary:
Change in Demand or Supply: A shift in the demand or supply curve creates a temporary imbalance (shortage or surplus).
Price Adjustment: The market adjusts prices to restore balance, encouraging changes in quantity supplied and demanded.
New Equilibrium: The market reaches a new equilibrium where the new levels of supply and demand are balanced.
What is the difference between elastic demand and inelastic demand?
What factors determine the degree of elastic demand?
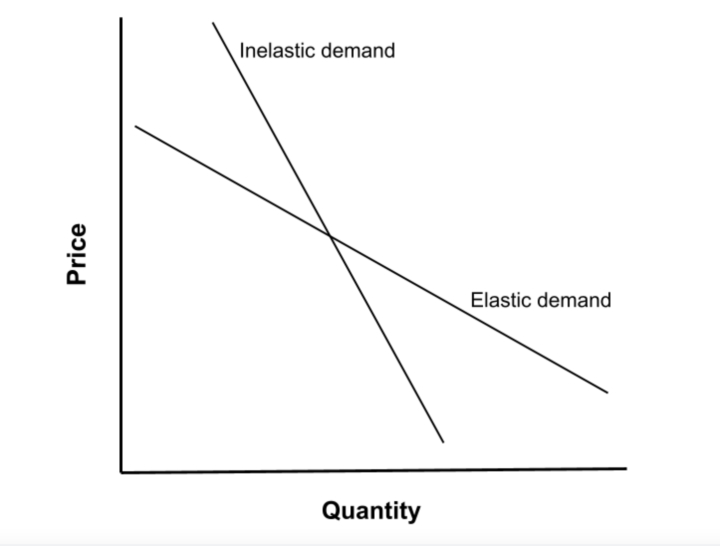
Difference Between Elastic Demand and Inelastic Demand:
Elastic Demand:
Definition: Demand is considered elastic when a small change in price leads to a significant change in the quantity demanded. In other words, consumers are highly responsive to price changes.
Example: Luxury items like high-end electronics or vacations often have elastic demand because if the price increases, many consumers will decide not to buy them.
Inelastic Demand:
Definition: Demand is considered inelastic when a change in price has little to no effect on the quantity demanded. Consumers are less responsive to price changes.
Example: Necessities like gasoline or insulin have inelastic demand because people will continue to buy them even if the price increases significantly.
Factors That Determine the Degree of Elastic Demand:
Availability of Substitutes:
More Substitutes: If there are many close substitutes available, demand is more elastic because consumers can easily switch to a different product if the price rises.
Fewer Substitutes: If there are few or no substitutes, demand is more inelastic because consumers have fewer alternatives.
Necessity vs. Luxury:
Necessities: Goods that are necessities tend to have inelastic demand because people need them regardless of price (e.g., basic food items, medication).
Luxuries: Luxury goods tend to have elastic demand because people can forgo them if prices rise.
Proportion of Income:
High Proportion: Goods that take up a large proportion of a consumer’s income tend to have more elastic demand because price increases make a significant impact on the budget (e.g., housing).
Low Proportion: Goods that take up a small proportion of income tend to have inelastic demand because price changes don’t greatly affect the consumer’s overall spending.
Time Horizon:
Long-Term: Demand tends to be more elastic in the long term because consumers have more time to find substitutes or adjust their behavior.
Short-Term: Demand is often inelastic in the short term because consumers may not have the time or ability to change their habits quickly.
Addictiveness or Habitual Consumption:
Addictive Goods: Products that are addictive or habit-forming tend to have inelastic demand because consumers find it difficult to reduce consumption even if prices rise (e.g., cigarettes, alcohol).
Summary:
Elastic Demand: Sensitive to price changes; quantity demanded changes significantly.
Inelastic Demand: Insensitive to price changes; quantity demanded changes little.
Factors determining elasticity include the availability of substitutes, whether the good is a necessity or luxury, the proportion of income spent on the good, the time horizon, and the degree of habitual or addictive consumption.
Explain the importance of close substitutes to elasticity of demand
Explain the difference between necessities and luxuries and their
impact on elasticity.
How does defining a market broadly or narrowly affect the degree of
elasticity?
What impact does the time horizon have on elasticity? Is the short-run
more or less elastic than the long-run?
Importance of Close Substitutes to Elasticity of Demand:
Close Substitutes: Products that can easily replace each other are considered close substitutes.
Impact on Elasticity: The availability of close substitutes makes demand more elastic. When the price of a good with many substitutes rises, consumers can easily switch to a different product, leading to a significant decrease in the quantity demanded of the original good.
Example: If the price of butter increases, many consumers may switch to margarine or other spreads. This makes the demand for butter more elastic.
Difference Between Necessities and Luxuries and Their Impact on Elasticity:
Necessities:
Definition: Goods that are essential for daily life, like food, water, or medicine.
Impact on Elasticity: Necessities tend to have inelastic demand because consumers will buy them regardless of price changes. Even if the price increases, people still need these goods, so the quantity demanded changes very little.
Luxuries:
Definition: Non-essential goods that enhance quality of life, like luxury cars, vacations, or designer clothing.
Impact on Elasticity: Luxuries tend to have elastic demand because consumers can easily forego these items if prices rise. A higher price can lead to a significant decrease in the quantity demanded.
How Defining a Market Broadly or Narrowly Affects the Degree of Elasticity:
Broad Market Definition:
Example: The market for "food."
Impact on Elasticity: Broadly defined markets tend to have more inelastic demand because there are fewer close substitutes available within the broad category.
Narrow Market Definition:
Example: The market for "organic apples."
Impact on Elasticity: Narrowly defined markets tend to have more elastic demand because consumers can more easily find substitutes within the specific category.
Impact of the Time Horizon on Elasticity:
Short-Run vs. Long-Run Elasticity:
Short-Run:
Less Elastic: In the short run, demand is typically less elastic because consumers and producers have less time to adjust their behavior. For example, if the price of gasoline suddenly increases, consumers might not immediately reduce their usage because they still need to commute or run errands.
Long-Run:
More Elastic: Over the long run, demand tends to be more elastic because consumers and producers have more time to find alternatives and adjust their habits. Continuing with the gasoline example, over time, people might buy more fuel-efficient cars, use public transportation, or move closer to work, reducing the quantity of gasoline demanded.
Summary:
Close Substitutes: Increase elasticity because consumers can easily switch products.
Necessities vs. Luxuries: Necessities have inelastic demand; luxuries have elastic demand.
Market Definition: Broadly defined markets have inelastic demand; narrowly defined markets have elastic demand.
Time Horizon: Demand is less elastic in the short run and more elastic in the long run due to the time it takes for consumers and producers to adjust.
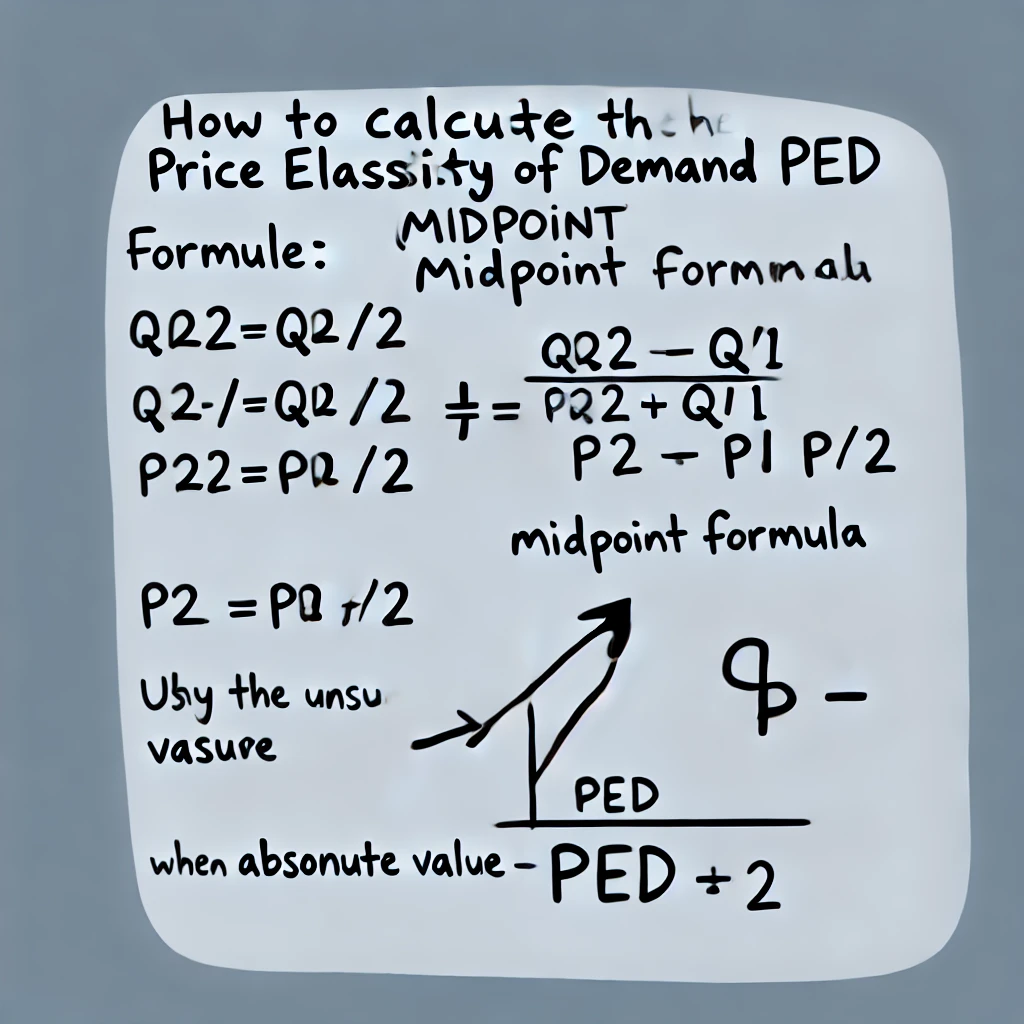
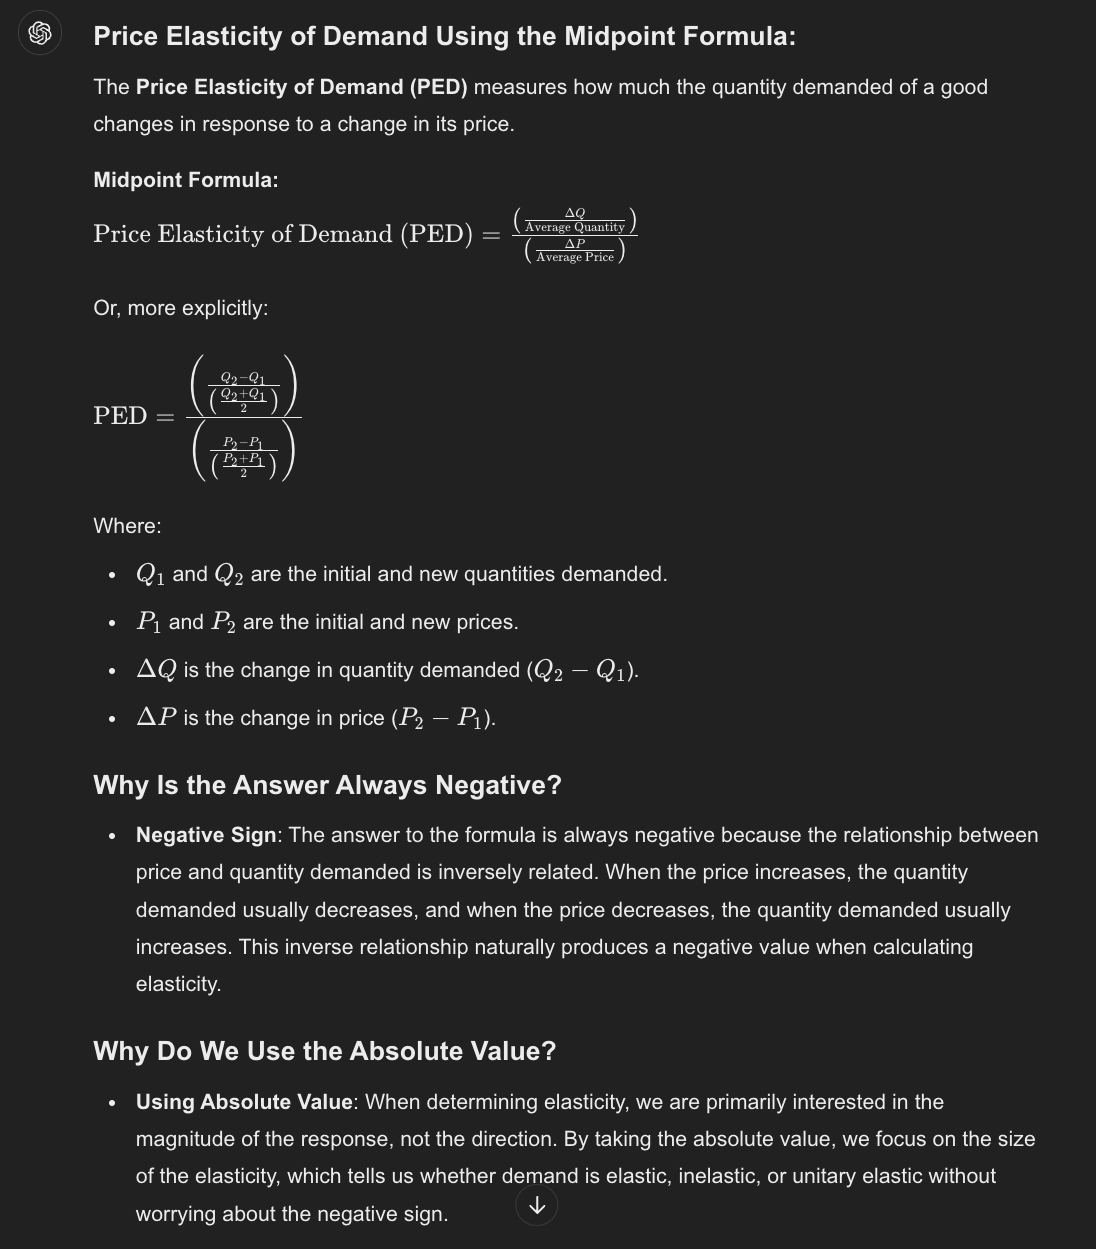
Calculate the Price Elasticity of Demand using the midpoint formula. Memorize the formula. Why is the answer to the formula always negative? Why do we want to use the absolute value of the answer when we are determining elasticity?
Summary:
Midpoint Formula: Memorize the formula to calculate PED.
Negative Sign: The answer is always negative due to the inverse relationship between price and quantity demanded.
Absolute Value: We use the absolute value to assess the strength of the response, ignoring the negative sign to focus on elasticity.
What are the names that we attach to the 5 categories of Demand Curves?
The five categories of demand curves are classified based on their elasticity. Each category describes how responsive the quantity demanded is to changes in price. Here are the names and descriptions of the five categories:
Perfectly Inelastic Demand (PED = 0):
Description: The quantity demanded does not change at all, regardless of changes in price. The demand curve is a vertical line.
Example: Life-saving medications, where people will pay any price for the necessary amount.
Inelastic Demand (0 < PED < 1):
Description: The quantity demanded changes, but only slightly, in response to price changes. The demand curve is relatively steep.
Example: Necessities like gasoline or basic food items.
Unitary Elastic Demand (PED = 1):
Description: The percentage change in quantity demanded is exactly equal to the percentage change in price. The demand curve has a typical slope.
Example: Certain consumer goods where total spending remains constant when price changes.
Elastic Demand (PED > 1):
Description: The quantity demanded changes significantly in response to price changes. The demand curve is relatively flat.
Example: Luxury goods, like designer clothing or high-end electronics.
Perfectly Elastic Demand (PED = ∞):
Description: The quantity demanded changes infinitely with even the smallest change in price. The demand curve is a horizontal line.
Example: Products in a perfectly competitive market where consumers will only buy at one price and no higher.
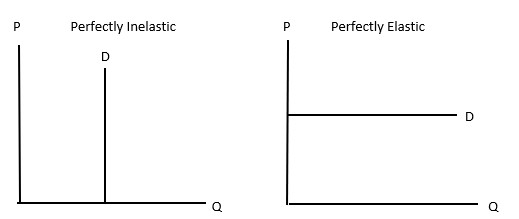
What is a Perfectly Inelastic Demand curve? Draw a picture of one with two different prices. How much does the quantity demanded changed when the price changes? What is the calculated P.E.D. for a perfectly inelastic demand curve?
A Perfectly Inelastic Demand Curve is a type of demand curve where the quantity demanded remains constant regardless of changes in price. This means that no matter how much the price increases or decreases, consumers will purchase the same quantity of the good or service.
Characteristics of a Perfectly Inelastic Demand Curve:
Shape: The demand curve is a vertical line.
Quantity Demanded: It does not change with price; it stays the same at all price levels.
Price Elasticity of Demand (P.E.D.): The P.E.D. for a perfectly inelastic demand curve is 0. This is because the percentage change in quantity demanded is 0, regardless of any percentage change in price.
What is an inelastic demand curve? How does it differ from a perfectly inelastic demand curve? From an elastic demand curve?
Inelastic Demand Curve
An Inelastic Demand Curve represents a situation where the quantity demanded of a good or service changes with a change in price, but the change in quantity is relatively small compared to the change in price. In other words, consumers are not very responsive to price changes.
Characteristics:
Shape: The demand curve is steep but downward-sloping.
Quantity Demanded: Changes, but not significantly, in response to price changes.
Price Elasticity of Demand (P.E.D.): The P.E.D. for an inelastic demand curve is less than 1 but greater than 0, indicating that the percentage change in quantity demanded is less than the percentage change in price.
Comparison with Perfectly Inelastic Demand Curve
Perfectly Inelastic Demand Curve: The quantity demanded does not change at all with changes in price. It is represented by a vertical line, and its P.E.D. is 0.
Inelastic Demand Curve: The quantity demanded changes slightly with changes in price. It is represented by a steep downward-sloping curve, and its P.E.D. is between 0 and 1.
Comparison with Elastic Demand Curve
Elastic Demand Curve: The quantity demanded changes significantly with a change in price. It is represented by a flatter downward-sloping curve, and its P.E.D. is greater than 1.
Inelastic Demand Curve: The quantity demanded changes, but not as significantly as with an elastic demand curve. The P.E.D. is less than 1, indicating lower responsiveness to price changes.

What is an elastic demand curve? Draw a picture of one and put two prices and corresponding quantity demanded. Which changes the most, the price or the quantity? Is the calculated PED greater than or equal to or less than 1?
An Elastic Demand Curve represents a situation where the quantity demanded of a good or service changes significantly in response to changes in price. In this case, consumers are highly responsive to price changes.
Characteristics:
Shape: The demand curve is flatter and slopes downward.
Quantity Demanded: Changes significantly with small changes in price.
Price Elasticity of Demand (P.E.D.): The P.E.D. for an elastic demand curve is greater than 1. This indicates that the percentage change in quantity demanded is greater than the percentage change in price.

What is a perfectly elastic demand curve? What is the PED for it?
A Perfectly Elastic Demand Curve represents a situation where the quantity demanded of a good or service is infinitely responsive to any change in price. This means that even a tiny increase in price would cause the quantity demanded to drop to zero, while any decrease in price would lead to an infinite increase in quantity demanded.
Characteristics:
Shape: The demand curve is a horizontal line.
Quantity Demanded: Changes drastically with any price change, either dropping to zero with a price increase or becoming infinitely large with a price decrease.
Price Elasticity of Demand (P.E.D.): The P.E.D. for a perfectly elastic demand curve is infinite. This indicates that consumers are extremely sensitive to price changes, with the quantity demanded being infinitely elastic.
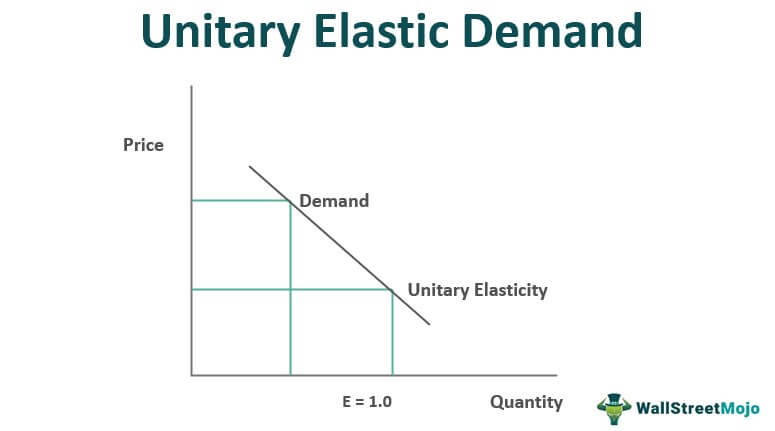
What is a unit elastic demand curve? What is the PED for it?
A Unit Elastic Demand Curve represents a situation where the percentage change in quantity demanded is exactly equal to the percentage change in price. This means that the total revenue remains constant when the price changes because the increase in price is offset by a proportionate decrease in quantity demanded, and vice versa.
Characteristics:
Shape: The demand curve is a downward-sloping curve that is neither steep nor flat.
Quantity Demanded: Changes in exact proportion to changes in price.
Price Elasticity of Demand (P.E.D.): The P.E.D. for a unit elastic demand curve is exactly 1. This indicates that the responsiveness of quantity demanded to price changes is perfectly balanced.
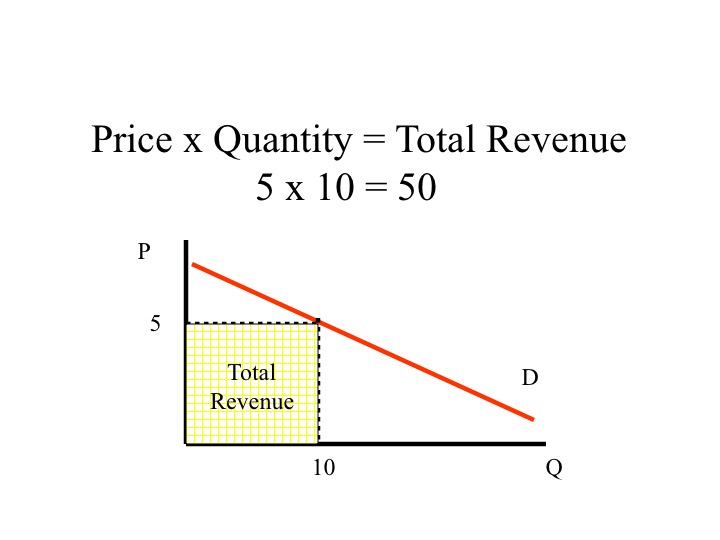
What is Total Revenue and how is it calculated? Is total demand equal to total expenditure? Why? Give an example.
What is Total Revenue?
Total Revenue is the total amount of money a firm earns from selling its goods or services. It is a key concept in economics, particularly in the study of demand and pricing.
How is Total Revenue Calculated?
Total Revenue (TR) is calculated by multiplying the price per unit of the good or service by the quantity of the good or service sold:
Is Total Revenue Equal to Total Expenditure?
Yes, total revenue is equal to total expenditure from the perspective of the consumer.
Total Revenue (TR): From the seller's point of view, it's the money earned from selling goods.
Total Expenditure (TE): From the buyer's point of view, it's the money spent on purchasing goods.
Since the amount a buyer spends (total expenditure) on a product is the same amount the seller earns (total revenue) from selling it, these two concepts are equal.
Example
Imagine a company selling smartphones:
Price per smartphone: $500
Quantity sold: 100 units
Total Revenue (TR) would be calculated as:
TR=$500×100=$50,000
This $50,000 is also the total expenditure by consumers who bought the smartphones.

What happens to total revenue when price is raised and demand is elastic?
When the price is raised and demand is elastic, total revenue decreases. This happens because, in an elastic demand scenario, consumers are highly responsive to price changes.
Explanation:
Elastic Demand: If the price elasticity of demand (PED) is greater than 1, the percentage decrease in quantity demanded is greater than the percentage increase in price.
Impact on Total Revenue: Since the quantity demanded drops significantly, the reduction in quantity outweighs the increase in price, leading to a decrease in total revenue.
Example:
Let's say a company sells a product at $10, and the demand is elastic. They decide to raise the price to $12.
Original Situation:
Price = $10
Quantity Sold = 100 units
Total Revenue = $10 * 100 = $1,000
After Price Increase:
New Price = $12
Quantity Sold = 70 units (because demand is elastic, quantity demanded drops significantly)
New Total Revenue = $12 * 70 = $840
As you can see, the total revenue decreased from $1,000 to $840 after the price increase.

What happens to total revenue when price is raised and demand is inelastic?
When the price is raised and demand is inelastic, total revenue increases. This is because, in an inelastic demand scenario, consumers are not very responsive to price changes.
Explanation:
Inelastic Demand: If the price elasticity of demand (PED) is less than 1, the percentage decrease in quantity demanded is smaller than the percentage increase in price.
Impact on Total Revenue: Since the quantity demanded decreases only slightly, the increase in price more than compensates for the loss in quantity, leading to an increase in total revenue.
Example:
Let's say a company sells a product at $10, and the demand is inelastic. They decide to raise the price to $12.
Original Situation:
Price = $10
Quantity Sold = 100 units
Total Revenue = $10 * 100 = $1,000
After Price Increase:
New Price = $12
Quantity Sold = 95 units (because demand is inelastic, quantity demanded drops only slightly)
New Total Revenue = $12 * 95 = $1,140
As you can see, the total revenue increased from $1,000 to $1,140 after the price increase.

What happens to total revenue when price is lowered and demand is inelastic?
When the price is lowered and demand is inelastic, total revenue decreases. This is because, in an inelastic demand scenario, consumers are not very responsive to price changes.
Explanation:
Inelastic Demand: If the price elasticity of demand (PED) is less than 1, the percentage increase in quantity demanded is smaller than the percentage decrease in price.
Impact on Total Revenue: Since the quantity demanded increases only slightly, the reduction in price more than offsets the small gain in quantity, leading to a decrease in total revenue.
Example:
Let's say a company sells a product at $10, and the demand is inelastic. They decide to lower the price to $8.
Original Situation:
Price = $10
Quantity Sold = 100 units
Total Revenue = $10 * 100 = $1,000
After Price Decrease:
New Price = $8
Quantity Sold = 105 units (because demand is inelastic, quantity demanded increases only slightly)
New Total Revenue = $8 * 105 = $840
As you can see, the total revenue decreased from $1,000 to $840 after the price decrease.

What happens to total revenue when price is lowered and demand is elastic?
When the price is lowered and demand is elastic, total revenue increases. This is because, in an elastic demand scenario, consumers are highly responsive to price changes.
Explanation:
Elastic Demand: If the price elasticity of demand (PED) is greater than 1, the percentage increase in quantity demanded is greater than the percentage decrease in price.
Impact on Total Revenue: Since the quantity demanded increases significantly, the increase in quantity outweighs the reduction in price, leading to an increase in total revenue.
Example:
Let's say a company sells a product at $10, and the demand is elastic. They decide to lower the price to $8.
Original Situation:
Price = $10
Quantity Sold = 100 units
Total Revenue = $10 * 100 = $1,000
After Price Decrease:
New Price = $8
Quantity Sold = 150 units (because demand is elastic, quantity demanded increases significantly)
New Total Revenue = $8 * 150 = $1,200
As you can see, the total revenue increased from $1,000 to $1,200 after the price decrease.

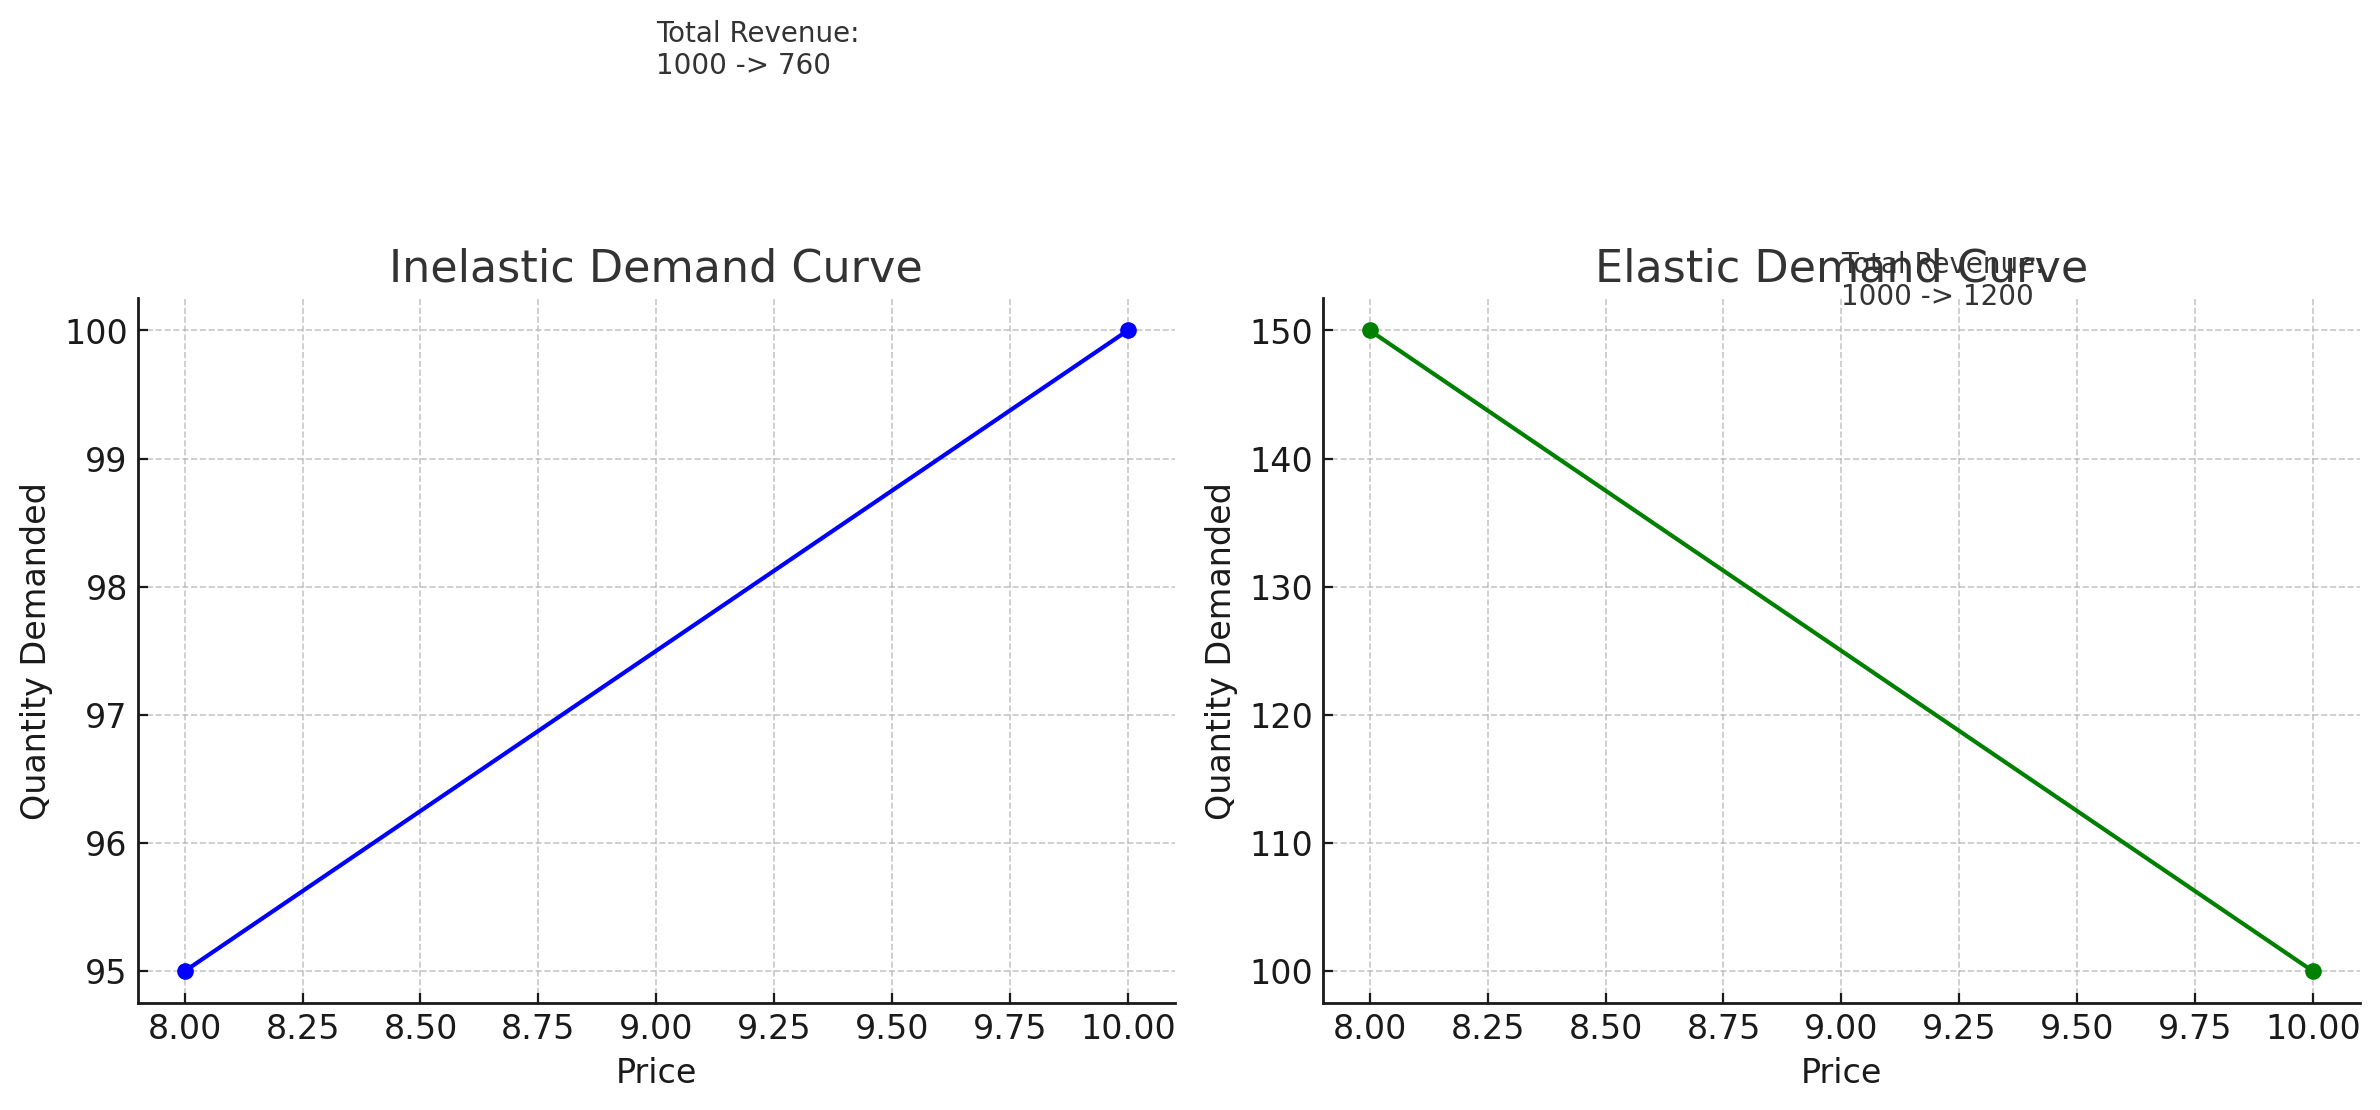
Draw two different demand graphs, one for an inelastic demand and one for elastic demand. Map out a price change on each graph and measure the changes in total revenue in each case. Do it mathematically and graphically
Here are the two demand graphs, one for inelastic demand and one for elastic demand, showing price changes and their impact on total revenue:
Inelastic Demand:
Price decreases from $10 to $8.
Quantity demanded increases slightly from 100 to 95 units.
Total Revenue decreases from $1,000 to $760.
Elastic Demand:
Price decreases from $10 to $8.
Quantity demanded increases significantly from 100 to 150 units.
Total Revenue increases from $1,000 to $1,200.
These graphs and the math show how price changes affect total revenue differently for inelastic and elastic demand.
How is it possible to raise your price and collect less money from your customers?
It is possible to raise your price and collect less money from your customers if the demand for your product is elastic. When demand is elastic, consumers are highly responsive to price changes, meaning that a small increase in price leads to a significant decrease in the quantity demanded.
Here's why this happens:
Elastic Demand (PED > 1): In an elastic demand scenario, raising prices will cause a large number of customers to stop buying the product or reduce their quantity purchased. The drop in quantity demanded is so significant that the loss in sales outweighs the gains from the higher price.
Example:
Suppose you sell a product at $10 per unit and sell 100 units per day, earning $1,000 in total revenue. If you raise the price to $12 and demand is elastic, the quantity demanded may drop drastically to, say, 60 units.
Old Total Revenue: $10 * 100 units = $1,000
New Total Revenue: $12 * 60 units = $720
Despite raising the price, you collect less money because the drop in quantity sold more than offsets the price increase.
This situation typically occurs with goods that have many substitutes or are not considered essential by consumers. When prices rise, people switch to alternatives or stop buying the product altogether.
How is it possible to lower your price and collect more money from your customers? Give examples of both situations.
Situation 1: Elastic Demand (PED > 1)
When demand is elastic, consumers are highly responsive to price changes. Lowering the price encourages more people to buy, or it entices customers to purchase more units of the product.
Example:
Imagine you sell a product for $10 per unit and sell 100 units per day, earning $1,000 in total revenue. You decide to lower the price to $8.
Old Price: $10
Old Quantity: 100 units
Old Total Revenue: $10 * 100 = $1,000
After lowering the price to $8, demand increases significantly, and you now sell 150 units.
New Price: $8
New Quantity: 150 units
New Total Revenue: $8 * 150 = $1,200
In this case, by lowering the price, you increased total revenue from $1,000 to $1,200, because the quantity demanded increased significantly.
Situation 2: Inelastic Demand (PED < 1)
In contrast, if the demand is inelastic, lowering the price will not increase total revenue. In this case, customers are not very responsive to price changes, and while you may sell a few more units, the lower price will result in less total revenue.
Example:
Suppose you sell a product for $10 and sell 100 units per day, earning $1,000. You lower the price to $8, but demand only increases slightly to 105 units.
Old Price: $10
Old Quantity: 100 units
Old Total Revenue: $10 * 100 = $1,000
New Price: $8
New Quantity: 105 units
New Total Revenue: $8 * 105 = $840
In this case, lowering the price results in a decrease in total revenue because the quantity demanded increased only slightly.
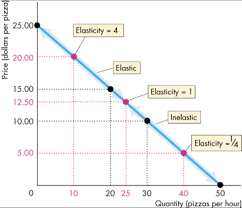
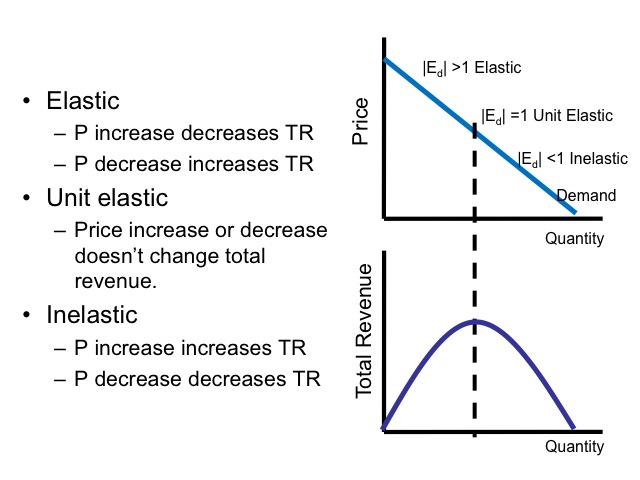
On a linear demand curve, where are the elastic, inelastic, and unit elastic regions of the graph? Prove it to yourself using the numbers in the textbook example. Why is this true?
On a linear demand curve, the elasticity varies along the curve, with different regions representing elastic, inelastic, and unit elastic demand. Here’s how these regions are distributed:
Regions on a Linear Demand Curve:
Elastic Region: The upper portion of the demand curve, where the price is high and quantity demanded is low. Here, a small percentage change in price leads to a large percentage change in quantity demanded, making the demand elastic (PED > 1).
Unit Elastic Point: The midpoint of the demand curve, where the percentage change in price equals the percentage change in quantity demanded. At this point, the demand is unit elastic (PED = 1).
Inelastic Region: The lower portion of the demand curve, where the price is low and quantity demanded is high. In this region, a large percentage change in price leads to a small percentage change in quantity demanded, making the demand inelastic (PED < 1).
Why Is This True?
This distribution occurs because of the relationship between the price, quantity, and total revenue as you move along the demand curve:
Elastic Region: In the upper part of the curve, price is high and quantity is low. A reduction in price causes a large increase in quantity demanded, leading to an increase in total revenue. Thus, demand is elastic here.
Unit Elastic Point: At the midpoint, the price decrease is perfectly offset by the increase in quantity demanded, so total revenue remains constant. Here, the demand is unit elastic.
Inelastic Region: In the lower part of the curve, price is low and quantity is high. A reduction in price leads to only a small increase in quantity demanded, so total revenue decreases. Thus, demand is inelastic in this region.

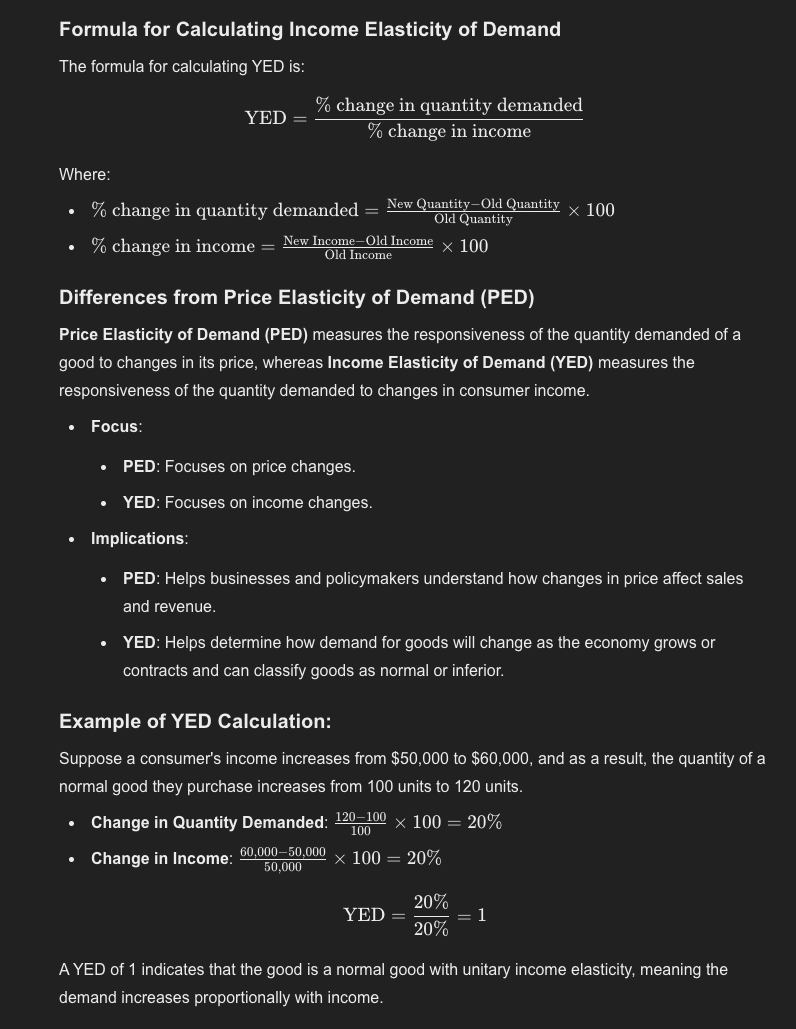
What is the income elasticity of demand and how does it differ from the price elasticity of demand? What is the formula for calculating it?
Income Elasticity of Demand (YED) measures how the quantity demanded of a good changes in response to changes in consumer income. It indicates whether a good is a normal good or an inferior good:
Normal Goods: For normal goods, the quantity demanded increases as consumer income increases, resulting in a positive YED.
Inferior Goods: For inferior goods, the quantity demanded decreases as consumer income increases, leading to a negative YED.
What is the difference between a normal good and an inferior good? Can an engineer tell which good in inferior good by examining its physical quality? Why not? Are grits and inferior good because they are badly made? Explain.
Difference Between a Normal Good and an Inferior Good
Normal Good: A normal good is a good for which demand increases as consumer income increases. Essentially, people buy more of it when they have more money. Examples include organic food, electronics, and branded clothing.
Inferior Good: An inferior good is a good for which demand decreases as consumer income increases. When people have more money, they tend to buy less of these goods, often opting for higher-quality substitutes. Examples include generic brands, instant noodles, and bus rides.
Can an Engineer Determine an Inferior Good by Examining Its Physical Quality?
No, an engineer cannot determine whether a good is inferior simply by examining its physical quality. The classification of a good as "inferior" or "normal" is based on consumer behavior in response to changes in income, not on the physical attributes or quality of the product.
Why Not? The classification depends on how consumers perceive and substitute goods based on their income levels. An inferior good is not necessarily of poor quality; it is simply a product that consumers choose to buy less of as their income increases.
Are Grits an Inferior Good Because They Are Badly Made?
No, grits are not considered an inferior good because they are badly made. The quality of the product has nothing to do with whether it is classified as a normal or inferior good. Grits could be an inferior good if, as consumer income rises, people tend to buy less of them and instead purchase more expensive alternatives like quinoa or couscous.
Explanation: The classification of grits as an inferior good would be based on consumer purchasing patterns, not on their physical quality. Even if grits are well-made and enjoyed by consumers, if people tend to buy less of them when they can afford more expensive alternatives, then they could be classified as an inferior good.
Summary:
Normal Goods: Demand increases with income.
Inferior Goods: Demand decreases with income.
Quality vs. Inferiority: The physical quality of a product does not determine whether it is an inferior good. The classification depends on consumer choices and behavior as income changes.


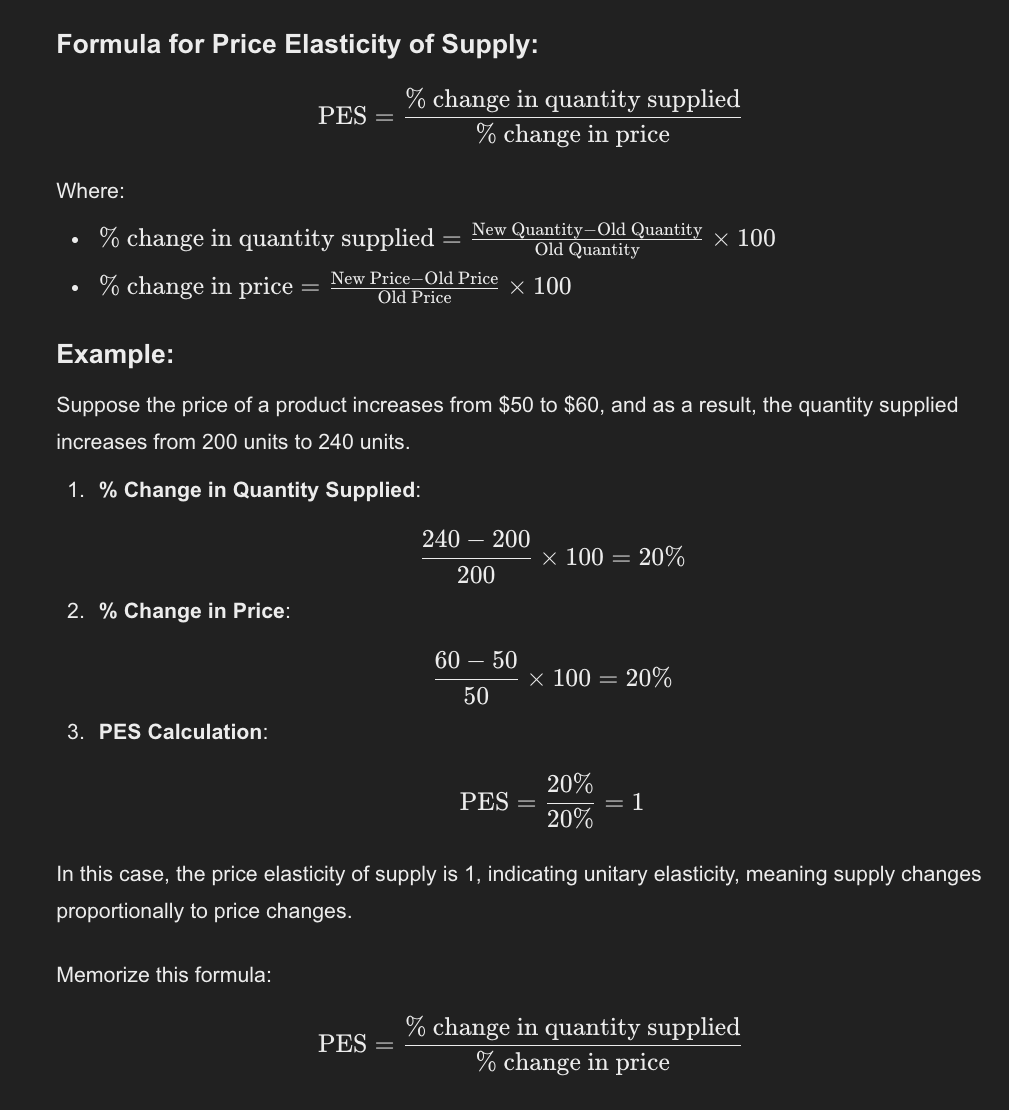
What is the price elasticity of supply and what does it measure? How is it calculated? Memorize the formula.
Price Elasticity of Supply (PES)
Price Elasticity of Supply (PES) measures how responsive the quantity supplied of a good is to a change in its price. It shows the degree to which producers adjust the quantity they produce in response to price changes.
What Does It Measure?
PES measures the sensitivity of the quantity supplied to price changes. A high PES indicates that producers can quickly increase supply when prices rise, while a low PES means that supply changes slowly or not at all in response to price changes.
Elastic Supply: If PES > 1, the supply is elastic, meaning producers can easily increase production.
Inelastic Supply: If PES < 1, the supply is inelastic, meaning it is difficult for producers to increase supply quickly.
What names do we give to the variety of supply curves based on the elasticity of supply?
The variety of supply curves based on the elasticity of supply are named according to how responsive the quantity supplied is to price changes. Here are the main types:
Perfectly Inelastic Supply:
Elasticity: PES = 0
Description: Quantity supplied remains constant regardless of price changes. The supply curve is a vertical line.
Example: Fixed resources like land or unique artwork, where the quantity cannot be changed.
Inelastic Supply:
Elasticity: 0 < PES < 1
Description: A percentage change in price leads to a smaller percentage change in quantity supplied. The supply curve is steep.
Example: Agricultural products in the short term, where increasing supply is difficult.
Unit Elastic Supply:
Elasticity: PES = 1
Description: A percentage change in price results in an equal percentage change in quantity supplied. The supply curve is a straight line from the origin.
Example: Some manufactured goods where production can be adjusted proportionally to price changes.
Elastic Supply:
Elasticity: PES > 1
Description: A percentage change in price leads to a larger percentage change in quantity supplied. The supply curve is relatively flat.
Example: Goods that can be produced quickly with flexible resources, such as clothing.
Perfectly Elastic Supply:
Elasticity: PES = ∞ (infinity)
Description: Any small change in price causes an infinite change in quantity supplied. The supply curve is a horizontal line.
Example: Commodities in perfectly competitive markets where producers can supply any amount at a given price.
Summary of Supply Curve Types:
Perfectly Inelastic Supply (PES = 0): Vertical line.
Inelastic Supply (0 < PES < 1): Steep upward-sloping line.
Unit Elastic Supply (PES = 1): A straight line from the origin.
Elastic Supply (PES > 1): Flat upward-sloping line.
Perfectly Elastic Supply (PES = ∞): Horizontal line.
Describe and explain the difference between perfectly inelastic supply, inelastic supply, elastic supply, and perfectly inelastic supply.
1. Perfectly Inelastic Supply (PES = 0)
Description: In a perfectly inelastic supply scenario, the quantity supplied does not change at all, regardless of any changes in price. The supply curve is a vertical line.
Explanation: This occurs when the quantity of a good cannot be increased or decreased, no matter how high or low the price goes. This is typical for goods that have a fixed supply, such as unique works of art, natural resources, or land in a specific location.
Example: A rare painting by a famous artist cannot have its supply increased, even if the price increases significantly.
2. Inelastic Supply (0 < PES < 1)
Description: Inelastic supply means that the quantity supplied responds to price changes, but only slightly. The supply curve is steep but still sloping upward.
Explanation: This usually happens when producers find it difficult to increase production quickly, even if the price increases. The production process might involve long lead times, limited raw materials, or other constraints.
Example: Agricultural products like wheat have inelastic supply in the short term because it takes time to grow crops, even if the price of wheat increases.
3. Elastic Supply (PES > 1)
Description: Elastic supply occurs when the quantity supplied responds significantly to changes in price. The supply curve is flatter and slopes upward.
Explanation: Producers can quickly ramp up production when prices increase, and they can scale back easily when prices decrease. This happens when inputs are readily available, and the production process is flexible.
Example: Manufactured goods like electronics have elastic supply because producers can relatively quickly increase production in response to higher prices by adjusting factory outputs or hiring more workers.
4. Perfectly Elastic Supply (PES = ∞)
Description: In perfectly elastic supply, producers are willing to supply an infinite quantity at a specific price, but if the price drops even slightly, the quantity supplied falls to zero. The supply curve is a horizontal line.
Explanation: This situation occurs in perfectly competitive markets, where producers can sell as much as they want at a prevailing market price but will supply nothing if the price falls even a little. There are many producers, and the product is easily reproducible.
Example: A commodity like wheat in a highly competitive market might have perfectly elastic supply, as sellers can provide any amount at the market price, but they would sell nothing if the price drops even slightly below that level.
Summary of Key Differences:
Perfectly Inelastic Supply: Quantity supplied is fixed and does not respond to price changes (vertical line).
Inelastic Supply: Quantity supplied changes slightly with price (steep upward-sloping line).
Elastic Supply: Quantity supplied changes significantly with price (flatter upward-sloping line).
Perfectly Elastic Supply: Quantity supplied is infinitely responsive to price, but only at one specific price (horizontal line).
Explain why a technological breakthrough in wheat production can actually lower the revenue of wheat farmers. See the example in your text. Why would governments try to reduce the amount of crops grown by farmers during the depression?
Summary:
A technological breakthrough in wheat production can lower farmers' revenue if the increased supply lowers prices, and the demand for wheat is inelastic.
During the Great Depression, governments reduced crop production to prevent price drops caused by oversupply, stabilizing farmers' incomes.
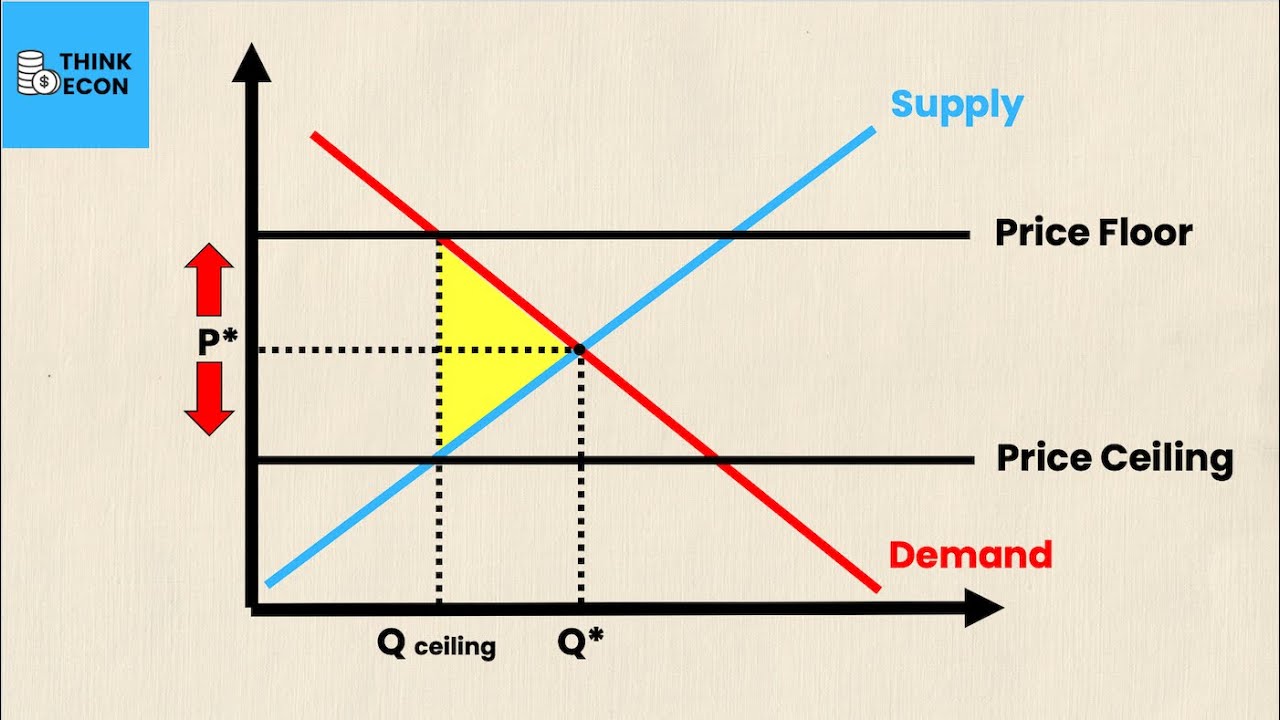
Define price ceiling and price floor. Explain the difference between a price ceiling and a price floor.
Summary of Differences:
A price ceiling keeps prices lower than the market would naturally allow, benefiting consumers but often leading to shortages.
A price floor keeps prices higher than the market would naturally allow, benefiting producers but often leading to surpluses.


What is a binding price control vs a non-binding price control? Is the Federal minimum wage of $7.25 a binding price control in Atlanta at the current time? Explain.
Binding vs. Non-Binding Price Controls
Binding Price Control: A price control that does affect the market by forcing prices to stay above or below equilibrium.
Binding Price Ceiling: Set below the market price, causing a shortage (more demand than supply).
Binding Price Floor: Set above the market price, causing a surplus (more supply than demand).
Non-Binding Price Control: A price control that does not affect the market because the market price is already within the allowed range.
Non-Binding Price Ceiling: Set above the market price, having no effect.
Non-Binding Price Floor: Set below the market price, having no effect.
Is the Federal Minimum Wage of $7.25 Binding in Atlanta?
No, the $7.25 federal minimum wage is non-binding in Atlanta. Wages in the city are generally higher than $7.25, so the law doesn't affect most employers. The market wage is above the minimum, making the law ineffective in this case.
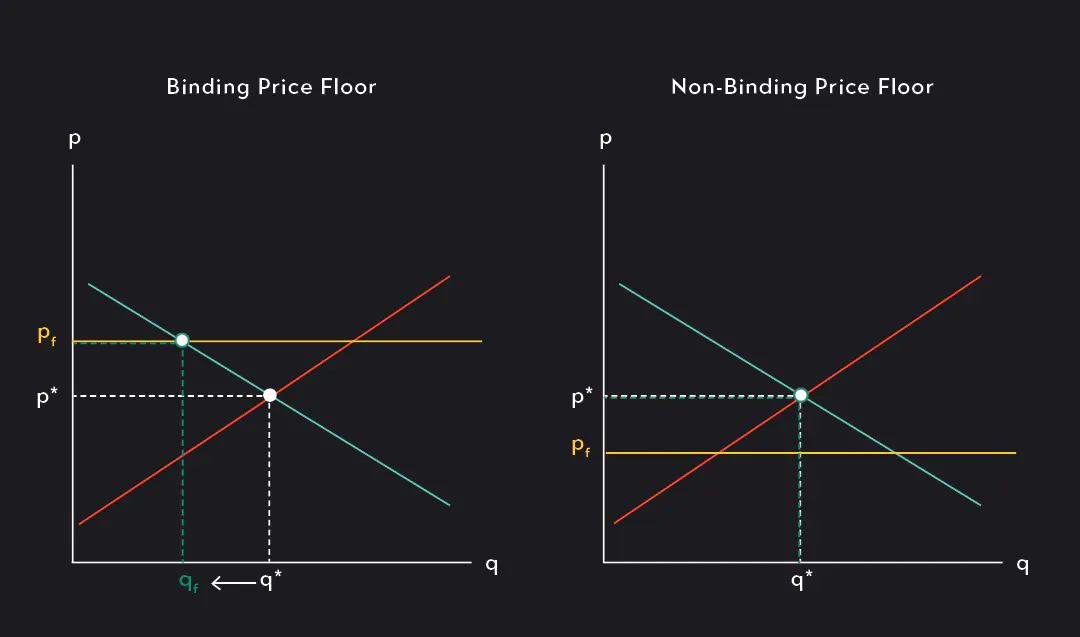
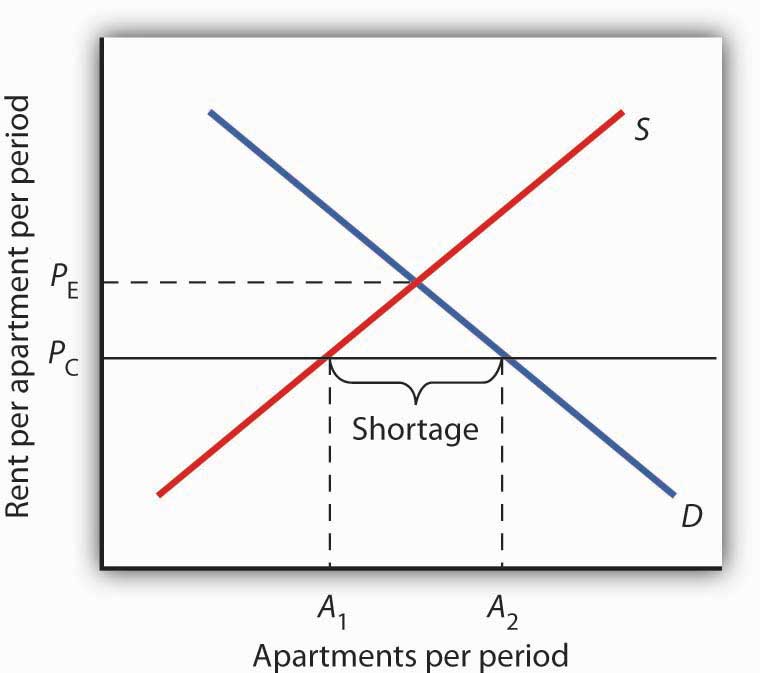
Explain what a shortage is and why a certain kind of price control can cause it? What type of price control causes the shortage?
What is a Shortage?
A shortage occurs when the quantity demanded of a good or service exceeds the quantity supplied at a given price. In other words, there aren’t enough products available for all the people who want to buy them.
How Does a Price Control Cause a Shortage?
A price ceiling is a type of price control that can cause a shortage. A price ceiling is when the government sets a maximum price that sellers can charge, which is below the market equilibrium price (the price where supply equals demand).
Why It Causes a Shortage:
At the lower, government-controlled price, more consumers want to buy the product because it’s cheaper, increasing demand.
However, producers are less willing to supply the product at this low price because they earn less profit, decreasing supply.
This results in excess demand—a shortage.
Example:
Rent control is a price ceiling. If the government caps rent below the market price, more people want to rent apartments (high demand), but landlords may offer fewer apartments or neglect maintenance (low supply), leading to a shortage of available rental units.


Explain what a surplus is and what kind of price control causes it. Can a non-binding price control cause a shortage or surplus?
What is a Surplus?
A surplus occurs when the quantity supplied of a good or service exceeds the quantity demanded at a given price. This means there are more products available than consumers want to buy.
What Kind of Price Control Causes a Surplus?
A price floor is the type of price control that causes a surplus. A price floor sets a minimum price that sellers must charge, which is above the market equilibrium price (the price where supply equals demand).
Why It Causes a Surplus:
At the higher, government-controlled price, producers are more willing to supply the good because they can make more profit, increasing supply.
However, consumers are less willing to buy the product at this higher price, decreasing demand.
This results in excess supply—a surplus.
Example:
Minimum wage is a price floor. If the government sets a minimum wage above the market rate, businesses may reduce hiring (lower demand for labor), but more people may want jobs at the higher wage (higher supply of labor). This creates a surplus of workers, leading to unemployment.
Can a Non-Binding Price Control Cause a Shortage or Surplus?
No, a non-binding price control cannot cause a shortage or surplus because it doesn’t affect the market price. If a price ceiling is set above the market price or a price floor is set below the market price, the market will continue to operate at its equilibrium, and the control has no impact
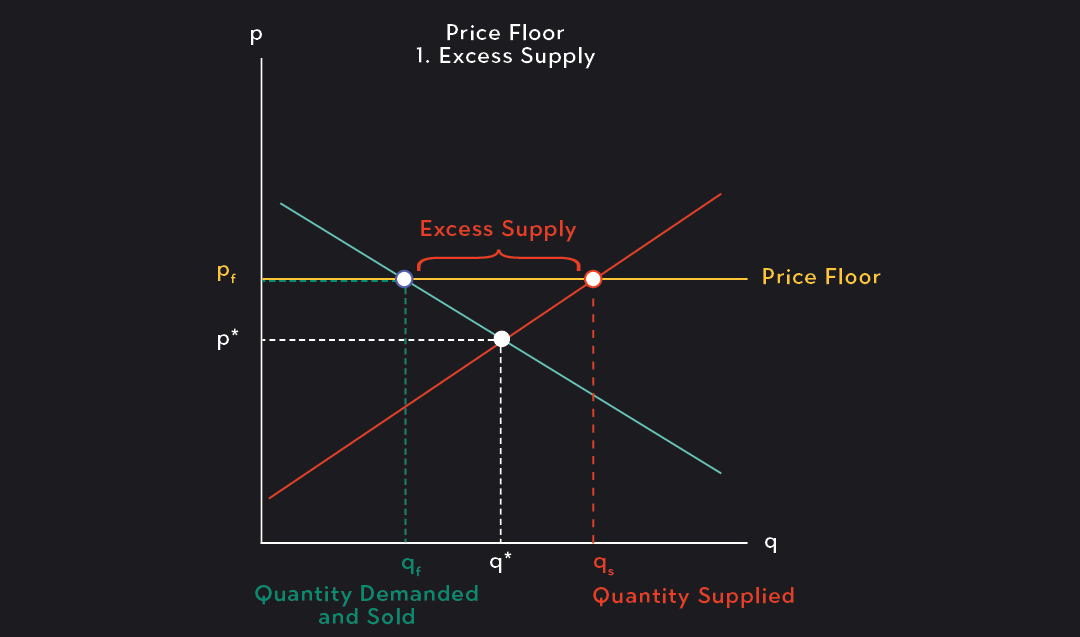
Explain how the OPEC oil crisis caused gas lines in the early 1970’s. What impact did price controls have on the issue? Using this crisis as an example, explain how a non-binding price control can be turned into a binding price control.
Conclusion:
The OPEC oil crisis reduced the supply of oil, which naturally raised prices. The U.S. government's price controls prevented gas prices from rising to reflect the shortage, turning a non-binding price ceiling into a binding one, which worsened the gas shortage and caused long lines at gas stations.


Is rent control and example of a price ceiling or floor?
Rent control is an example of a price ceiling.
Price Ceiling: It sets a maximum price that landlords can charge for rent, which is typically below the market equilibrium price.
Effect: Rent control is designed to make housing more affordable, but because it keeps prices artificially low, it can lead to a shortage of available rental units. Landlords may be less willing to rent out properties or maintain them due to reduced profits.
In summary, rent control limits how high rents can go, making it a price ceiling.

Is the minimum wage law and example of a price ceiling or floor?
The minimum wage law is an example of a price floor.
Price Floor: It sets a minimum price (in this case, the wage) that employers are required to pay workers. The minimum wage is set above the market equilibrium wage to ensure workers earn a certain minimum income.
Effect: If the minimum wage is higher than the equilibrium wage, it can lead to a surplus of labor, meaning more people are willing to work at the higher wage, but employers may hire fewer workers due to the increased cost, resulting in unemployment.
In summary, the minimum wage law sets a legal minimum on wages, making it a price floor.


What problems do rent controls cause?
Rent controls cause the following problems:
Housing Shortages: Rent control sets prices below market equilibrium, leading to higher demand but lower supply, creating a shortage of rental units.
Lower Quality: Landlords earn less revenue, reducing their incentive to maintain or improve properties, leading to deteriorating housing quality.
Misallocation of Resources: Some tenants stay in rent-controlled apartments even if they no longer need the space, while others struggle to find housing.
Reduced Supply: Developers are discouraged from building new rental units, worsening the housing shortage.
These effects distort the natural balance of supply and demand in the housing market.
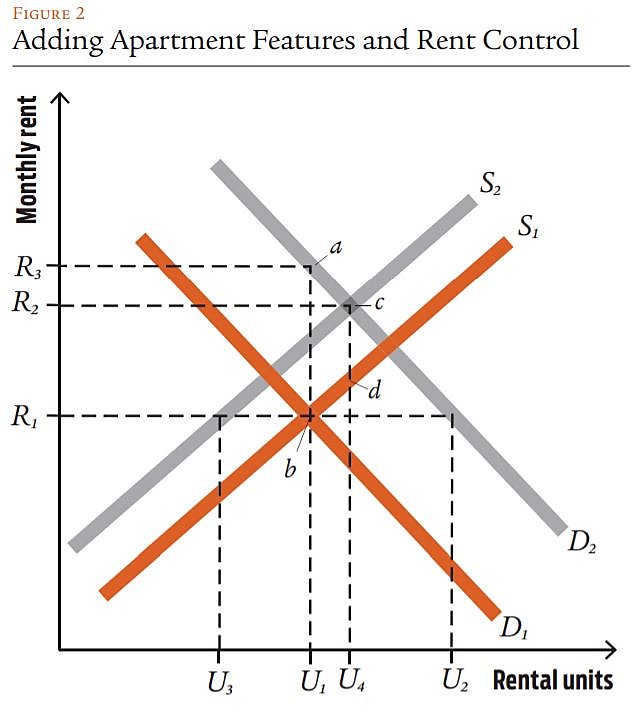
What problems do minimum wage laws cause? Does it make a difference whether the price control is binding or not?
Summary:
A binding minimum wage above the market equilibrium causes unemployment, higher business costs, and potential price increases.
A non-binding minimum wage has no effect, as the market wage is already above the imposed minimum.
What happens to the size of the shortage in the long-run vs the short-run when it comes to rent controls? Why?
Summary:
In the short run, the housing shortage caused by rent controls is limited, as supply and demand are relatively inelastic.
In the long run, the shortage grows larger because landlords reduce housing supply, developers stop building new units, and more renters seek affordable housing, leading to greater demand.