Final Exam
1/71
Earn XP
Description and Tags
raster-network analysis
Name | Mastery | Learn | Test | Matching | Spaced | Call with Kai |
|---|
No analytics yet
Send a link to your students to track their progress
72 Terms
what region covers the shortest wavelengths used in remote sensing
the visible region
what is the major source of energy for remote sensing data collected from a satellite
the sun
(T/F) aerial photos are the photos taken from a satellite
false
Less than 0.4 μm
not used in remote sensing
3.0 to 100 μm
near infrared
0.7 to 3.0 μm
far infrared
1 mm to 1m
microwave
(T/F) pixel values can have decimal numbers in a floating point raster
true
(T/F) 30 meter spatial resolution raster images have a higher spatial resolution than 10 meter spatial resolution raster images
false
a remote sensing data set is basically a collection of ______ radiations recorded by the sensors in satellites, aircraft, etc.
reflected
(T/F) an area on the surface imaged by a satellite’s sensor is called a swath
true
this region of the electromagnetic spectrum represents the heat emitted from the Earth’s surface
far infrared
a system’s ability to discriminate very slight differences in energy is called _____ resolution
radiometric
expand DEM
digital elevation model
(T/F) SRTM is a global model for elevation data
true
(T/F) LIDAR data is mass point cloud dataset that can be used to create DEMs
true
(T/F) GPS readings can be used as ground control points (GCPs) in geometric transformation of a raster image
true
(T/F) digital terrain models (DTM) include heights of buildings and trees
false
remote sensing satellite series that has been providing global data since the early 1970s
LANDSAT
temporal resolution of the LANDSAT image
16 days
spatial resolution
determines the smallest object or feature that can be detected in an image
spectral resolution
the ability of a sensor to capture different wavelength intervals
georectification of satellite imagery
aligning the satellite image to a map coordinate system for accurate spatial representation
30 degree slope in percent-slope form
58
georectification
how global errors in a DEM can be corrected
if you are selecting a site for a wildlife lookout station in a national park, which terrain analysis will you use to find the area that can be seen from the lookout station
viewshed
how can relative error in a DEM be corrected
filling the DEM
(T/F) the algorithm used in calculating slope in ArcGIS is Horn Algorithm
true
(T/F) the primary input data in a terrain analysis is a Digital Elevation Model (DEM)
true
(T/F) if TIN is derived from a DEM, that TIN cannot be as accurate as the full DEM
true
when defining a stream network, if you define a threshold value of 1,000, this means ____
each cell of the network has a minimum of 1,000 contributing cells
what should be the input file used in the toolbox to calculate flow direction
filled DEM
(T/F) in the Strahler method of stream ordering in a watershed model, the stream order increases only when streams of the same order interact
true
(T/F) in an IDW interpolation technique, estimated values are always between max and min values of known points
true
spatial interpolation method that assumes any point within a Voronoi polygon is closer to the polygon’s known point than any other known points
Thiessen Polygon
the first law of geography
everything is related to everything else but near things are more related than distanced things
global interpolation technique
all points in the data are used to estimate the values of locations for which data is unavailable
positive spatial autocorrelation
if nearby or neighboring areas are alike in spatial data
(T/F) Thiessen interpolation technique is an inexact interpolation technique
false
(T/F) A Moran’s I of 0.94 and a p value of 0.0000 indicate that there is NO significant spatial autocorrelation in the data
false
G statistics
indicates clustering of high values or low values in the data; Global Statistics
hotspot analysis
computes a Z score for every point in the data set
(T/F) LISA is a global pattern analysis
false
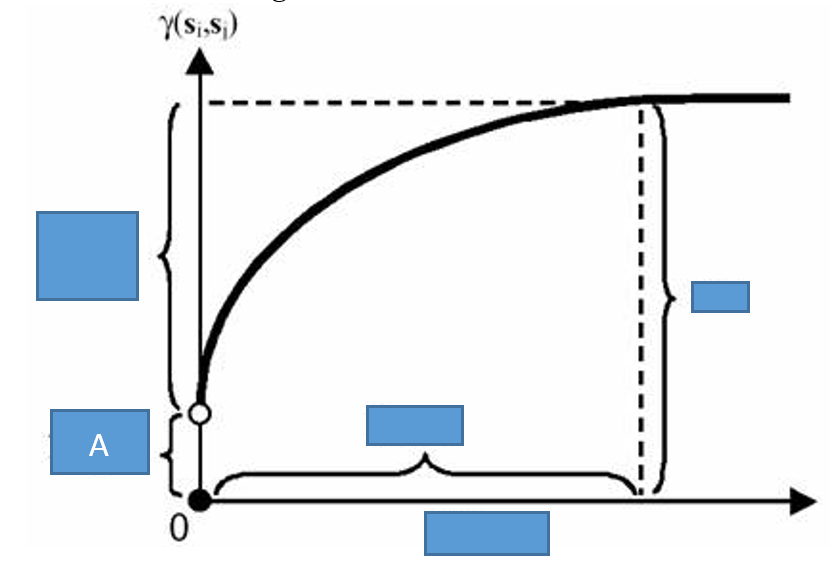
in the below semi variogram, “A” is
nugget
universal krigging
interpolation technique that assumes that there is a drift (spatial trend) in the spatial data
Krigging
method that was initially developed to estimate the spread of Dimond mines in South Africa
regression interpolation method
the relationship between the independent and dependent variable is modeled
(T/F) when logical expressions like “&” and “or” are used in a GIS model, the output raster cells will either be 0 or 1
true
four ways to run a tool in ArcGIS
python script, ArcToolBox, standalone python script, and model builder
import arcpy
the initial command to import the ArcPy module in python for use in ArcGIS Pro
what is the main purpose of using ModelBuilder in ArcGIS Pro
to create and automate workflows without coding by visually connecting tools and data
in a turn table of network database, a turn of -90 degrees indicates _____
a right turn
speed limits in a network analysis is a ______
link impedence
a turn angle of 0 degrees in a turn table indicates _____
go straight
expand GIS
Geographic Information System, Science, Studies
(T/F) in a pure network, the flow characteristics such as speed limits, one way, etc. are included
false
(T/F) a hotspot analysis is useful in finding the optimum routing for a UPS truck to deliver the parcel in a city
false
in a turn table, -1 in a minute column indicates
the turn is prohibited
(T/F) a network analysis is a vector analysis
true
(T/F) geometric networks such as utility network allows travel in only one direction at a time
true
what is a “node” in network analysis
a point representing an intersection
what is NOT typically used in network analysis
hotspot analysis
what is the primary input required to perform a network analysis in GIS
a street network
what is “impedance” in network analysis
a resistance factor such as travel time or cost along a network
in service analysis, what does a service area represent
the regions accessible within a specified distance or time from a location
what is a multimodal network in GIS
a network that integrates multiple modes of transportation
in a transportation network, what happens if an overpass and an underpass are not properly modeled
incorrect connectivity may result, allowing unrealistic routes through intersecting pathways
what happens if a network analysis ignores turn tables
it may generate unrealistic routes that violate traffic rules or turn restrictions
(T/F) a path analysis is a raster analysis
true
(T/F) *.gdb is a file extension of a file geodatabase
true
(T/F) *.shp is file format of the shapefile
true
(T/F) vector data includes points, lines, and polygons
true