Week 3: Validity and reliability
5.0(1)
Studied by 15 peopleCard Sorting
1/28
There's no tags or description
Looks like no tags are added yet.
Last updated 2:50 PM on 10/26/22
Name | Mastery | Learn | Test | Matching | Spaced | Call with Kai |
|---|
No analytics yet
Send a link to your students to track their progress
29 Terms
1
New cards
Reliability
Estimates evaluate the stability of measures, internal consistency of measurement instruments, and interrater reliability of instrument scores
2
New cards
Validity
the extent to which the interpretations of the results of a test are warranted, which depends on the particular use of the test is intended to serve.
3
New cards
Reliability estimates
used to evaluate:
1. the stability of measures administered at different times to the same individuals or using the same standard.
2. The equivalence of sets of items from the same test or of different observers scoring a behaviour or event using the same instrument.
1. the stability of measures administered at different times to the same individuals or using the same standard.
2. The equivalence of sets of items from the same test or of different observers scoring a behaviour or event using the same instrument.
4
New cards
Reliability coefficients
0.00 to 1.00
- higher levels indicate higher reliability
- higher levels indicate higher reliability
5
New cards
Stability
(test-retest reliability)
- administering a test at 2 different points in time to the same individuals and determining the correlation or strength of association.
- administering a test at 2 different points in time to the same individuals and determining the correlation or strength of association.
6
New cards
Internal Consistency
gives an estimate of the equivalence of sets of items from the same test.
- Cronbach's alpha is most widely used to measure internal consistency
- Cronbach's alpha is most widely used to measure internal consistency
7
New cards
Interrater Reliability
Establishes the equivalence of ratings obtained with an instrument when used by different observers.
- Cohens Kappa is used
- Cohens Kappa is used
8
New cards
Exposure Measurement (4 doses)
Available dose:
- cumulative vs current
Administrated dose:
- the amount that comes in contact
Absorbed dose:
- the amount that enters the body
Active dose:
- that actually affects the target organ
- cumulative vs current
Administrated dose:
- the amount that comes in contact
Absorbed dose:
- the amount that enters the body
Active dose:
- that actually affects the target organ
9
New cards
Ratio
* relationship between 2 numbers
* numerator: **NOT NECESSARILY INCLUDED** in denominator
eg. (binary) sex ratio
* numerator: **NOT NECESSARILY INCLUDED** in denominator
eg. (binary) sex ratio
10
New cards
Proportion
* relationship between 2 numbers
* numerator: **HAS TO BE INCLUDED** in the denominator
* proportion always ranges between 0-1
* numerator: **HAS TO BE INCLUDED** in the denominator
* proportion always ranges between 0-1
11
New cards
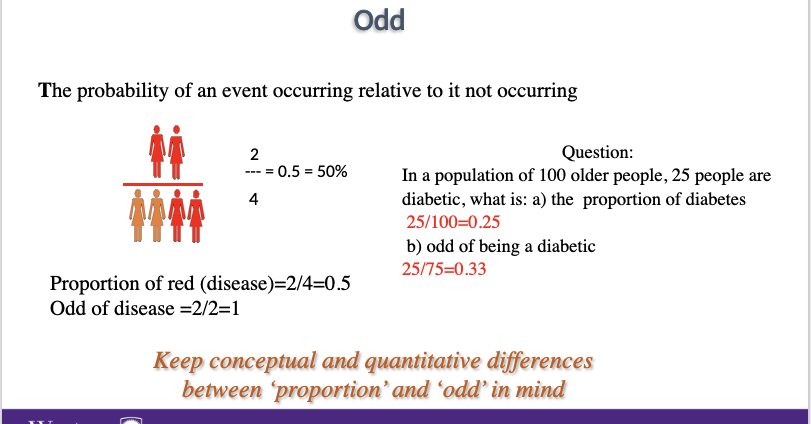
Calculating the odds
In a population of 100, 25 are diabetic. What are the odds of being diabetic?
- probability of an event occurring relative to not occurring
- 25/75 = 0.33
- probability of an event occurring relative to not occurring
- 25/75 = 0.33
12
New cards
Calculating the rate
speed of occurrence of an event over time
numerator: # of events observed for a given time
denominator: population in which the events occur 2 in 100 people?2/100 = 0.02
numerator: # of events observed for a given time
denominator: population in which the events occur 2 in 100 people?2/100 = 0.02
13
New cards
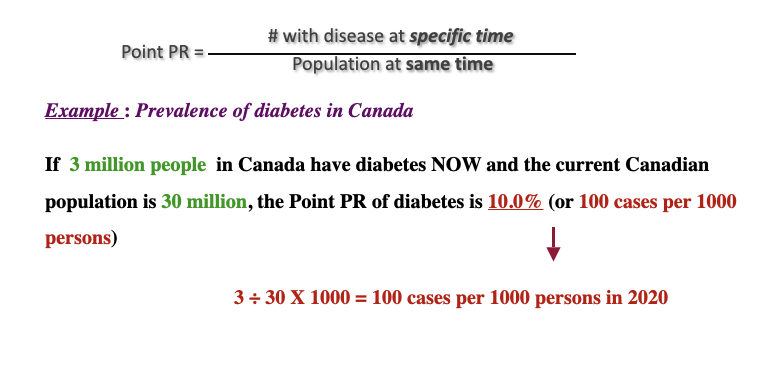
Measuring Prevalence
prevalence rate:
the proportion of the population that has a given disease or other attribute at a specified time
2 types:
1. point prevalence rate
2. Period prevalence rate
the proportion of the population that has a given disease or other attribute at a specified time
2 types:
1. point prevalence rate
2. Period prevalence rate
14
New cards
Point Prevalence rate
PR:
# with disease at specific time/ population at same time
# with disease at specific time/ population at same time
15
New cards
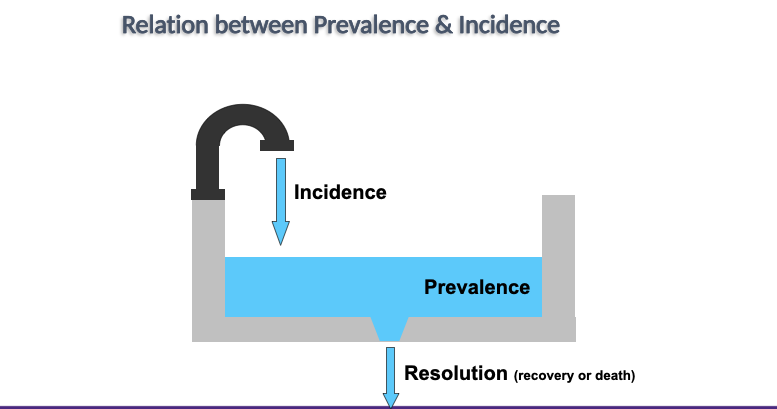
Incidence rate
* the proportion of the population at risk that develops a given disease or other attribute during a specific time period.
\
* IR:# new events during specified time period/ population at risk
\
* IR:# new events during specified time period/ population at risk
16
New cards
Incidence vs prevalence
__**Incidence:**__
* measures frequency of disease onset
* @@what is new@@
\
__**Prevalence**__
* measures population disease status
* %%what exists%%
\
all may be expressed in any power of 10
* per 100, 1,000, 10,000
* measures frequency of disease onset
* @@what is new@@
\
__**Prevalence**__
* measures population disease status
* %%what exists%%
\
all may be expressed in any power of 10
* per 100, 1,000, 10,000
17
New cards
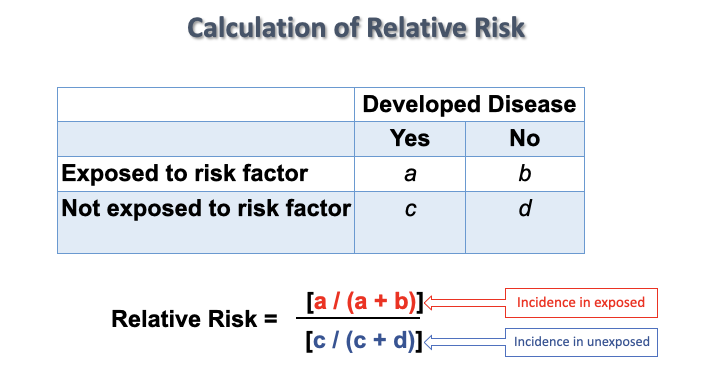
Relative risk
tells us how many times as likely it is that someone who is ‘exposed’ to something will experience a particular health outcome compared to someone who is not exposed
* Tells us about the __strength of an association__
* Can be calculated using any measure of disease occurrence:
**Prevalence
Incidence rate**
\
\
* Tells us about the __strength of an association__
* Can be calculated using any measure of disease occurrence:
**Prevalence
Incidence rate**
\
\
18
New cards
Calculation of relative risk
19
New cards
Random error
error due to chance
20
New cards
systematic error
error due to unrecognizable source
*can have both random and systematic error
*can have both random and systematic error
21
New cards
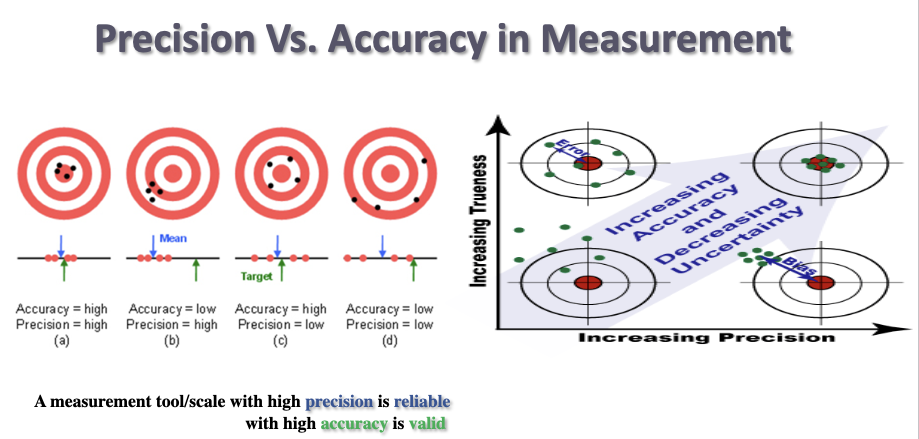
precision vs accuracy
A measurement scale/ tool with a high precision is reliable with high accuracy is valid
22
New cards
High precision is _____
HIgh accuracy is _____
HIgh accuracy is _____
reliable
valid
valid
23
New cards
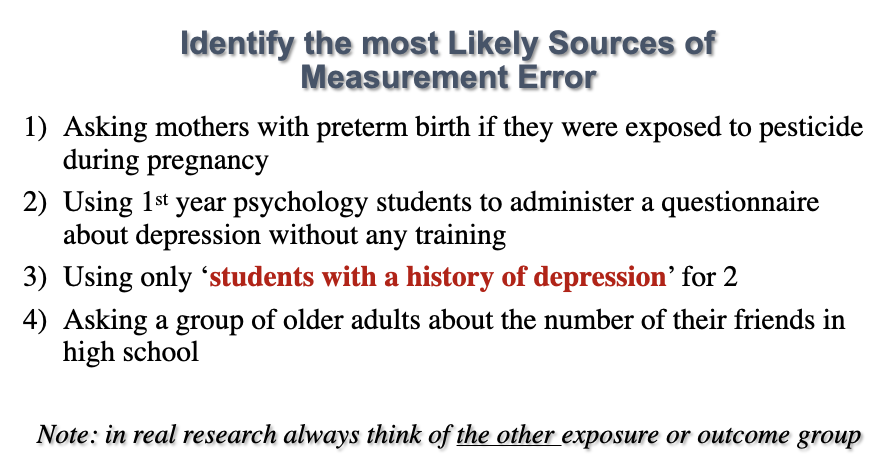
Insufficient Precision
could be:
- The measurement tool is not precise enough (a ruler in cm is not precise when meaningful differences are in millimeter)
- Two (independent) interviewers rate the same person differently using the same scale (inadequate training?)
- The same interviewer rates the same person differently
- The measurement tool is not precise enough (a ruler in cm is not precise when meaningful differences are in millimeter)
- Two (independent) interviewers rate the same person differently using the same scale (inadequate training?)
- The same interviewer rates the same person differently
24
New cards
sources of measurement error
interviewer or observer
- record abstracting (random error)
- biased overestimation or underestimation
Participants
- recall
- random or systematic
- record abstracting (random error)
- biased overestimation or underestimation
Participants
- recall
- random or systematic
25
New cards
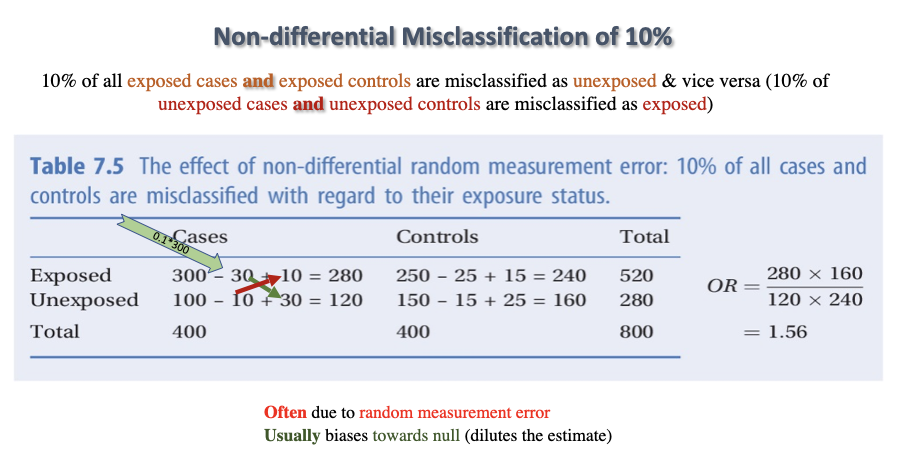
Classification of participants
2 types:
1. Non-differential (the same in all study groups)
- Usually weakens associations – i.e. brings effect estimates (RR, OR, AR) closer to the null value (but not always)
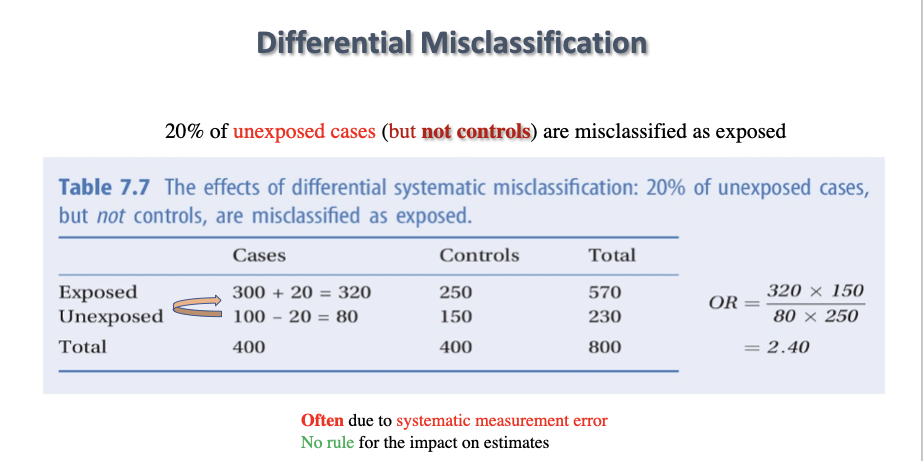
2. Differential (different in different study groups)
- Effect estimates may change in any direction, depending on the particular error
1. Non-differential (the same in all study groups)
- Usually weakens associations – i.e. brings effect estimates (RR, OR, AR) closer to the null value (but not always)
2. Differential (different in different study groups)
- Effect estimates may change in any direction, depending on the particular error
26
New cards
Non-differential Misclassification of 10%
10% of all exposed cases and exposed controls are misclassified as unexposed & vice versa (10% of unexposed cases and unexposed controls are misclassified as exposed)
\
^^brings OR,RR, AR closer to the null^^
\
^^brings OR,RR, AR closer to the null^^
27
New cards
Differential Misclassification
20% of unexposed cases (but not controls) are misclassified as exposed
28
New cards
Reducing measurement error
- Little (or nothing) can be done to fix information bias once it has occurred.
- Information bias must be avoided through careful study design and conduct
Information bias cannot be “controlled” in the analysis.
- Information bias must be avoided through careful study design and conduct
Information bias cannot be “controlled” in the analysis.
29
New cards
Case control vs cohort
Case control: case vs control
Cohort: exposed vs unexposed
Cohort: exposed vs unexposed