Unit 0: Research Methods and Data Interpretation
1/82
Earn XP
Description and Tags
Name | Mastery | Learn | Test | Matching | Spaced | Call with Kai |
|---|
No analytics yet
Send a link to your students to track their progress
83 Terms
Independent Variable
in an experiment, the factor that is manipulated
Dependent Variable
in an experiment, the outcome that is measured; the variable that may change when the independent variable is manipulated.
Likert Scale
a psychometric rating scale commonly used in surveys to measure opinions, attitudes, or behaviors, typically using a 5- or 7-point scale where respondents indicate their level of agreement or disagreement with a statement
Meta-Analysis
a statistical method that combines data from multiple studies to draw a single conclusion
Correlational Study
a research method that examines the relationship between two or more variables without manipulating them, aiming to determine if and how strongly they are related, but not implying causation
Experiment
a research method in which an investigator manipulates one or more factors (independent variables) to observe the effect on some behavior or mental process (the dependent variable). By random assignment of participants, the experimenter aims to control other relevant factors.
Survey
a non-experimental technique for obtaining the self-reported attitudes or behaviors of a particular group, usually by questioning a representative, random sample of the group.
Natural Observation
a non-experimental technique of observing and recording behavior in naturally occurring situations without trying to manipulate and control the situation.

Case Study
a non-experimental technique in which one individual or group is studied in depth in the hope of revealing universal principles.
Control Group
in an experiment, the group not exposed to the treatment; contrasts with the experimental group and serves as a comparison for evaluating the effect of the treatment.
Experimental Group
in an experiment, the group exposed to the treatment, that is, to one version of the independent variable.
Operational Definition
a carefully worded statement of the exact procedures (operations) used in a research study.
Random Assignment
assigning participants to experimental and control groups by chance, thus minimizing preexisting differences between the different groups.
Confounding Variables
in an experiment, a factor other than the factor being studied that might influence a study’s results.
Correlation Coefficient
A numerical value between 0 and 1 that quantifies the strength and direction of a relationship between two variables. (from −1.00 to +1.00).
A value close to 0 indicates a weak or no correlation regardless of - or +.
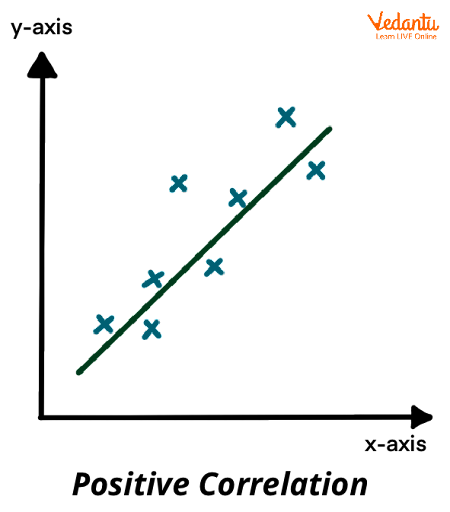
Positive Correlation
refers to a relationship between two variables where they both increase or decrease together. It is represented by a correlation coefficient ranging from 0 to +1, indicating a strong positive relationship between the variables.
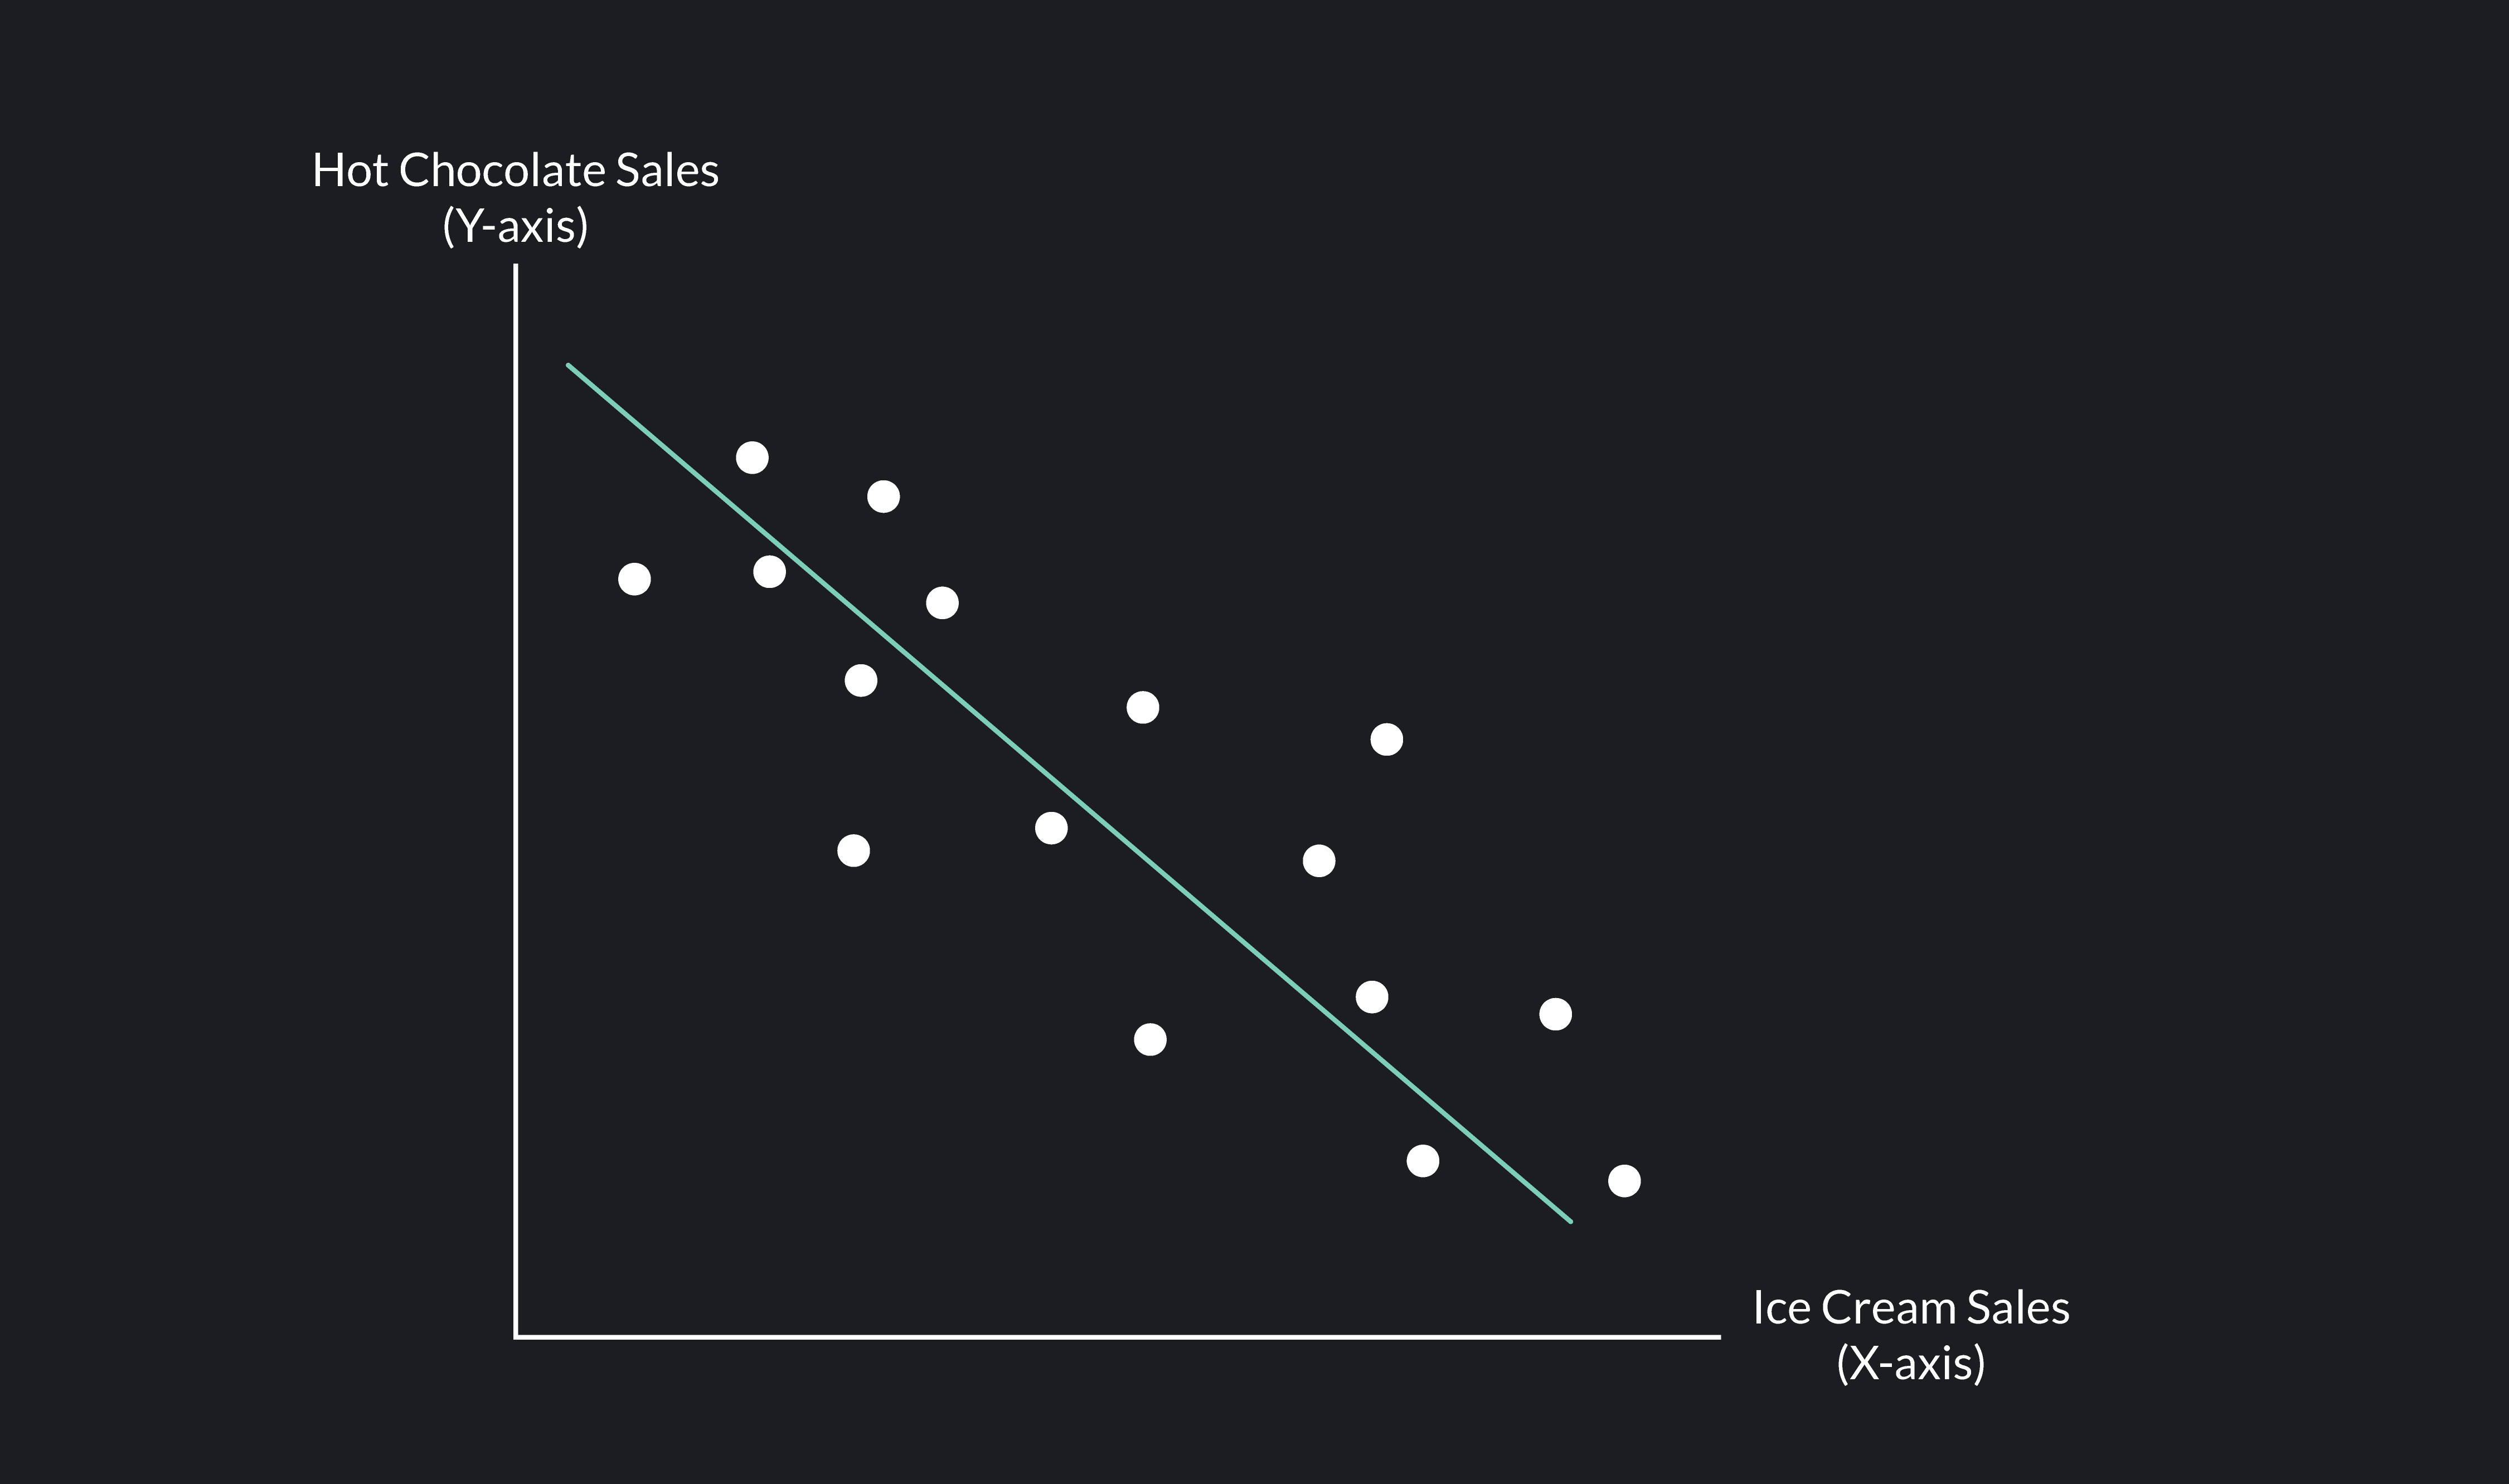
Negative Correlation
describes a relationship between two variables where one increases as the other decreases. A value close to -1.00 indicates a strong _____________ (as one variable increases, the other tends to decrease).
Random Sample
a sample that fairly represents a population because each member has an equal chance of inclusion.
Cross-Sectional Studies
observational studies that analyze data from a population at a single point in time. They are often used to measure the prevalence of health outcomes, understand determinants of health, and describe features of a population.
Longitudinal Studies
research designs that involve repeated observations of the same variables over long periods, allowing researchers to track changes and developments within individuals or groups over time.
Mean
is a measure of central tendency, representing the "average" value of a set of numbers.
Mode
the value that appears most frequently in a dataset.
Range
the difference between the highest values and lowest values in a given set of numbers.
Median
the middle value in a sorted dataset, meaning that half the values are above and half are below it.
Hindsight Bias
the tendency to believe, after learning an outcome, that one would have foreseen it. (Also known as the I-knew-it-all-along phenomenon.)
Self-serving Bias
the tendency to attribute positive outcomes to internal factors (like one's abilities or efforts) and negative outcomes to external factors (like bad luck or other people's actions)
Social Desirability Bias
bias from people’s responding in ways they presume a researcher expects or wishes.
Self-report Bias
the tendency of individuals to provide inaccurate or distorted information about themselves, their behaviors, or experiences when asked to self-report.
Sampling Bias
a flawed sampling process that produces an unrepresentative sample.
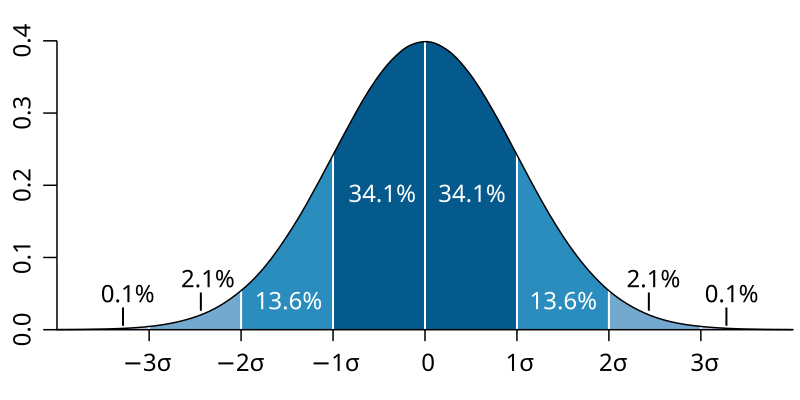
Standard Deviation
a computed measure of how much scores vary around the mean score.
A high standard deviation indicates that data points are widely spread out from the mean, meaning there's greater variability.
A low standard deviation suggests data points are clustered closely around the mean, indicating less variability
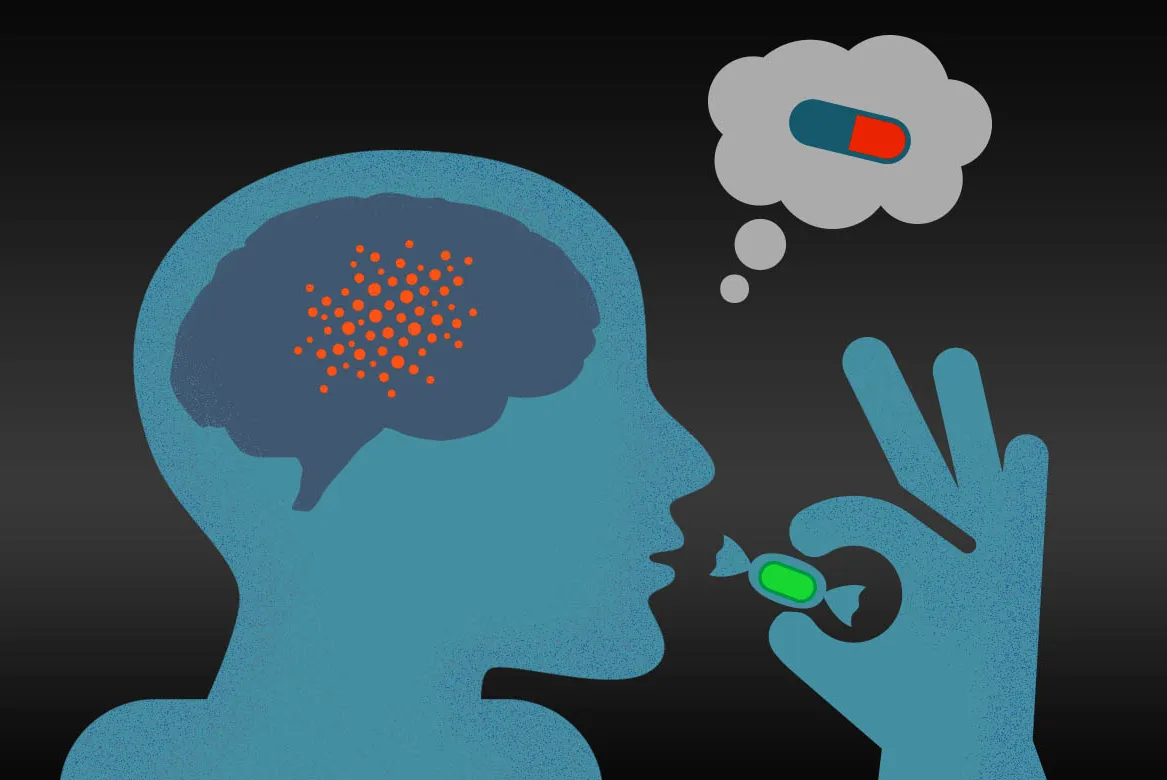
Placebo Effect
experimental results caused by expectations alone; any effect on behavior caused by the administration of an inert substance or condition, which the recipient assumes is an active agent.
Single-Blind Procedure
an experimental procedure in which the research participants are ignorant (blind) about whether they have received the treatment or a placebo.
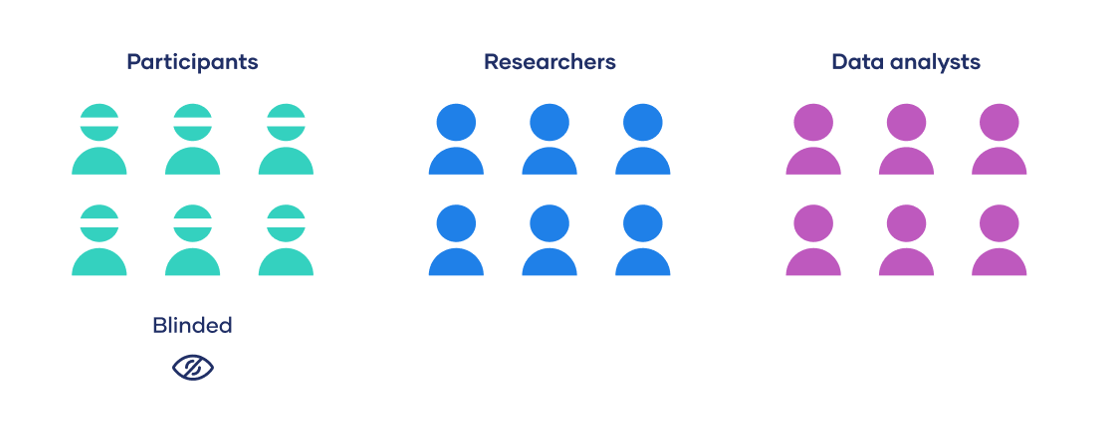
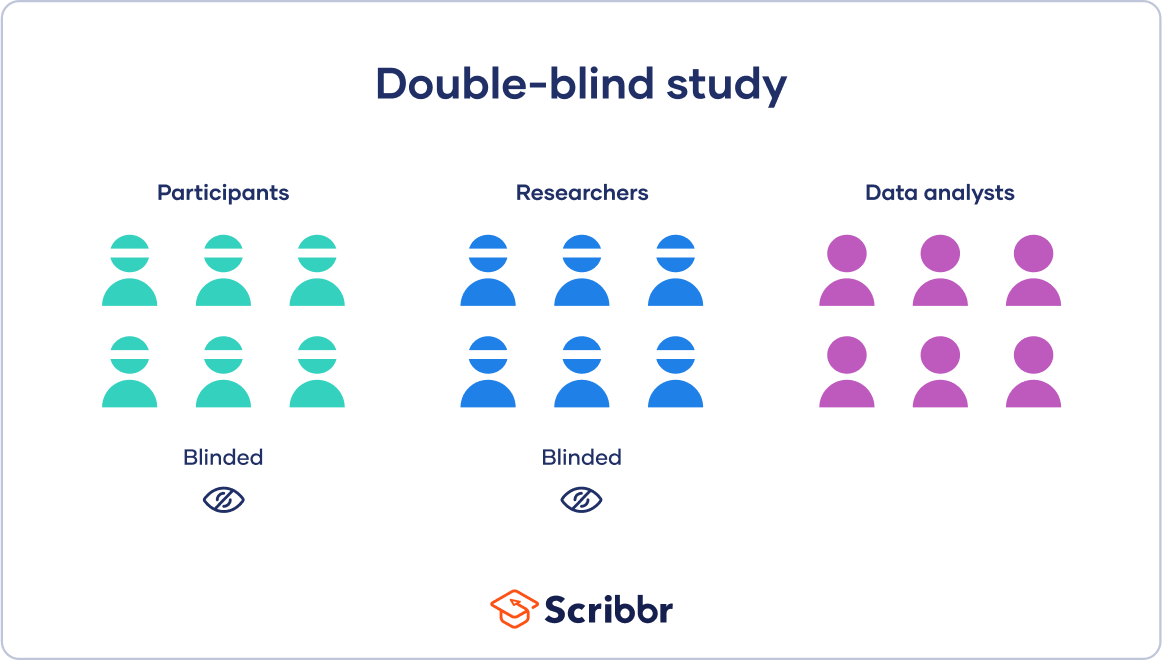
Double-Blind Procedure
an experimental procedure in which both the research participants and the research staff are ignorant (blind) about whether the research participants have received the treatment or a placebo.
Qualitative Research
a research method that relies on in-depth, narrative data that are not translated into numbers.
Quantitative Research
a research method that relies on quantifiable, numerical data.
Informed Consent
giving potential participants enough information about a study to enable them to choose whether they wish to participate
Debriefing
the post experimental explanation of a study, including its purpose and any deceptions, to its participants.
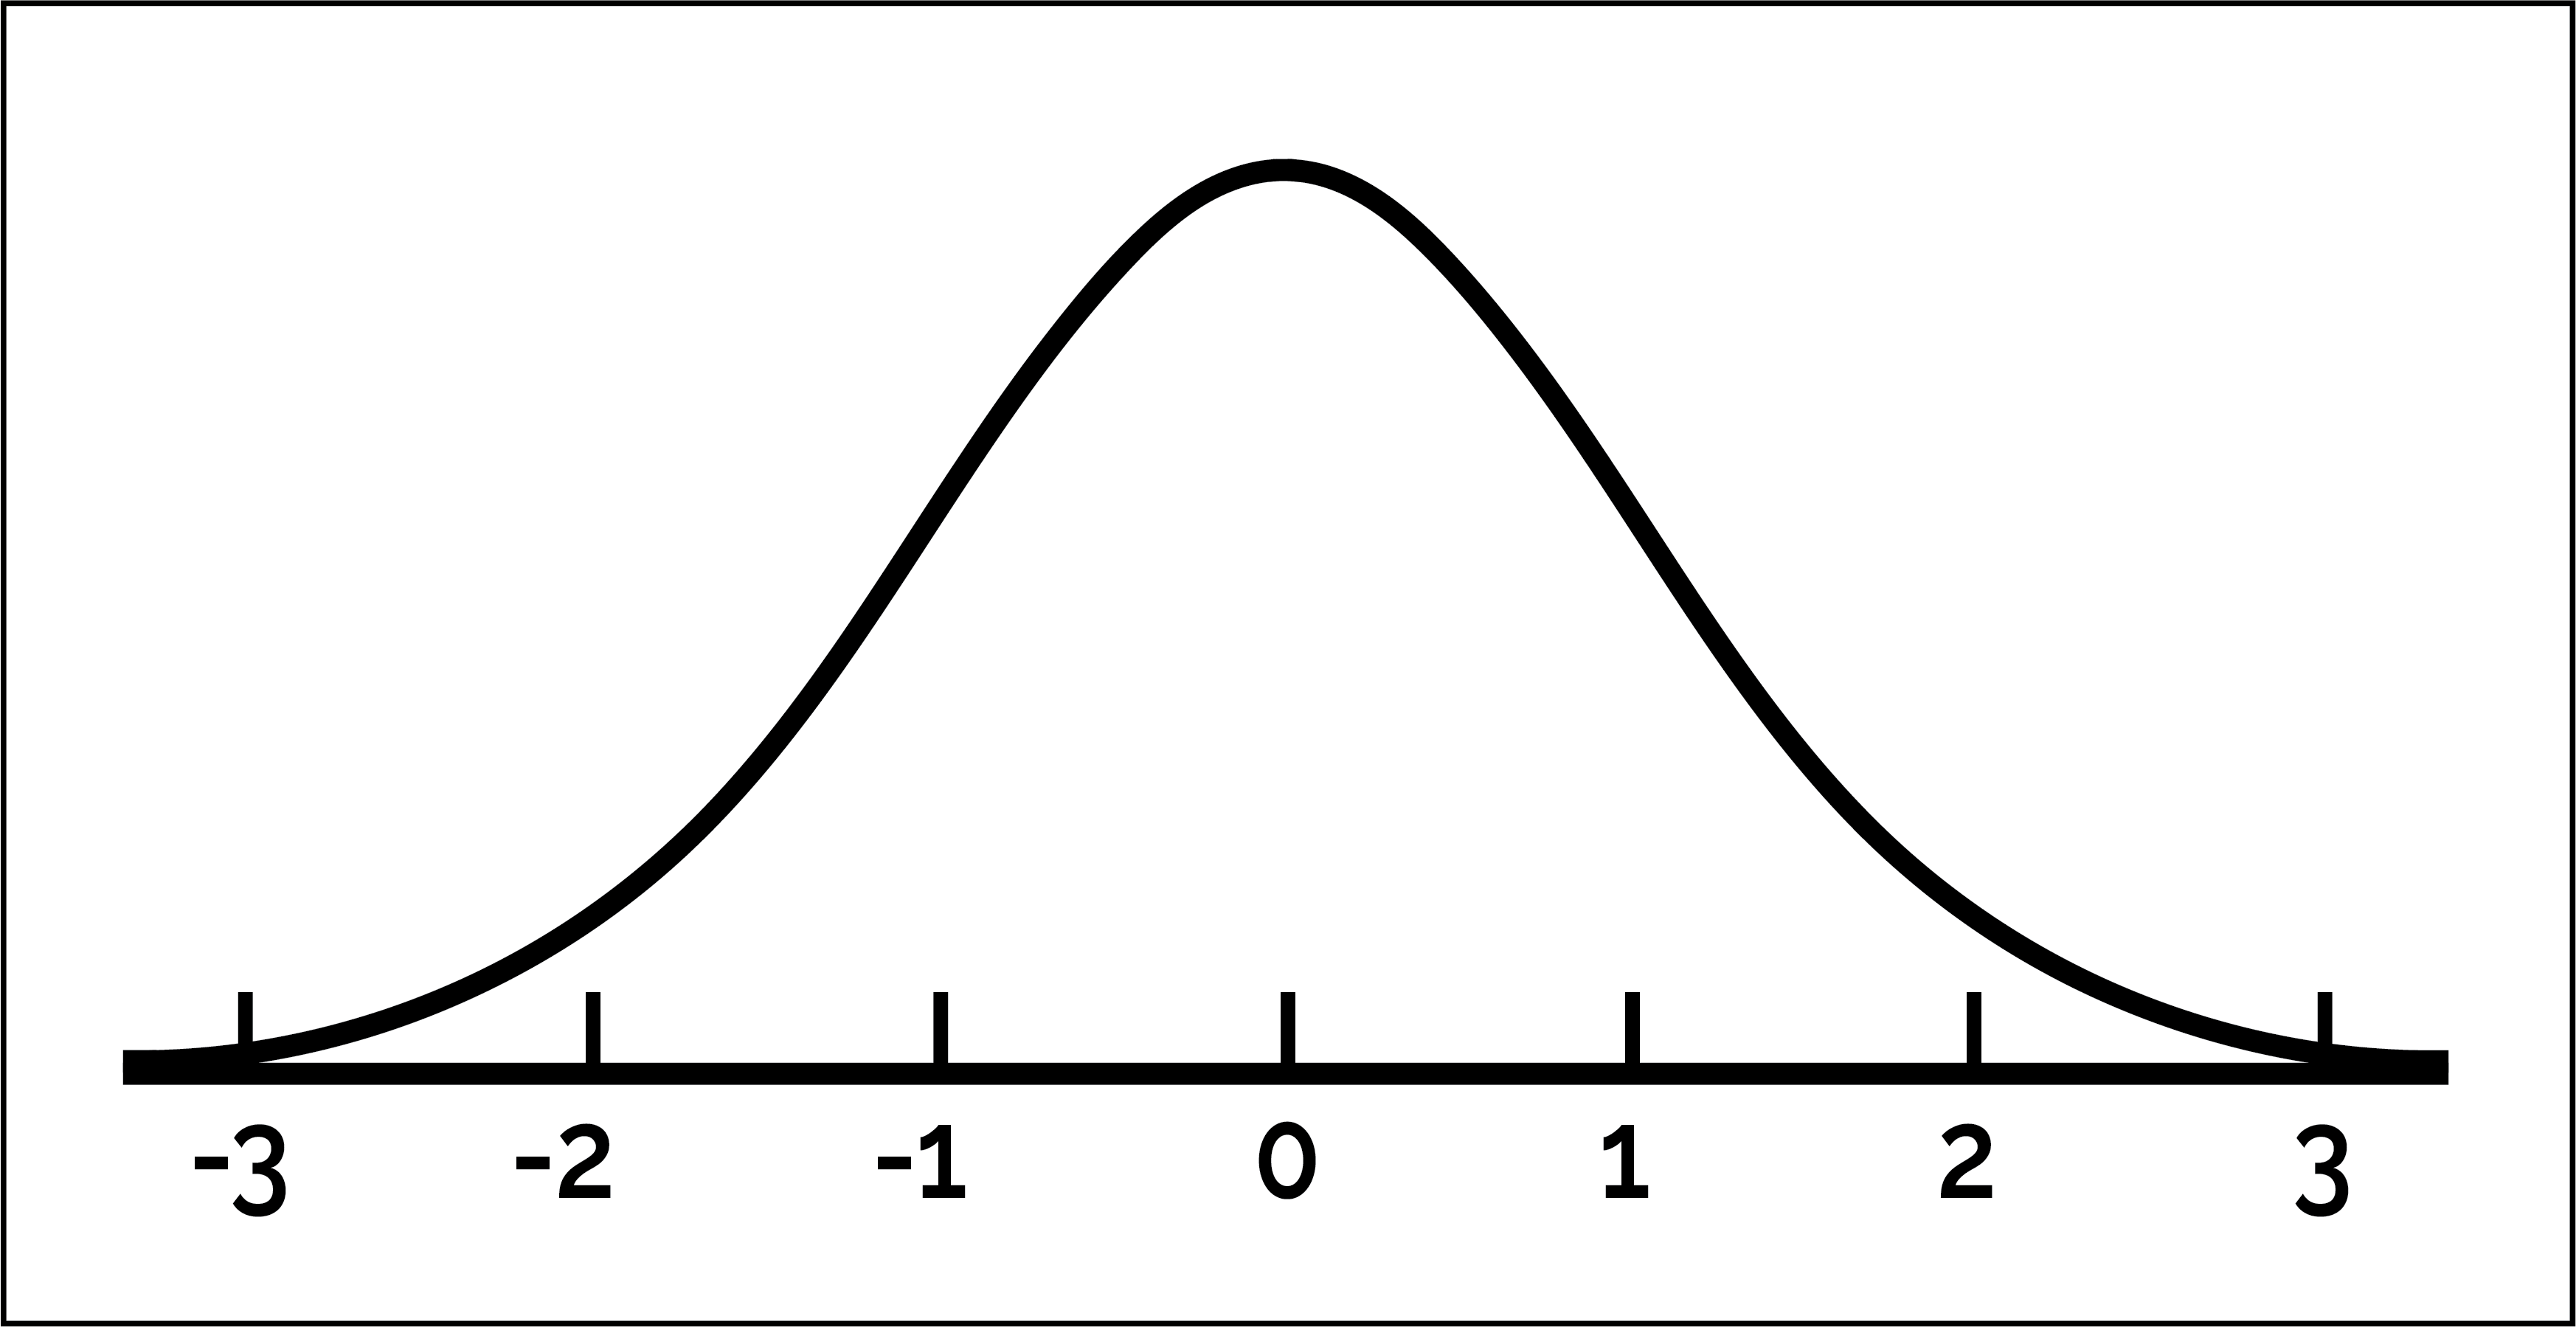
Normal Curve
a symmetrical, bell-shaped curve that describes the distribution of many types of data; most scores fall near the mean (about 68 percent fall within one standard deviation of it) and fewer and fewer scores lie near the extremes. In a ________ distribution, the mean, median, and mode are all equal.
Experimenter Bias
bias caused when researchers may unintentionally influence results to confirm their own beliefs.
Structured Interview
a standardized interview process where all candidates are asked the same questions in the same order, allowing for objective comparison and evaluation based on pre-defined criteria
Effect Size
measures how strong the impact of one variable is on another in an experiment. A small __________ means a minor impact, while a large ________ shows a strong, meaningful difference or relationship.
Pie Charts
a type of graph in which a circle is divided into sectors that each represent a proportion of the whole.

Regression towards the mean
the tendency for extreme or unusual scores or events to fall back (regress) toward the average.
Descriptive Statisitcs
numerical data used to measure and describe characteristics of groups; include measures of central tendency and measures of variation.
Inferential Statistics
numerical data that allow one to generalize — to infer from sample data the probability of something being true of a population.
Stratified Sampling
researchers divide subjects into subgroups called strata based on characteristics that they share (e.g., race, gender, educational attainment).
Representative Sampling
a subset of a population that accurately reflects the characteristics of the larger group, allowing researchers to make inferences about the population based on the sample
Convince Sampling
a non-probability sampling method where units are selected for inclusion in the sample because they are the easiest for the researcher to access
Generalizability
the extent to which the findings of a study can be applied to a broader population or context beyond the specific sample or situation studied.
Confirmation Bias
is the tendency to search for, interpret, favor and recall information in a way that confirms or supports one's prior beliefs or values.
Overconfidence Bias
a cognitive bias where people tend to overestimate their abilities, knowledge, and skill in a particular area
Reliability
the repeatability or consistency of the test as a means of measurement
Validity
the extent to which a test or experiment measures or predicts what it is supposed to
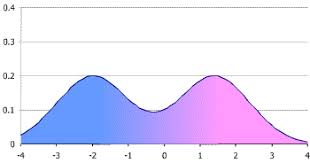
Bimodal Distribution
is a frequency distribution where the data clusters around two distinct peaks or modes, rather than a single peak as in a unimodal distribution.
Statistically Significant
the degree to which a research outcome cannot reasonably be attributed to the operation of chance or random factors
Availability Heuristic
Mental shortcut that relies on immediate examples the come to mind. Can lead to overestimating the like hood of events based on recent exposures or vividness.
Anchoring Bias
The tendency to rely heavily on the first piece of information encountered (the "anchor") when making decisions.
Fundamental attribution error
The tendency to overemphasize personal characteristics and underestimate situational factors when explaining others' behaviors. Can lead to misjudgments about people's motivations and actions.
Negativity bias
The tendency to give more weight to negative experiences or information than positive ones. Can affect emotional responses and decision-making processes. Often leads to a pessimistic outlook and increased anxiety.
Bandwagon Effect
The phenomenon where individuals adopt beliefs or behaviors because others are doing so. Can lead to conformity and groupthink. Often results in a lack of critical thinking and independent decision-making.
Dunning-Kruger effect
The cognitive bias where individuals with low ability in a particular area overestimate their competence
Framing Effect
The way information is presented can significantly affect decision-making and judgment.
Sunk cost fallacy
The tendency to continue an endeavor once an investment in money, effort, or time has been made, regardless of future outcomes.
Cognitive dissonance
The mental discomfort experienced when holding two or more contradictory beliefs or values. Can lead to changes in beliefs or behaviors to reduce discomfort. Often results in rationalization or justification of actions.
Halo Effect
The tendency to let an overall impression of a person influence specific judgments about their traits or abilities.
Representativeness heuristic
A mental shortcut that involves judging the probability of an event based on how similar it is to a prototype. Can lead to misjudgments and stereotyping. Often results in neglecting relevant statistical information.
prototype
the hypothetical “most typical” instance of a category.
Non-Maleficence
“Do no harm (physical, emotional, or psychological)”
Integrity
“Be fair, honest, and truthful in all professional activities. Provide accurate information about qualifications and treatment methods.”
Fidelity
“Be trustworthy and honor professional commitments. Keep information confidential.”
Cognitive dissonance
The mental discomfort or tension that arises when a person’s attitude and actions are in conflict. This conflict creates a sense of unease that are people motivated to resolve. So, basically to reduce this, people will often try to align their attitudes and their actions, so they might change their attitude to match their behavior or change the behavior to match their attitude or simply justify their behavior to make it feel more acceptable.
Just-world Bias
the belief that the world is fair and people get what they deserve.
Behavioral Perspective
Focuses on observable behaviors and the ways they are learned through interaction with the environment.
Emphasizes the principles of conditioning (classical and operant) in shaping behavior.
Rejects introspection and emphasizes the importance of empirical evidence in studying behavior.
Applies behavioral techniques in therapy, such as reinforcement and punishment, to modify maladaptive behaviors.
Cognitive Perspective
Studies mental processes such as perception, memory, thinking, and problem-solving.
Explores how people understand, diagnose, and solve problems, emphasizing the role of internal mental states.
Investigates cognitive biases and how they affect decision-making and behavior.
Incorporates models of information processing to explain how we encode, store, and retrieve information.
Biological Perspective
Focuses on the physiological and genetic influences on behavior and mental processes.
Examines the role of the brain, neurotransmitters, hormones, and the nervous system.
Utilizes techniques such as brain imaging and genetic testing to understand psychological phenomena.
Emphasizes the impact of heredity and evolution on behavior and mental health.
Evolutionary Perspective
Explores how evolutionary principles, such as natural selection, influence behavior and mental processes.
Examines the adaptive functions of behavior and how they may have evolved to enhance survival and reproduction.
Investigates the biological basis of social behaviors, mating strategies, and parenting.
Integrates findings from various disciplines, including biology, anthropology, and psychology, to understand human behavior in an evolutionary context.
Sociocultural Perspective
Examines how social and cultural factors influence behavior and mental processes.
Investigates the impact of societal norms, values, and expectations on individual behavior.
Considers the role of group dynamics, socialization, and cultural diversity in shaping psychological experiences.
Highlights the importance of context in understanding behavior, including factors like ethnicity, gender, and socioeconomic status.
Psychodynamic Perspective
Originates from the work of Sigmund Freud, emphasizing the influence of the unconscious mind on behavior.
Explores the role of early childhood experiences and interpersonal relationships in shaping personality.
Investigates defense mechanisms and their role in coping with anxiety and conflict.
Highlights the importance of dreams and free association in understanding unconscious processes.
Humanistic Perspective
Emphasizes individual potential and the importance of self-actualization and personal growth.
Focuses on subjective experiences and the inherent goodness of people.
Advocates for a holistic approach to understanding human behavior, considering emotions and personal values.
Promotes therapeutic techniques that foster self-exploration and self-acceptance, such as client-centered therapy.
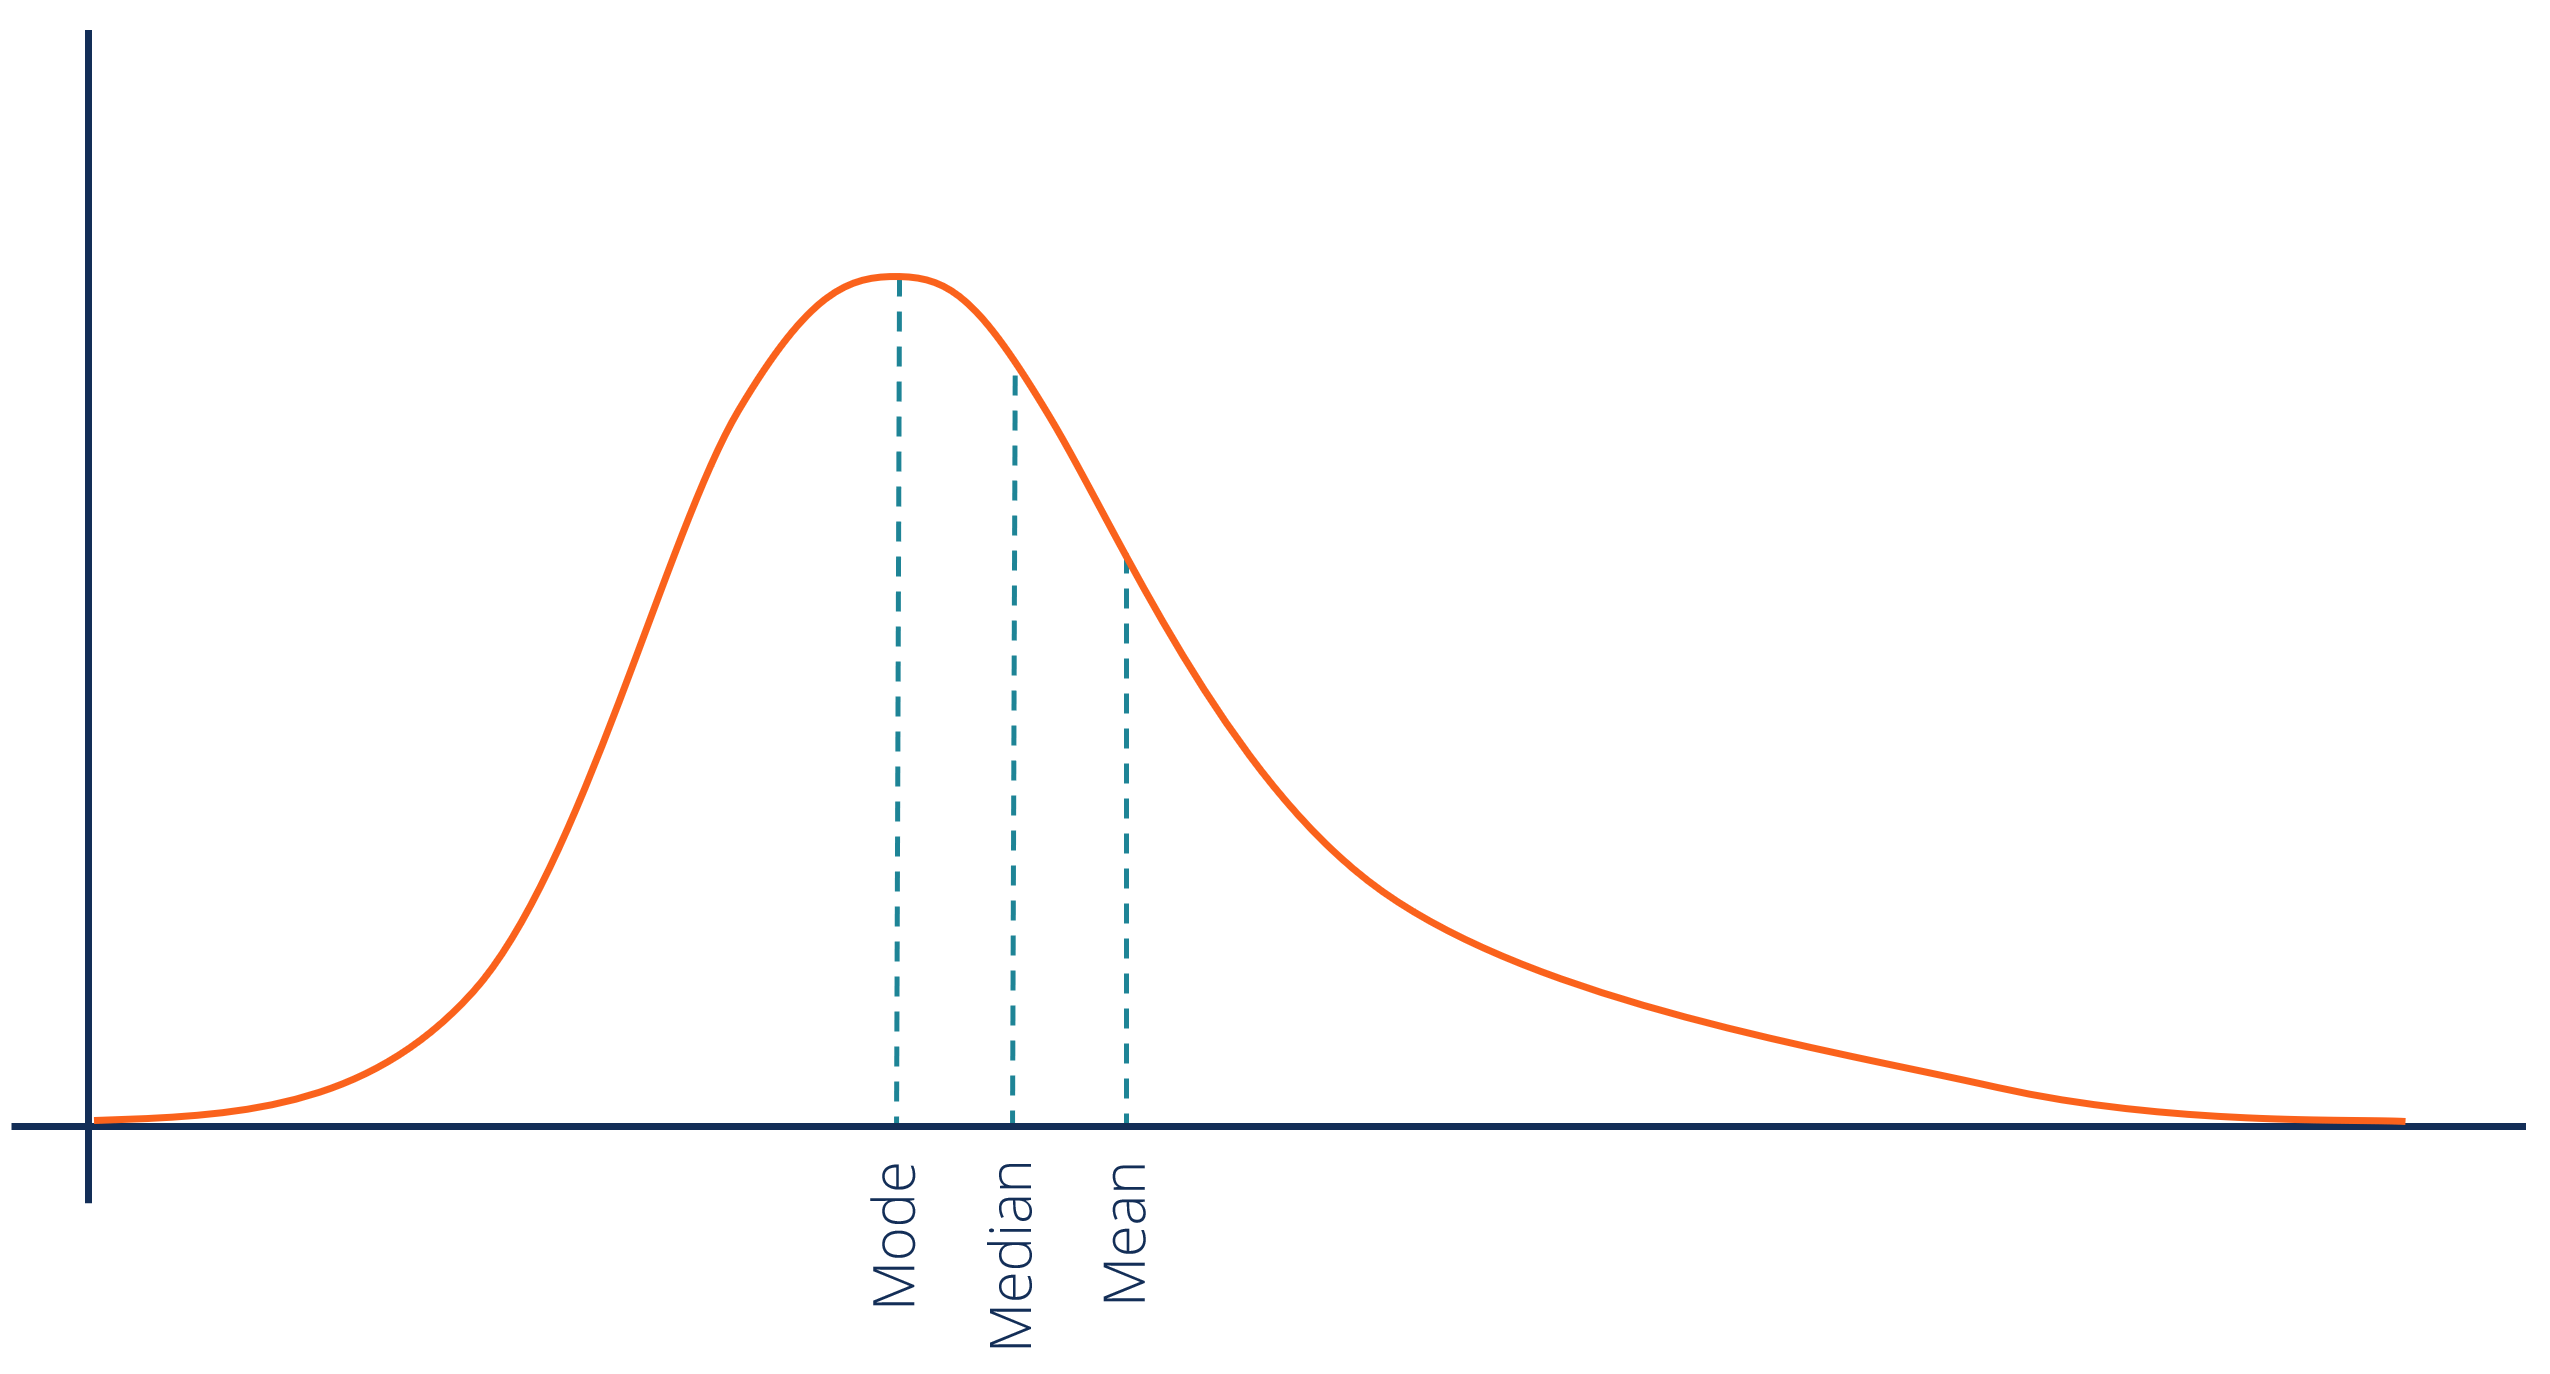
Positively Skewed Curve
A distribution where the tail is longer on the right side, indicating that the mean is greater than the median, often due to high outliers.
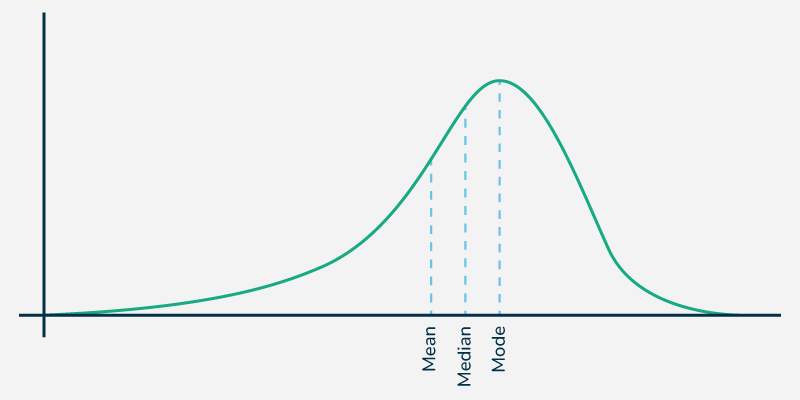
Negatively Skewed Curve
A distribution with a longer tail on the left side, showing that the mean is less than the median, typically resulting from low outliers.
Percentile Rank
Indicates the percentage of scores in a dataset that a particular score is equal to or greater than.
Biopsychosocial persepcitve
Which focuses on the interconnectedness of biological, psychological, and social factors in understanding behavior and mental process.