Physics AT1 flashcards
 View linked note
 Call Kai
 Learn
Learn Practice Test
 Spaced Repetition
 Match
Match Flashcards
 Knowt Play
1/44

Earn XP
Description and Tags
Name | Mastery | Learn | Test | Matching | Spaced | Call with Kai | Chat |
|---|
No analytics yet
Send a link to your students to track their progress
45 Terms
Units for measurement
Agreed quantities used in measurements, with base units in the International System of units (SI units) like second, metre, kilogram, ampere, kelvin, mole, and candela.
Derived units
Units that are based on base units, like acceleration (a = ∆v/t), force (F = ma), area (A = lw), volume (V = lwh), and work (W = Fd).
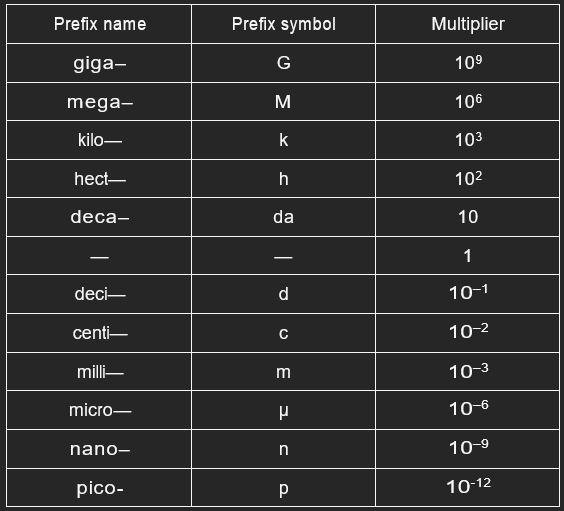
SI prefixes
Significant figures
A number that is correct within some stated degree of accuracy.
Scientific notation & orders of magnitude
Notation that represents large or small numbers as powers of ten, with orders of magnitude indicating the nearest power of ten for a number.
Linear regression
A technique used to analyse data by fitting them to a straight line.
Line of Best Fit
A method used to estimate the trend of data points by drawing a line that represents the general direction of the data.
Gradient
The slope of the line of best fit, representing the rate of change of the dependent variable concerning the independent variable.
Systematic Error
An error that consistently affects measurements in the same direction, which is usually caused by improperly calibrated reading instruments.
Random Error
An error that randomly affects measurements in random directions, and is usually caused by uncontrolled variables or random fluctuations in working conditions.
Linear Regression
A method to establish or verify relationships by fitting a straight line to data points.
Uncertainty
The margin of error or doubt associated with a measurement, often expressed as ±Δx to indicate the range within which the true value is expected to lie - MUST BE ONE SIGNIFICANT FIGURE.
Uncertainty for analogue devices
± ½ the limit of reading.
Uncertainty for digital devices
± the smallest increment.
Uncertainty in a set of data
± maximum difference from mean.
Reliability
An extent which repeated observations and/or measurements taken under identical circumstances will yield similar results.
Validity
An extent to which tests measure what was intended; an extent to which data, inferences and actions produced from tests and other processes are accurate.
Procedure vs method
Procedure - present tense
Method - past tense
Practical investigations
An investigation that involves systematic scientific inquiry by planning a course of action and using equipment to collect data and/or information. They include a range of hands-on activities and can include laboratory investigations and fieldwork.
Primary sources/primary data
Information created by a person or persons directly involved in a study or observing an event.
Variable
A factor that can be changed, maintained or measured - examples include quantities such as time, distance, light and temperature.
Independent variable
A variable that is changed in an investigation to see what effect it has on the dependant variable - plotted on horizontal axis.
Dependant variable
A variable that changes in response to to changes in the independent variable in an investigation - plotted on vertical axis.
Controlled variable
A variable that is kept constant (or changed in constant ways) during an investigation.
Validity judgement format
“As we only changed the <independent variable> and measured the <dependant variable> whilst controlling all other variables such as <variable1, variable 2, etc>, we ensured that we tested our aim of <aim>. This meant our experiment had high validity.”
Hypothesis
A tentative explanation for an observed phenomenon, expressed as a precise and unambiguous statement that can be supported or refuted by investigation.
Hypothesis format
“If the <independent variable> is <increased/decreased>, then the <dependant variable> will <increase/decrease>”
Aim format
“To determine the effect of <increasing/decreasing> the <independent variable> on the <dependent variable> for <whatever we are using to investigate this relationship>”
Title format
“The Effect of the <independent variable> on the <dependant variable> for <what we were using>”
Conclusion
A judgement based on evidence - Should be a brief statement that summarises your experimental findings that refer back to he aim and hypothesis, max 2 sentences.
Addition and subtraction of measured data
When adding or subtracting measured quantities, the final answer should have the least number of DECIMAL PLACES in the original data you used.
Multiplication and division of measured data
When multiplying or dividing measured quantities, the final answer should have the least number of SIGNIFICANT FIGURES in the original data you used.
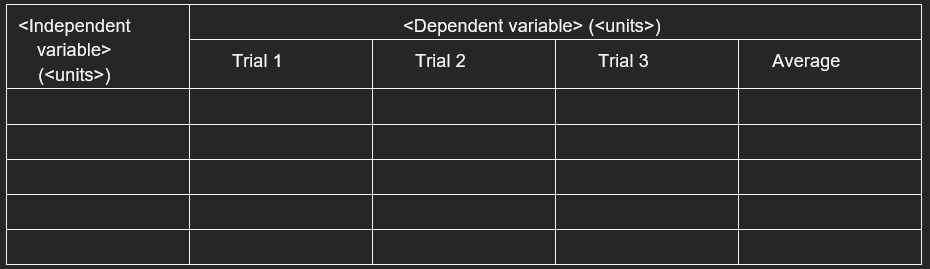
Table format
Common sources of error
Incomplete definition (systematic or random)
Failure to account for a factor (usually systematic)
Environmental factors ((systematic or random)
Instrument resolution (random)
Calibration (systematic)
Zero offset (systematic)
Physical variations (random)
Parallax (systematic or random)
Instrument drift (systematic)
Lag time (systematic)
Extrapolation
Extending the line of best fit forward using a dashed line to estimate data.
Versus graph format
“<Variable on vertical axis> vs <variable on horizontal axis> for <what you are using to investigate this relationship>”
Percentage error

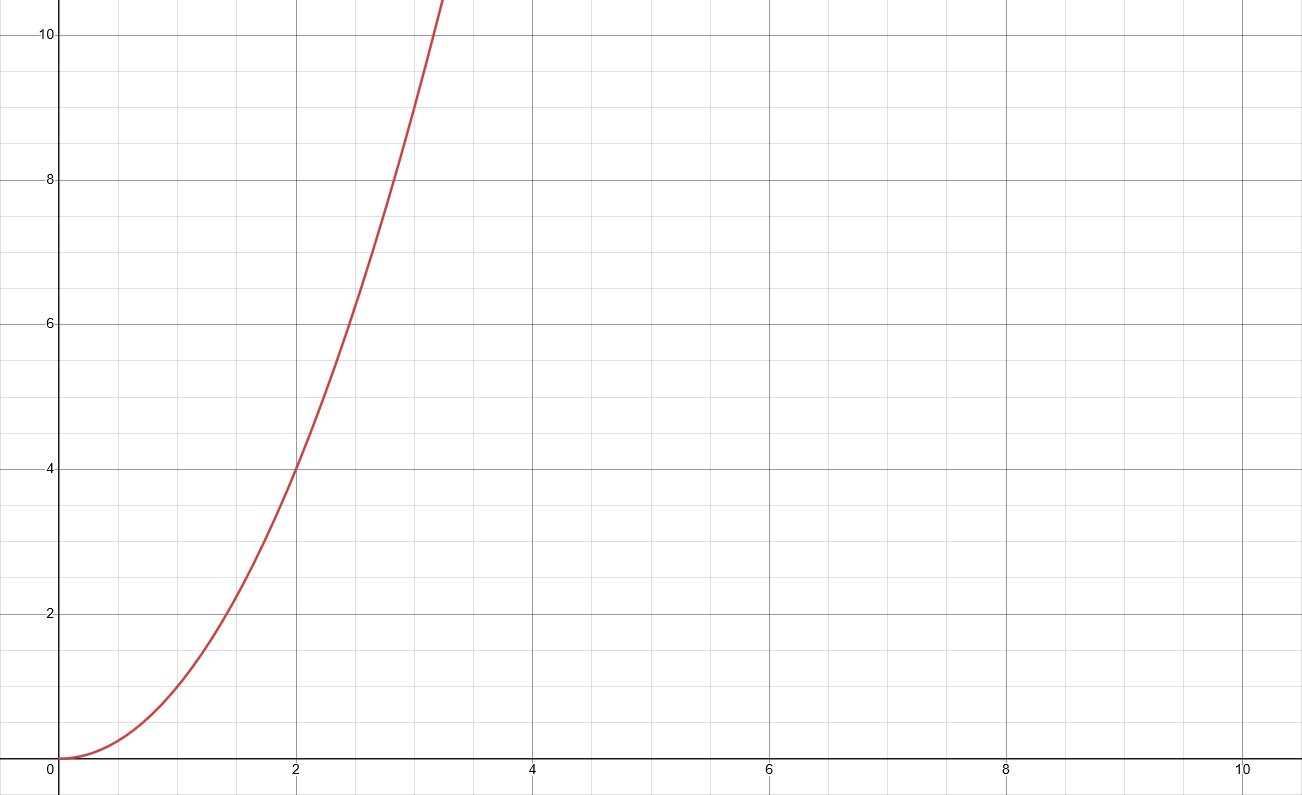
Parabolic curve
Equation A = k * Bn
Lineaized A = k * n√B
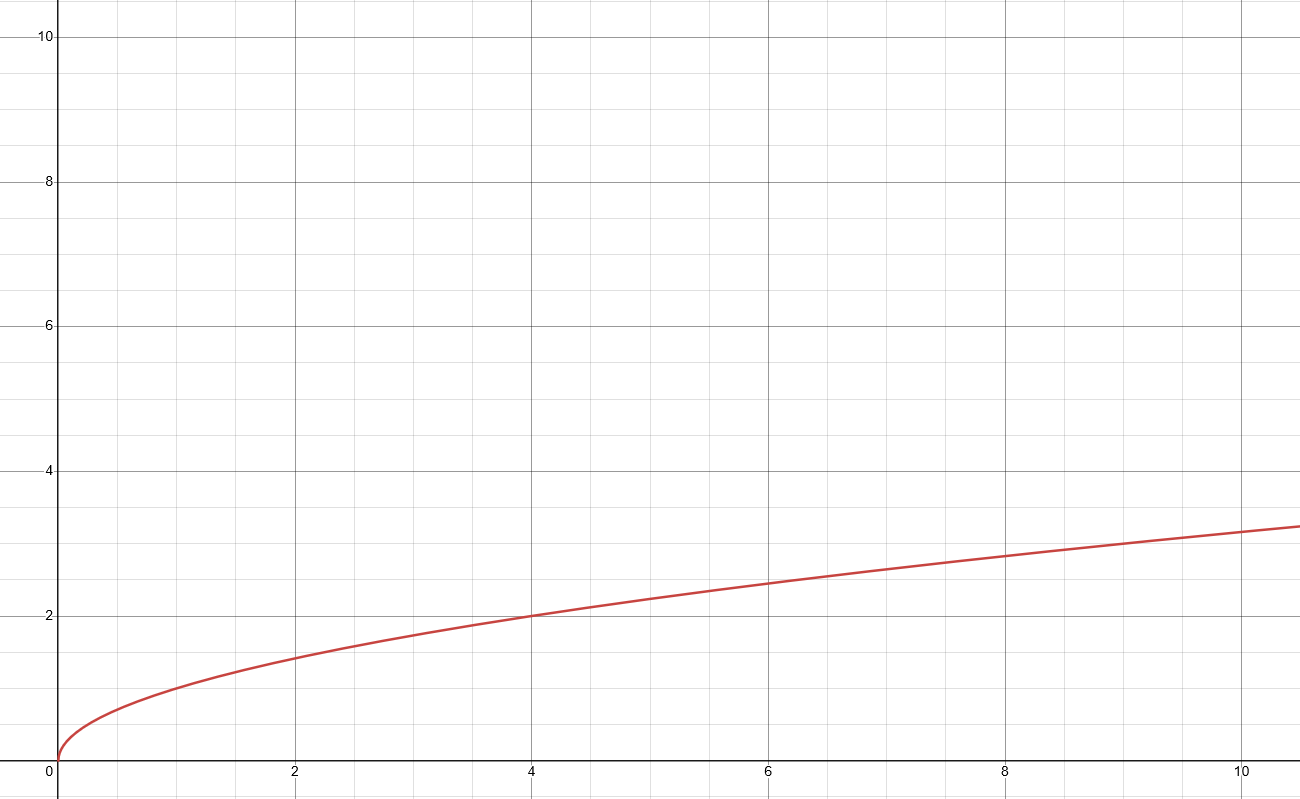
Root curve
Equation A = k * n√B
Lineaized A = k * Bn
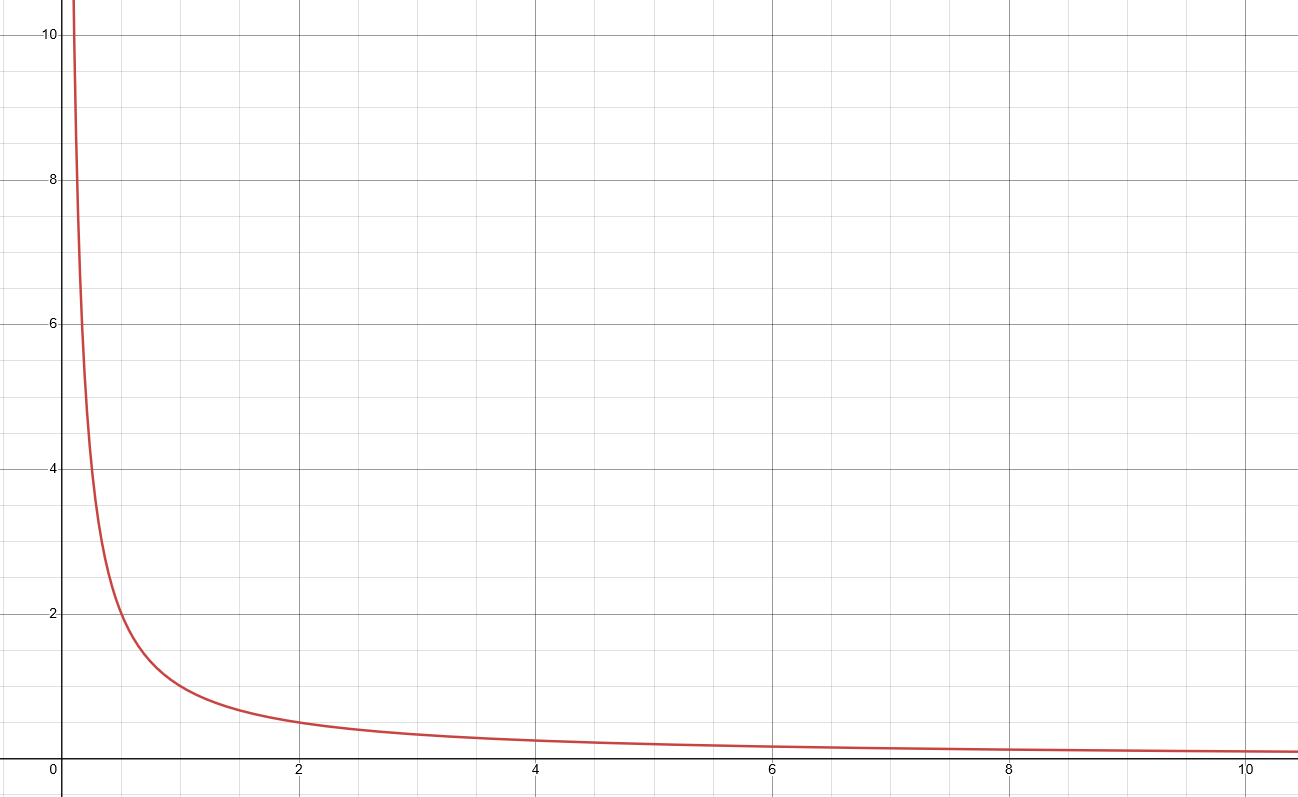
Inverse or hyperbolic curve
Equation A = k * B-n
Linearized A = k * B-1/n
Secondary-sourced information
An investigation that involves systematic scientific inquiry by planning a course of action and sourcing data and/or information from other people, including written information, reports, graphs, tables, diagrams and images.
APA general format
Author(s), (Year of Publication). Title (edition), Place of Publication, Publisher
Eg: Drew, P., & Horden, P.T., (2008). New Tent Architecture (2nd ed.). London: Thames & Hudson.
Internal reliability
When repeated trials within an experiment are consistent. This is sometimes also called precision.
External reliability
When the results from one experiment are consistent with those from other experiments that are conducted the same way.
Reliability judgement format
“For each <independent variable>, we <measurement of dependant variable>. The <results from dependent variable> were recorded and compared until there was <No. of trials> consistent <dependent variable> (any outliers were removed) Once <No. of trials> have been achieved, <change in independent variable> and the process repeated until <No. of trials> more consistent <dependent variable> were achieved from the new <independent variable>. Once <No. of trials> consistent <Dependant variable> were achieved for <every change in dependant variable> then the <results for dependant variable> were averaged. This ensured high reliability of our measured data.”