Confidence Intervals
1/47
There's no tags or description
Looks like no tags are added yet.
Name | Mastery | Learn | Test | Matching | Spaced | Call with Kai |
|---|
No analytics yet
Send a link to your students to track their progress
48 Terms
confidence interval def.
An interval used to approximate a population parameter (mean/proportion)
sample mean
x-bar
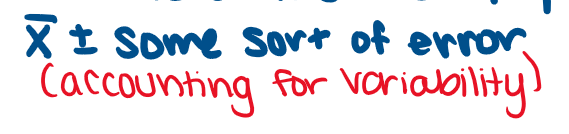
an unbiased estimator of pop. mean therefore the tru pop. mean should be around: (image)
point estimate def.
unbiased estimate of pop. parameter (sample statistics x-bar, p-hat)
(also the average of interval boundaries)
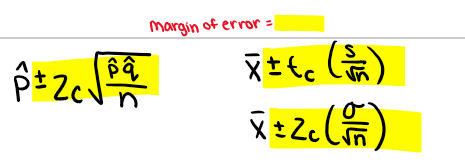
Margin of error (E) def.
max allowable room for error
how much of the data is covered, therefore how confident we feel pop. parameter wil be in interval
(1/2 length of interval OR length from point estimate to interval boundary)
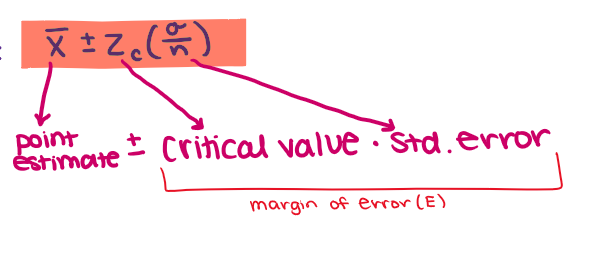
Margin of error equation
E=critical value x standard error
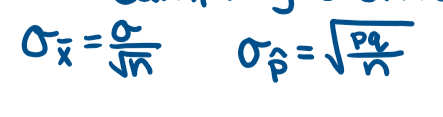
Standard error def.
SD of sampling distribution
critical value notation
z(sub c) = z*
formula for contructing z-interval
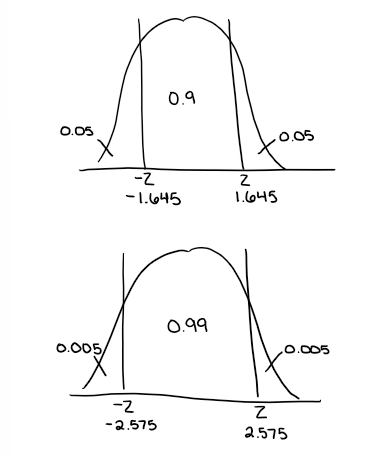
Confidence Level
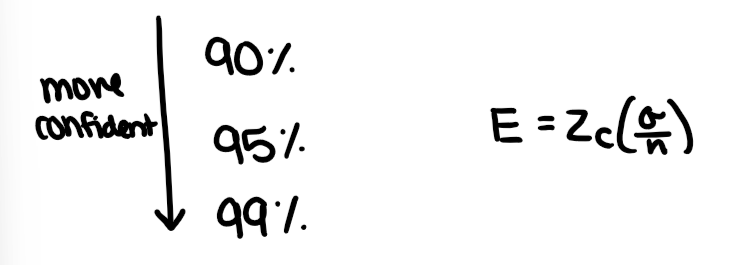
What if confidence level increases?
As conf. level increases, margin of error increases becayse we are covering more data (makes interval wider)
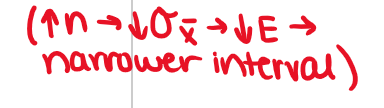
what if sample size increases?
As sample size increases, SD decreases, so margin of error decreases (makes interval narrower)
interval gets narrower —> variability decreases, more precise
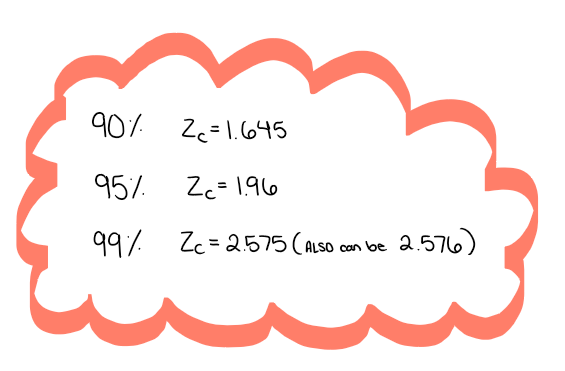
Confidence intervals and their z-critical values
Confidence interval STEPS
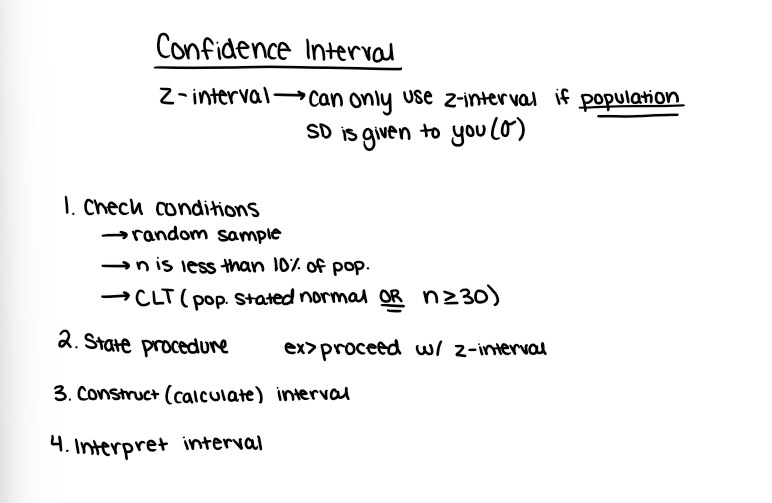
use z-interval when…
pop. SD is given
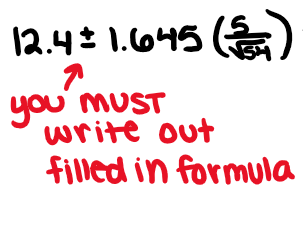
MAKE SURE TO WRITE OUT THIS FORMULA IN EVERY PROBLEM
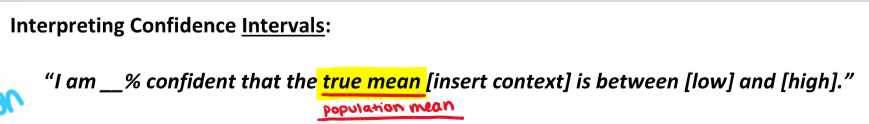
Interpreting confidence intervals
**you must write this interval interpretation everytime you construct a confidence interval
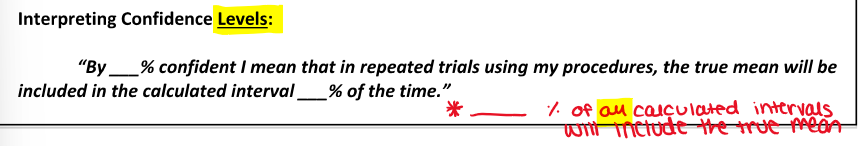
Interpreting confidence levels
only do this when asked
On calc: for z-interval
stats
tests
7
data —> for actual list of points
stats
put in info
calculate
DONE
when pop. SD is unknown…
you are given sample SD (s)
formula for a confidence interval for a population mean when the population standard deviation is UNKNOWN:
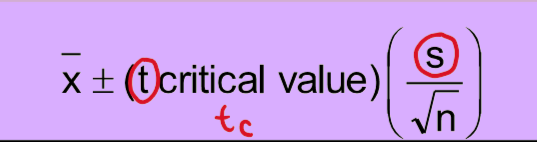
what is the t-critical value based on?
n-1 degreese of freedom (can be found of t-chart in formula sheet)
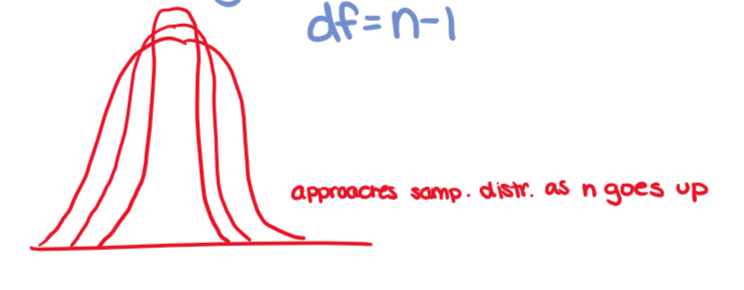
properties of the t-distribution
it is bell shaped and symmetric about the mean
it is a family of curves, each determined by a parameter called degrees of freedom (df=n-1)
Total area under the t-curve is equal to 1
the mean, median, and mode are equal to 0
As the degrees of freedome increase, the t-distribution approaches the z-distribution
z vs. t distributions
normal distribution is narrower and the t distribution is wider with thicker tails
both asume normally distr. pop.
normal distribution uses pop. SD (σ) whule t-distr. uses sample SD (s)
sample SD is always larger than pop. SD, which is why t-distr. is wider with thicker tails (more liekly to have values that fall far from mean)
the smaller the df (smaller sample size), the thicker the tails because more variability with a smaller sample size
in a t-int problem, ALWAYS…
ALWAYS write down the degrees of freedom (df)
t-distr: what if CLT is not met…
create a normal prob plot
When given SPECIFIC data use calc to make normal prob plot to show normality
more linera = more normal
z on x-axis, unit of data on y-axis
sentence: According to the normal prob plot, it is safe to say the sample came from an approximately normal pop., so sample distribution is approxiamtely normal according to CLT.
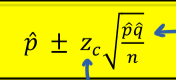
The general formula for CI for 1-prop z-int
z(sub c): proportions ALWAYS use z-critical values (z critical values are on infitity line of t-chart)
only have sample info, so using p-hat and q-hat for everything (we are estimating p, so obvisouly it is missing)
In calc: 1-prop z-int
stat
tests
A: 1 prop z int
DONE
calculator asks for x and n bc p-hat = x/n
equation for p-hat
p-hat = x/n (THESE MUST be whole numbers, cannot be decimals)
1 prop z int: what if you are not given x?
you can find it: x =n(p-hat)
*round to nearest whole number
CI interpretation (1 prop z int)
I am __% confident that the true population of __ is between __ & __.
CI level interpretation (1 prop z int)
By __% confident, I mean that in repreated trials using my procedures, the true population of __ will be included in the calculated interval __% of the time.
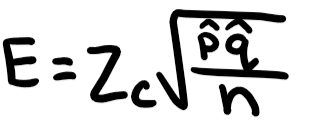
Margin of errors
what comes after the (+&-), which is always the critical value times the standard error, os the margin of error. Remember we use E to represent the margin of error.
The margin of error for a CI of a population proportion is given as:
this is the formula for margin of error for proportions
To estimate the population proportion (p) to within an amount of E, the sample size of n that is reqired is:
this is the formula for finding minimum sample size given a specific margin of error and other info (z-critical value, p-hat, q-hat)
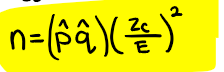
In many problems, p-hat is NOT given so in ordeer to find the minimum sample size we use a…
p-hat of 0.5 because this created the largest variable which will in turn give us the largest minimum sample size in order to be conservative
*use p-hat=0.5 unless problem specifically states to use the p-hat given
ex of when probelm is telling you to use p-hat given> Use the FOx News estmate as the basis for your calculation.
In sample size problems…
ALWAYS round up
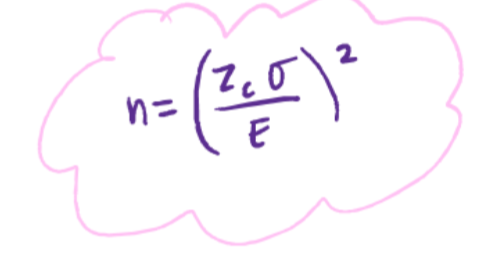
Although not as common, sample size may be calculated for ____ aswell.
means
**this can also be done for means. It is much less common but occassionally shows up in MCQs.
The sample size required to estimate a population mean (μ) within E margin of error is:
this is the formulla for finding minimum sample size given specific margin of error and other info (z-critical value, population SD)
Types of CI:
1 sample z-interval for means (unlikely to be used since so rare to know σ)
given pop. SD (σ)
1 sample t-interval for means
given sample SD (s)
1 sample z-interval for proportions (1 prop z int)
2 sample z-interval for proportions (2 prop z int)
Steps for solving 2 prop z int:
Defin variables
check conditions
mechanics
2 prop z int: define variables
make key and find variables

2 prop z int: Checking conditions
Random chosen samples and assume independent samples: “Assume random and independent samples of ____”
n1 and n2 both must be less than 10% of pop. size: “Reasonable to say n1 = __ is less than 10% of __ and n2 = __is less than 10% of all __”
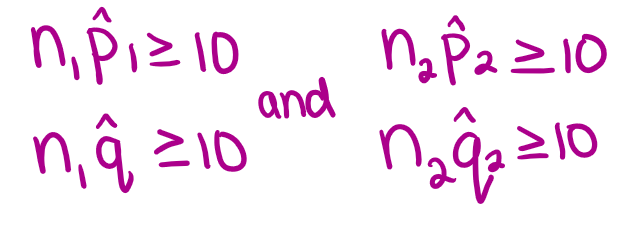
Success/failure condition: “If s/f met, the samples are large enough to aproximate normality in sampling distribution of the differences (IMAGE)”
“Proceed with caution to 2 prop z int
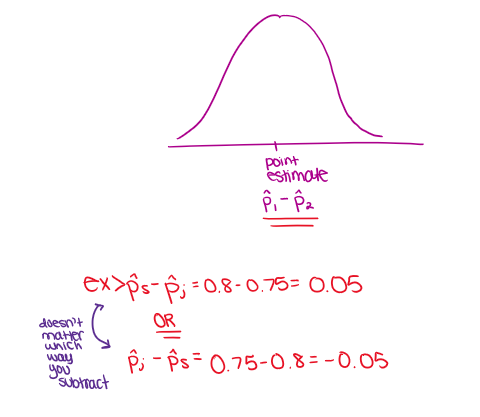
2 prop z int: Mechanics —> sampling distribution of differences
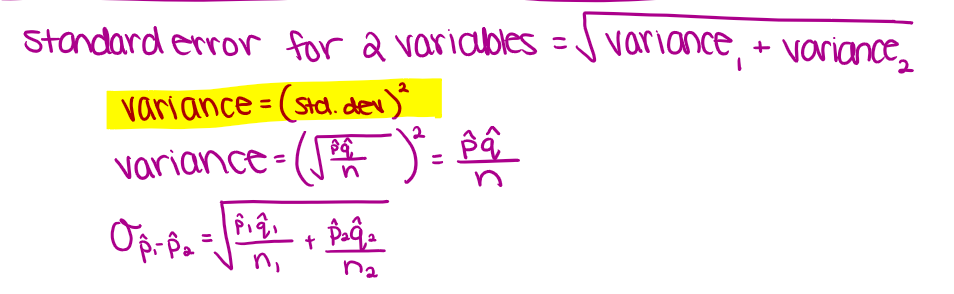
2 prop z int: Mechanics —> standard error for 2 proportions
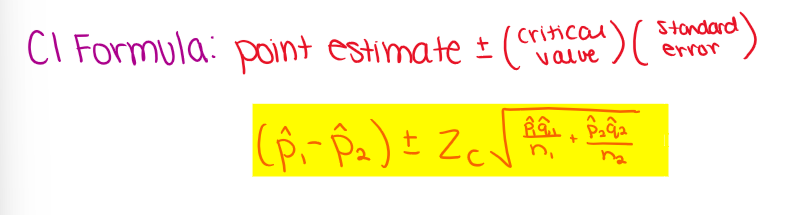
2 prop z int: Mechanics —> CI formula
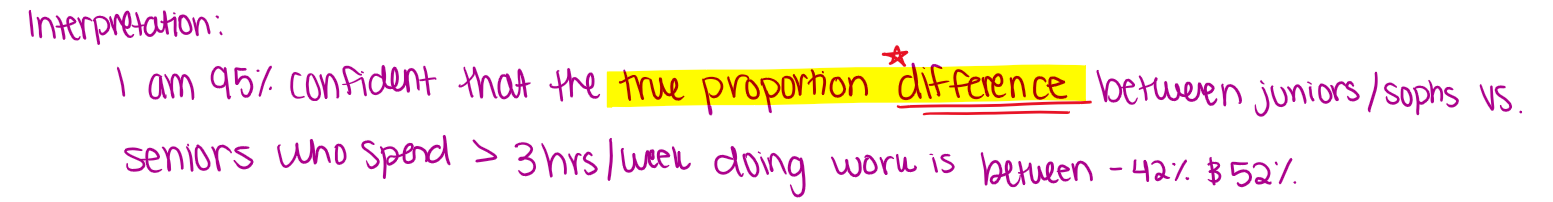
2 prop z int: Mechanics —> Interpretation
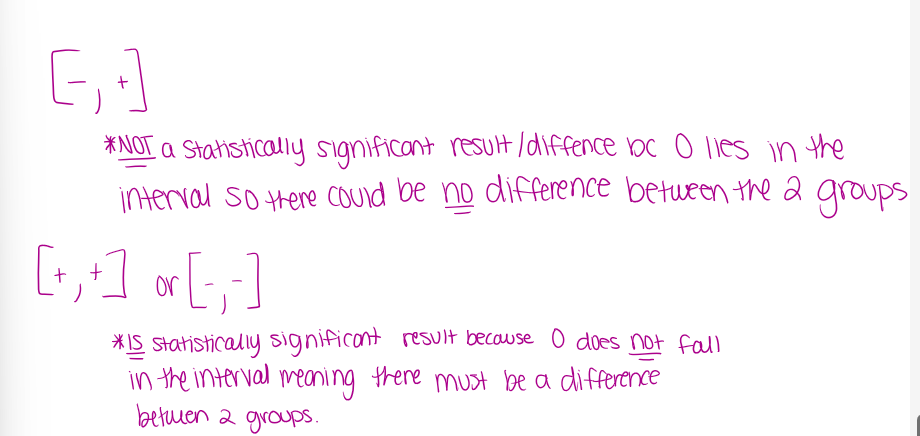
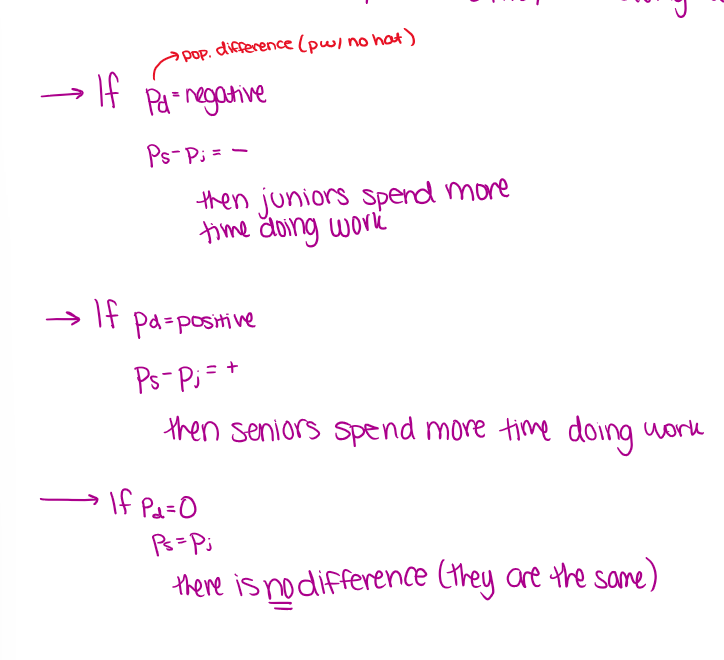
2 prop z int: Mechanics —> Population difference
2 prop z int: Mechanics —> statistically significant results