Principles of Economics
1/165
There's no tags or description
Looks like no tags are added yet.
Name | Mastery | Learn | Test | Matching | Spaced | Call with Kai |
|---|
No study sessions yet.
166 Terms
Economics
the study of choice in a world of scarcity
On one hand people have practically unlimited needs and wants, while on the other hand resources are too scarce to meet all of those needs and wants
Economics investigates constrained decision making
Balancing the tradeoffs of economics:
At its core, this is the question economics attempts to answer
Basically, the answer is that individual choices attempt to achieve a perceived optimal outcome
Self-interest
people make decisions based on their preferences
Economics determines that people are self-interested, not that people are selfish
Three big questions society often focuses on are:
What to produce?
How to produce?
For whom do we produce?
Central planning
at its extreme attempts to completely replace market systems
In essence, central plan-ning attempts to mimic the role of markets and improve upon their out-comes
Evidence shows that moving too far toward central planning results in poor performance when it comes to a wide variety of measures of standards of living
Completely free markets
unfettered markets with no governance can lead to great instability and poor outcomes for citizens as well
Markets come into being naturally as people find ways to interact to satisfy their needs and wants
Policies to protect property rights and ensure fair, competitive markets are fundamental building blocks of a thriving society
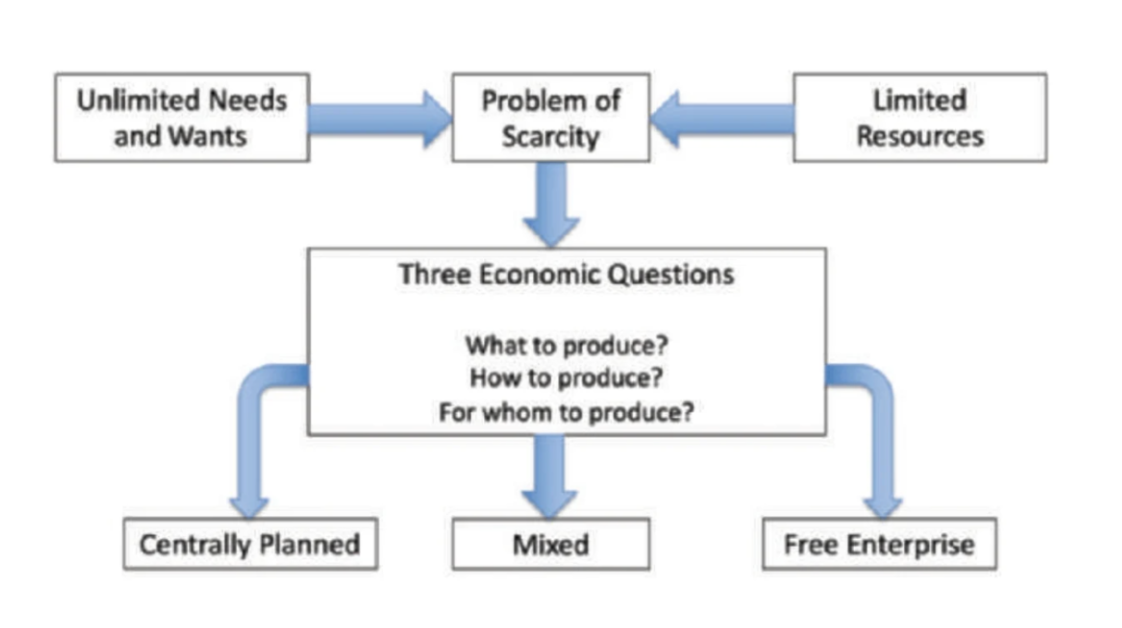
Figure 1
Figure 1 that looks at how unlimited wants and needs combined with limited resources leads to scarcity and how the three questions of economics lead to the development of systems to combat scarcity.
Market failure
a situation in which a market left on its own fails to allocate resources efficiently
Often, there are negative externalities that result from economic activity
Externality
occurs when there is an uncompensated impact of one person’s actions on the well-being of a bystander
A negative externality is a situation when that impact affects the well-being of a bystander negatively
Competition:
For markets to allocate resources efficiently, there must be an adequate level of competition
Economists like competition because it lowers prices, increases quantities produced, and leads to more efficient markets
In a way, competition is redistributive in that it allows more consumers and producers to participate in and benefit from markets
Monopoly
a market with a sole seller of a product with no close substitutes
Policy makers and economists are wary of monopolies because they result in prices that are higher and quantities that are lower than is often considered optimal or efficient
This leaves a potential role for government to encourage competition through antitrust laws and regulation
Microeconomics
a study of individual choices by households and firms
As the name portends, microeconomics focuses on smaller levels of decision making
Households
the consumers in goods markets and workers in labor markets
Households represent people broken up into units making common decisions
Utility
represents the satisfaction level of the household
Firms
the producers of our goods and services, from Big Pharma to the roadside fruit market
Firms include sole-proprietorships, partnerships, limited liability companies, corporations, and any other way to organize a business
The goal of a firm is to maximize profits
Physical capital
includes the tools, factories, equipment, and machines that firms use to produce
Physical capital and labor complement each other, and each increases the other’s efficiency
Marginal analysis
to achieve a perceived optimal outcome, firms and households must per-form an incremental and constantly evolving cost–benefit analysis called marginal analysis
At every step of the marginal analysis, the individual compares the marginal benefit to the marginal cost
You can think of the marginal costs and benefits as the “next” costs and benefits; “If I take this ‘next’ step, this is my ‘next’ cost and this is my ‘next’ benefit”
You do not go forward with an activity if the cost is greater than the benefit
Rational people
systematically and purposefully do the best they can to achieve their objectives
Example:
John Jacob Jingleheimer Schmidt has already invested $100 million on a business venture he thought would make him $150 million in revenue. John has a really bad day and finds out that he needs to invest more money to finish the project and the actual revenue he is going to earn is only going to be $110 million. Which of the following is true?
He should scrap the project no matter what and cut his losses
He should invest only up to $10 million more
He should invest only up to $150 million more
He should invest only up to $110 million more
He should invest more money no matter what it costs
The answer here when only considering the marginal benefit and marginal cost would be “d.”
When conducting a marginal analysis, sunk costs cannot be taken into consideration. We call the point where the marginal cost is equal to the marginal benefit the indifference point. In a marginal analysis, we always include the indifference point for mathematical consistency.
Opportunity costs
the things that are given up
There are two types of opportunity costs: explicit opportunity costs and implicit opportunity costs
Explicit opportunity costs
involve the transaction of money
Anything that requires you to exchange money to obtain a good or service is considered an explicit opportunity cost
Implicit opportunity costs
anything else you need to give up obtaining something outside of explicit costs
They can be monetary costs or costs of lost utility
Diminishing marginal utility of consumption
the more we have of a certain good, the less satisfaction we receive from another unit of that good
Marginal utility
the utility from the next unit consumed
Marginal cost
the cost of the next unit consumed
Diminishing marginal productivity (DMP)
the property whereby the marginal production of an input declines as the quantity of the input increases, holding all other inputs constant
Changes in production are still positive as the input increases, but the size of the increases in production becomes smaller
Said another way, production increases at a decreasing rate
Here we are talking about the produc-tion process with increases in labor as I hold the physical capital constant
DMP of labor is due to the logistical and physical constraints of sharing the fixed capital
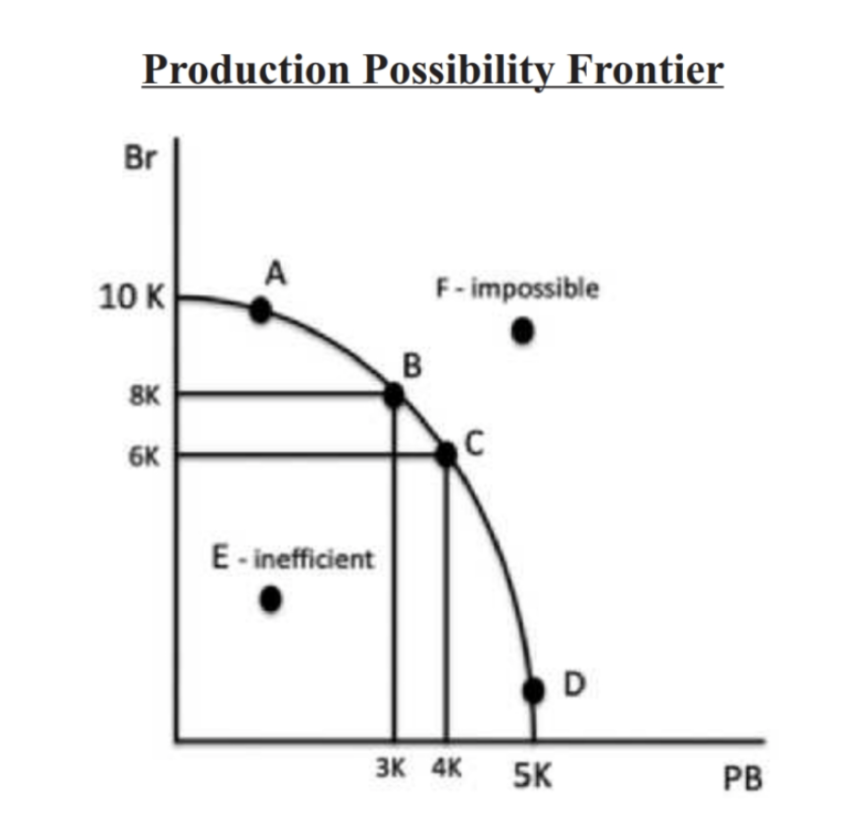
Production possibility frontier (PPF) model
shows the combinations of output an economy can produce given the available factors of production and the available technology
The PPF illustrates a nation’s tradeoffs in production and the costs involved in those tradeoffs
Figure 2 shows PPF. With the PPF, note that if we draw a line tangent to the PPF at any point, that line is downward sloping. The slope dictates that there must be a tradeoff between the two goods when it comes to production. We face tradeoffs and have opportunity costs associated with those tradeoffs. Anywhere along the curve at point A, B, C, or D (or anywhere else) is possible. That is the frontier of our production capabilities. The eventual point chosen depends on a country’s preferences.
Bowed shape on a PPF graph
represents the assumption of specialized factors of production
Specialized factors of production
inputs to production that are more suitable to producing one specific good versus another
Specialized factors of produc-tion result in opportunity costs changing as we move to one extreme or the other
Absolute advantage
one type of efficiency, which is the ability to produce a good using fewer inputs
Trade is not dependent on absolute advantage
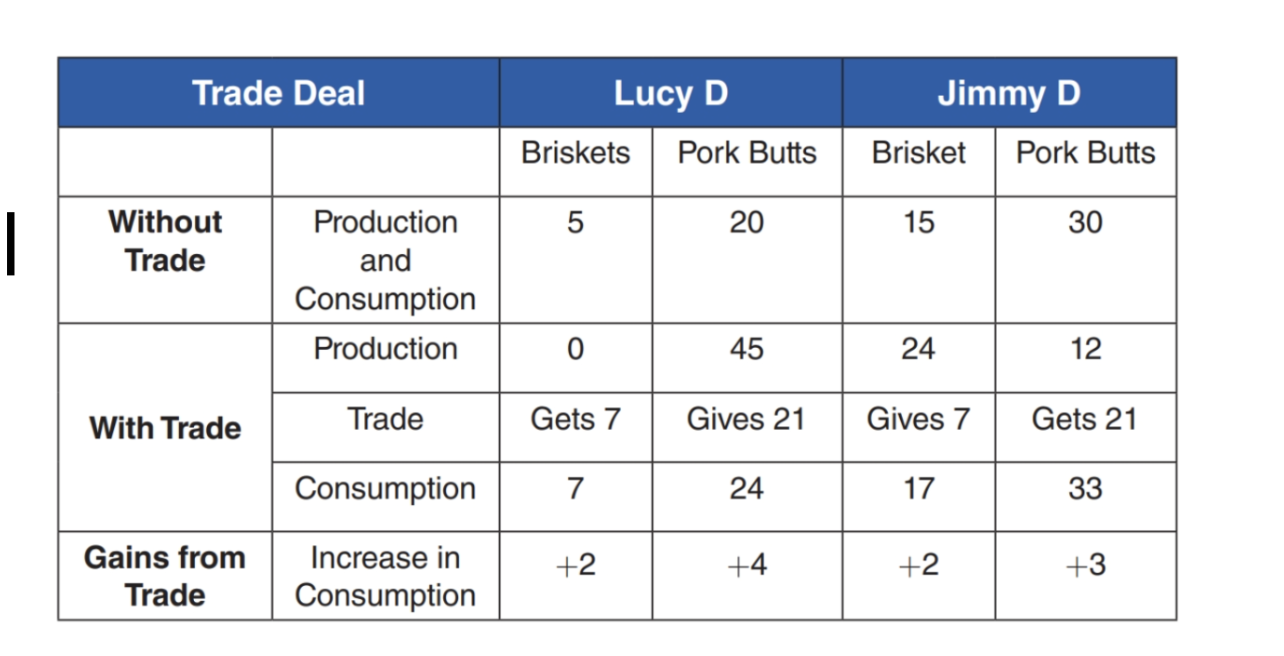
Comparative advantage
the ability to produce a good at a lower opportunity cost than another producer
If two countries have different comparative advantages, trade can be beneficial to both if the price of trade is between the two countries’ opportunity costs
Figure 3 shows the difference between not trading and trading and how countries that have different comparative advantages can both benefit from trading with one another
Macroeconomics
the study of economy-wide phe-nomena, including inflation, unemployment, and economic growth
Macroeconomics takes all the individual decisions by households and firms, and aggregates them to estimate the economic performance of a nation
Macroeconomics attempts to add up all the little pictures into the big picture
Gross domestic product (GDP)
measures three things simultaneously: production, income, and expenditures
Inflation
which is an increase in the overall level of prices in the economy
Low and stable rates of inflation are considered healthy for an economy because they show increased demand, and they give confidence to firms to increase production and hire new workers
When inflation is too high, the costs outweigh the benefits
The main cost associated with infla-tion is the diminishment of the purchasing power of money
Hyperinflation
a term to describe rapid, excessive, and out-of-control general price increases in an economy
Unemployment rates
attempt to capture the percentage of people who want to work but cannot find work
Participation rates
attempt to capture the percentage of people who want to work out of those eligible to work
The two rates should always be looked at together to understand the big picture
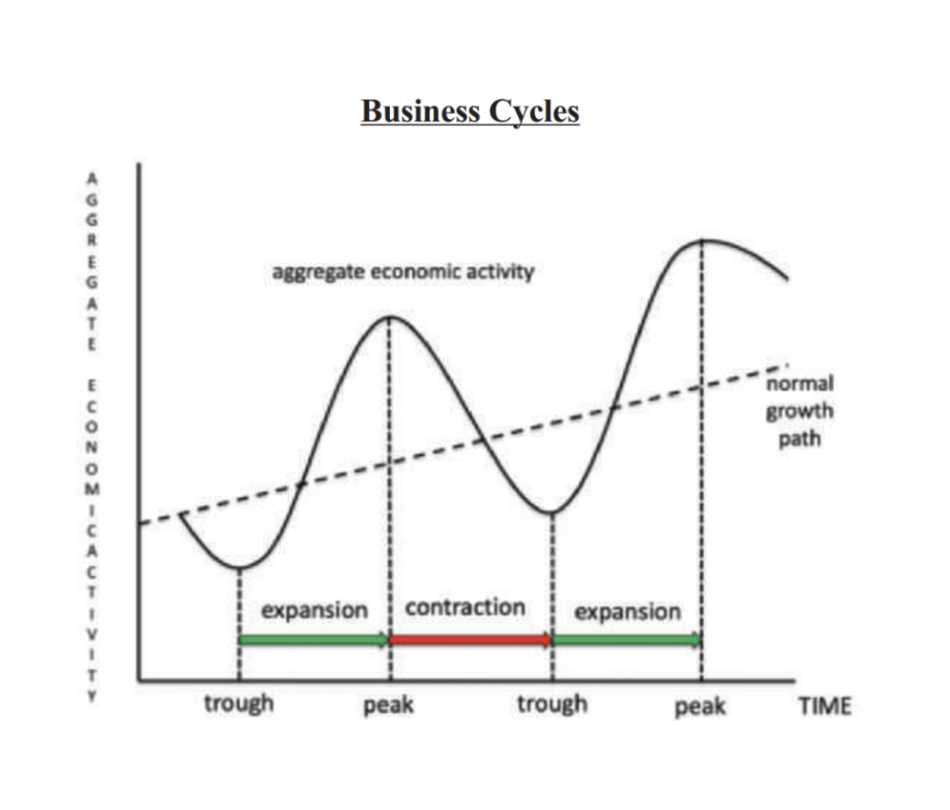
Business cycles
types of fluctuations in aggregate economic activity of nations that organize their work mainly in business enterprises
The cycle consists of expansions occurring about the same time in many economic activities, followed by similar general contractions and revivals, which merge into the expansion phase of the next cycle
This sequence is recurrent but not periodic, varying in dura-tion from about 1 to 12 years
Trough
the bottom of the business cycle
Peak
the top of the business cycle
Expansion
from the trough to the peak is an expansion of aggregate economic activity
Contraction
from the peak to the trough is a contraction of aggregate economic activity
Economic growth
a long-run phenomenon referring to an increase in aggregate production and the mar-ket value of goods and services in an economy over time
The long run is derived from all the short-run business cycles over time
Sticky wage theory
a short-run theory asserting that wages are “stickier” than prices, or that wages adjust slowly to changes in price levels
Results in the Phillips curve
Phillips curve
asserts there is a tradeoff in the short run between inflation and unemployment
This idea is central to the policies employed by many central banks in their attempts to achieve full employment in the economy
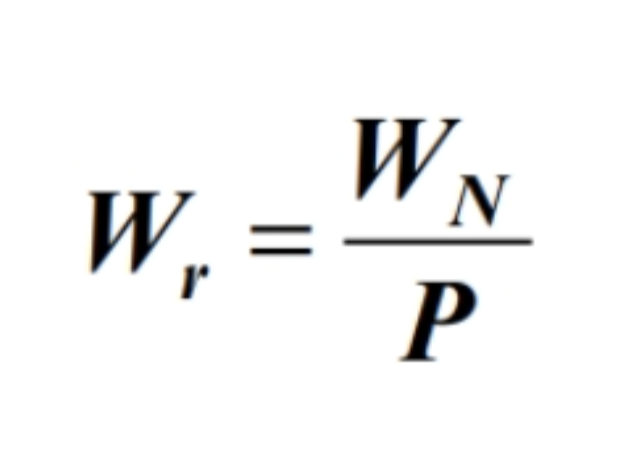
Nominal wage
the average wage workers earn in dollars
The price level is the average cost of goods and services and would be represented by some sort of price index like the CPI
On the firm side, the nominal wage is the average cost of labor in dollars
Real wage
the average amount of stuff (goods and services) workers can buy with the wages they earn
The real wage is the real cost of labor in terms of lost production
Real wages are of course more important than nominal wages to a standard of living
Productivity
the quantity of goods and services produced from each unit of labor
Empirical evidence shows there are some important factors that lay the condi-tions for economic growth by increasing a country’s productivity:
Physical capital, or the tools, equipment, machines, and factories used in production
Human capital, or the health, knowledge, and skill of our workforce
Natural resources, including air, land, sea, and energy and mineral sources
Entrepreneurship, or people’s willingness to take financial risks for the financial rewards that come along with innovation
Social and legal framework, which considers whether a country has a system of rules and laws that encourages productivity
*Technology, which is starred because innovation is the most impor-tant factor for long-run, sustained economic growth
Technology affects all our other factors
Ways to control economy:
Price ceilings
Price floors
Rent regulations
Minimum wages
Market economy
an economy that allocates resources through the decentralized decisions of many firms and households as they interact in markets for goods and services…The Invisible Hand
This is as opposed to central economic planning like that which occurred in the Soviet Union–does not work out so well
Roles of government:
in order to facilitate The Invisible Hand, the government must enforce rules and maintain institutions that are key to the market economy
Property rights - the ability of an individual to own and exercise control over scarce resources
Property rights are limited
Critics of property rights argue that it leads to inequality (accumulation of wealth from property rights)
In order to facilitate efficiency, the government can help improve markets
Market failure - a situation in which a market left on its own fails to allocate resources efficiently
Externality - which is the uncompensated impact of one person’s actions on the well-being of a bystander
Tragedy of the Commons
Market power - which refers to the ability of a single person or small group to unduly influence market prices
Monopolies
Government can also intervene in the market to facilitate equality
An economic question but also a question of fairness or social justice
Your thoughts on addressing equality are often based on your politics
Property rights
the ability of an individual to own and exercise control over scarce resources
Property rights are limited
Critics of property rights argue that it leads to inequality (accumulation of wealth from property rights)
Market failure
a situation in which a market left on its own fails to allocate resources efficiently
Externality
which is the uncompensated impact of one person’s actions on the well-being of a bystander
Tragedy of the Commons
Market power
which refers to the ability of a single person or small group to unduly influence market prices
Monopolies
Microeconomics
the study of how households and firms make decisions and how they interact in markets
Smaller decision making units
Households: consumers
Households are trying to maximize utility (satisfaction)
Firms: businesses
Firms are trying to maximize profits
Two big inputs to production → labor (workers) and capital (tools/ machinery)
Labor is variable and capital is fixed initially, but then labor and capital both end up variable in the long-run
Rational people
people who systematically and purposefully do the best they can to achieve their objectives
Marginal analysis
incremental and constantly evolving cost benefit analysis
When making decisions, people compare the marginal costs to the marginal benefits
Forward looking
Example:
John Jacob Jingleheimer Schmidt has already invested $100 million on a business venture he thought would make him $150 million in revenue. John has a really bad day and finds out that he needs to invest more money to finish the project and the actual revenue he is going to earn is only going to be $110 million. Which of the following is true?
He should scrap the project no matter what and cut his losses
He should invest only up to $10 million more
He should invest only up to $150 million more
He should invest only up to $110 million more
He should invest more money no matter what it costs
Goal is to minimize losses ($100,000 is sunk, so now the focus is on the marginal cost equalling the marginal benefit to minimize losses)
Opportunity costs
whatever must be given up to obtain something (phone explicit and implicit)
Explicit: putting money down
Implicit: not putting money down
Example:
What are the opportunity costs of going to school?
Explicit:
Tuition
Room & board
Textbooks
Implicit:
Lost leisure time
Lost salary
Marginal analysis: a consumer’s choice
A person’s willingness to pay for a good is based on the marginal benefit that an extra unit of the good would yield. That marginal benefit depends on how many units the person already has. Diminishing marginal utility of consumption, states the more we have of a certain good, the less satisfaction we receive from another unit of that good
Marginal analysis: a producer’s choice
Labor
Physical capital
Factories
Tools
Machinery
Diminishing marginal productivity (DMP)
states that production increases at a decreasing rate as we add more of an input while holding other inputs constant
Tradeoffs in national production:
Assumption: one country that produces two different goods, specialized factors of production (some are better at producing one good than the other)
The production possibility frontier
shows the combination of output that the economy can possibly produce given the available factors of production and the available production technology
Downward slowing: we face trade offs and have opportunity costs associated with those trade offs
Trade offs
can’t produce more of one good without giving up more of the other
Opportunity costs
how many of one good we have to give up to get another unit of a different good
From B to C, the opportunity cost of producing 100 more IPAs is 200 wings
Bowed shape
the opportunity costs increase as we move to one extreme or the other
At point D, the resources best suited to wing production are being used for IPA production, which is inefficient (big losses for small gains)
International trade:
Trade allows countries to specialize and enjoy a great variety of goods and services
You can make what you have an advantage in making and buy the rest from someone else
Comparative advantage drives trade
Ex: in the U.S., our comparative advantage is technology, but we do not have an advantage in manual labor production
Loss of industry can lead to negative social effects: drug use, suicide, depression, etc.
Therefore, a push towards industries where we have a comparative advantage is necessary
Trade allows us to break the possibility frontier curve
Absolute advantage
the ability to produce a good using fewer inputs than another producer
Comparative advantage
the ability to produce a good at a lower opportunity cost than another producer
The price of trade
for both parties to gain from trade, the price at which they trade must lie between the two opportunity costs
Market
exists every time there are buyers and sellers for a particular good or service
Good
products that are tangible like apples or shoes
Services
intangibles or products that cannot be stored and are consumed at the place and time of their purchase
Ex: going to a concert to listen to music
Perfectly competitive market
a market with many buyers and sellers, identical products, free entry and exit into the market, and homogenous firms facing the same costs of production
In a perfectly competitive market, buyers and sellers have no power to set prices
They are price takers
Markets are made up of individuals:
There-fore, buyers and sellers really should have at least a tiny bit of power over the price
However, we are saying they have such little power that it is negligible
Market forces dictate prices to buyers and sellers
Quantity demand
the amount of a good buyers are willing and able to purchase
Individual demand
the relationship between the price of a good and an individual buyer’s quantity demanded
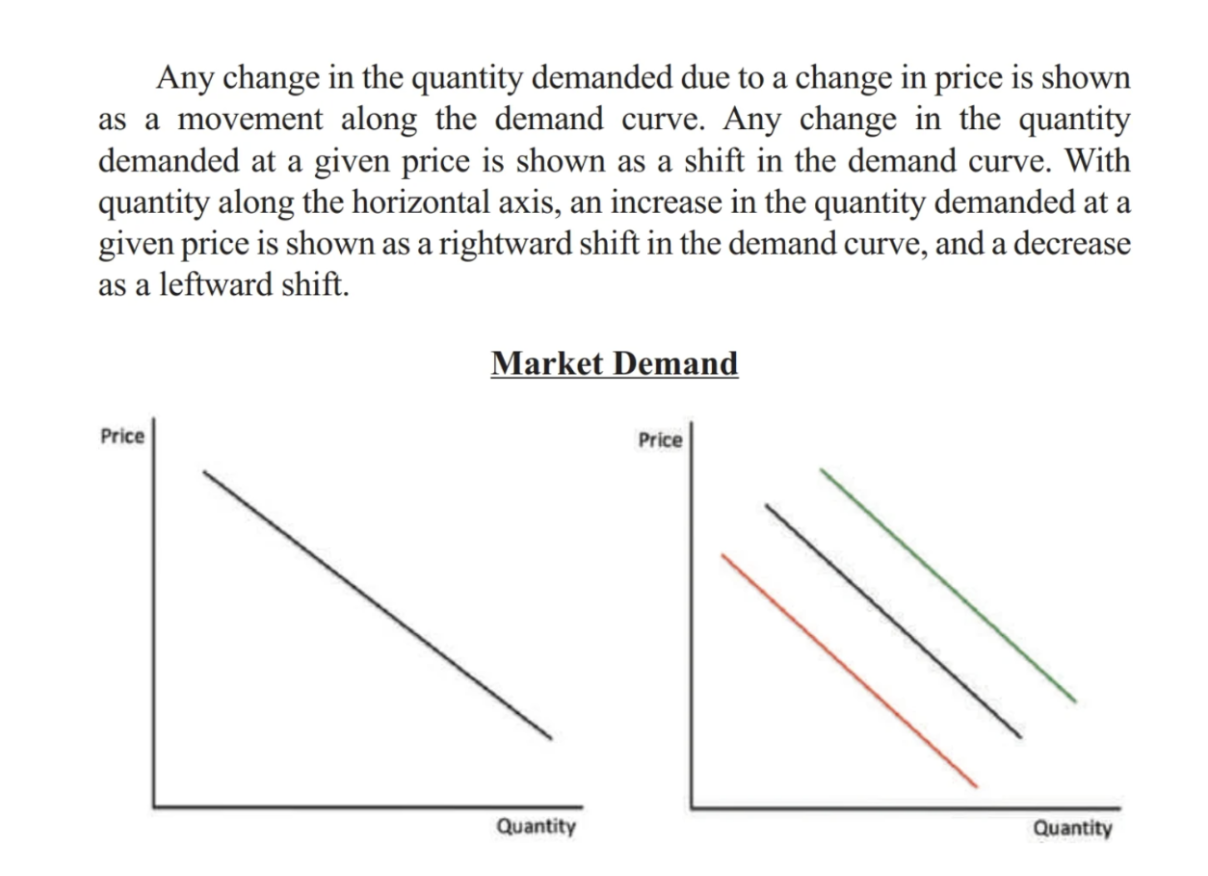
Market demand
the relationship between the price of a good and the quantity demanded by all the buyers in the market
Market demand adds up all the individual buyer’s demand
The demand curve is downward sloping
Law of demand
all other things being held equal, the quantity demanded of a good will increase when the price of the good decreases
Increases in a market can happen intensively or extensively:
By intensively, I mean that as prices go down, consumers already in the market are willing and able to purchase more of the good
By extensively, I mean that as prices go down, more consumers are enticed to enter the market
Different buyers value products differently and will not enter the market until the price comes down to the value they place on the product
Factors that affect a buyer’s demand beyond changes in prices include:
Income
Normal goods - goods that we purchase more of as our income increases
Inferior goods - goods that we purchase less of as our income increases
Price of related goods
Complements - goods that go together and for which an increase in the price of one leads to a decrease in the demand for the other
Substitutes - goods that can replace each other and for which an increase in the price of one leads to an increase in the demand for the other
Preferences
Expectations
The number of buyers
Normal goods
goods that we purchase more of as our income increases
Inferior goods
goods that we purchase less of as our income increases
Complements
goods that go together and for which an increase in the price of one leads to a decrease in the demand for the other
Substitutes
goods that can replace each other and for which an increase in the price of one leads to an increase in the demand for the other
Quantity supplied
the amount of a good sellers are willing and able to sell
Individual supply
the relationship between the price of a good and an individual seller’s quantity supplied
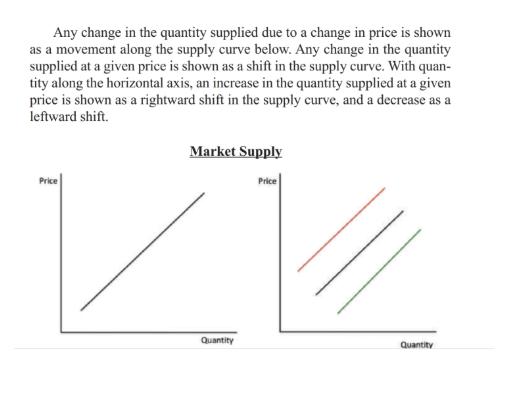
Market supply
the relationship between the price of a good and the quantity supplied by all the sellers in the market
Market supply adds up all the individual seller’s supply
The supply curve is upward sloping
Law of supply
all other things being held equal, the quantity supplied of a good will increase when the price of the good increases
Increases in a market can happen intensively or extensively:
By intensively, I mean that as prices go up, sellers already in the market are willing and able to sell more of the good
As margins increase and selling becomes more profit-able, firms take advantage of that by increasing production
By extensively, I mean that as prices go up, more producers are enticed to enter the market
Different firms have different costs of production and will not enter the market until the price of a good is high enough to justify incur-ring the costs of production
Factors that affect a seller’s supply beyond changes in prices include:
Input prices
Technology
Expectations
Number of sellers
Market equilibrium
a situation where the price is such that the quantity supplied equals the quantity demanded
With perfect infor-mation, markets should be at equilibrium unless there is a policy in place that prevents it
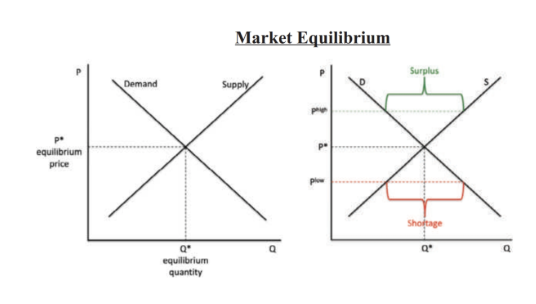
Surplus
if markets sell at a price that is too high, supply is greater than demand
In that case, firms have excess inven-tory sitting on their shelves unsold
To sell that excess production, firms must lower their prices toward equilibrium
Shortage
if markets sell at a price that is too low, demand is greater than supply
Firms start to realize that buyers are willing to pay more for their goods, so they start raising their prices toward equilibrium
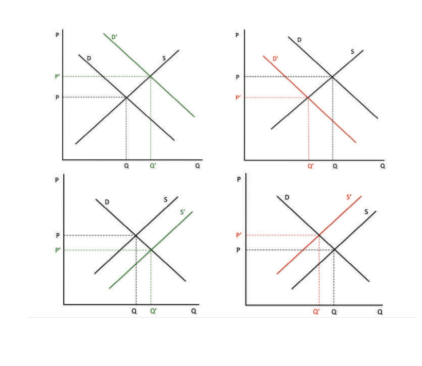
Shifts in Market Demand and Market Supply:
Starting in the upper left-hand corner below, a rightward shift in the demand curve drives up the equilibrium price, causing an increase along the supply curve to our new equilibrium quantity
In the top right corner, a leftward shift in the demand curve drives down the equilibrium price, causing a decrease along the supply curve to our new equilibrium quantity
In the bottom left corner, a rightward shift in the supply curve drives down the equilibrium price, causing an increase along the demand curve to our new equilibrium quantity
In the bottom right corner, a leftward shift in the supply curve drives up the equilibrium price, causing a decrease along the demand curve to our new equilibrium quantity
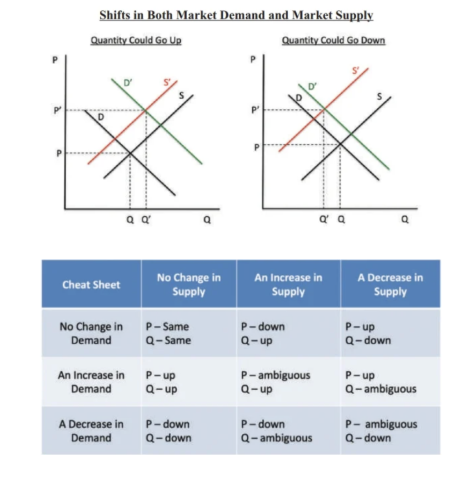
Shifts in Both Market Demand and Market Supply:
In the graphs below, we have two examples of a decrease in supply and an increase in demand occurring at the same time
In both instances, we know that equilibrium prices increase because a leftward shift in supply and a rightward shift in demand both put upward pressure on prices
However, the graph on the left has an increase in the equilibrium quantity while the one on the right has a decrease
These results are due to the magnitude of the shifts in supply versus demand
If the shift in demand is of a larger magnitude than the shift in supply, the equilibrium quantity increases
In the graph on the right, we see the opposite take place with a larger magnitude shift in supply
The size of the shift matters in this instance for the direction of the equilibrium quantity
Market
a market is a group of buyers and sellers of a particular good or service
The buyers as a group determine the demand for the product, and the sellers as a group determine the supply of the product
Three assumptions for markets:
Perfectly competitive
Many buyers, many sellers, identical products, free entry and exit into the market, and all of the firms will be homogeneous (same marginal cost of production)
Buyers and sellers are price takers
At the market price, buyers can buy all they want and sellers can sell all they want