Habitat
The environment in which an organism lives
elephants habitat is grassland
Population
The total number of organisms of the same species living in the same geographical area
Community
The populations of all the different species that live in the same habitat
Biotic and Abiotic
Biotic: All living organisms in an environment
Abiotic: All non-living parts of an environment (including water/minerals in soil)
Ecosystem
Both the biotic and abiotic parts of an environment and how they interact
Resources that organisms compete for
Plants compete for light, space, water and mineral ions in the soil.
Animals compete for food, water, mating partners and territory.
Interdependence
All of the different species in a community depending on each other. If a species disappears from a community then this can affect the whole community.
every animal depends on other living organisms for food (carnivores/herbivores)
some living organisms provide shelter (tree sheltering animals from sun)
plants depending on animals (bees spreading pollen/birds spreading seeds)
Stable community
Populations of the different species remaining fairly constant = in balance with each other and with the abiotic resources
V1 - competition and interdependence
Biotic factors
Availability of food:
food falls = organism number falls
New predator:
prey species falls
effects existing predator if competing for the same prey
Competition between species:
species outcompeted then its population can fall so much = numbers are no longer sufficient to breed = extinct
New pathogens:
infectious disease spreads = wipes out species population
Abiotic factors
Light intensity:
major effect on plants since they all need it for photosynthesis
low LI = rate falls = slow growth = herbivores don’t have enough food
Temp:
temp change = distribution of species change
animals migrate and plant species might disappear from the area
Water:
plants/animals need it to survive
species adapt to low water levels
pH and mineral soil content:
plants can’t grow on too acidic/alkaline soil
certain minerals (nitrate) is needed for amino acids and protein
Wind intensity and direction
strong winds blowing inland from sea = plants lose water
plants in sand dunes adapt to reduce loss
CO2:
needed for photosynthesis = CO2 fall means rate decreases
O2:
needed for aerobic respiration
oxygen level in air stays constant but dissolved oxygen in water can fall on hot days = harmful to aquatic organisms
v2 - Biotic and Abiotic factors
Structural, functional and behavioural adaptations
Structural are adaptations of body shape/structure
Functional are adaptations to the body functions of an organism
Behavioural are adaptations to the animals lifestyle/behaviour
Camel adaptations
Adapted to hot and dry desert conditions.
Structural adaptations:
Hump stores fat
allows heat loss from other body parts = reduces water loss from sweating
metabolic reactions used to make water from fat
Hump and thick coat on body’s upper surface
insulates top from suns heat = reduces water loss from sweating
Leathery mouth
chew thorny desert plants = good water sources
Long eyelashes and can close nostrils
keep dust out of eyes and nose
Wide feet
prevent sinking into sand
Functional adaptations:
Produce concentrated urine and dry faeces
reduce water loss
Tolerate very large body temp changes
cope with deserts intense heat
Kangaroo rat adaptations
Lives in desert - Behavioural:
nocturnal = active at night = avoid daytime heat
during day they live in underground burrows = cool + predator protection
Arctic fox adaptations
Structural
Very thick fur = insulation and reduces heat loss to air
Fur on feet soles = reduces heat loss to ice/snow
Very small ears = reduces SA of fox = reduces heat loss
White coat is camouflage = helps for hunting pray
Cactus adaptations
Adapted to dry desert conditions:
some have very small leaves to reduce water loss
other have no leaves at all, only spines
spines protect cactus from animals
extensive and shallow roots = catch water after rainfall before it evaporates/sinks into ground
store water in stem = survive many months without rain
Extremophiles and example + its adaptations
Organisms adapted to extreme conditions.
On the sea bed, a deep sea vent has bacteria that can:
live in high temp/pressures
live in very high salt concs
v3 - Adaptations
Producer key points
green plant at the start of all food chains
synthesise complex molecules (e.g make glucose by photosynthesis)
source of all biomass in a community:
molecule like glucose is biomass, which is passed down the food chain to other organisms
Primary, secondary and tertiary consumers
primary - organisms that eat producers and are eaten by a secondary consumer
secondary - organism that eats a primary consumer
tertiary - organism that eats a secondary consumer
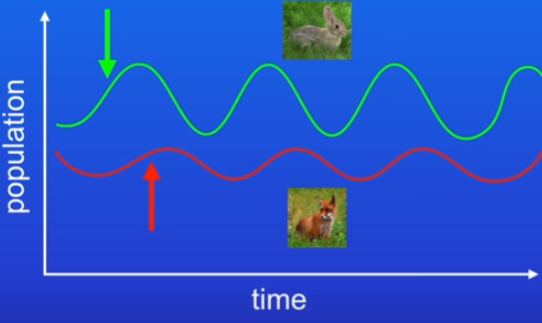
Graph of predator and prey populations in a community explained
Number of (any) predators and (any) prey rise and fall in cycles BUT this is only true in a stable community:
rabbit population may rise due to warm summer with plenty of grass to eat
this means more offspring survive = pop increases
foxes have more rabbits to eat = fox pop also rises
more foxes = more rabbits will be eaten = rabbit population falls
less rabbits = less food for foxes = fox pop falls
more rabbits can survive and reproduce = rabbit pop increases
fox have more food = fox pop rise
If a drought happened or new predator arrived and community is no longer stable, then predator-prey cycles would change.
v4 - Food chains and predator-prey cycles
2 Sampling types and def of sampling
How scientists determine number of organisms in an area:
random sampling
sampling along a transect
Random sampling:
Hypothesis: “fewer ferns are found in light conditions than dark”
Hypothesis = We are comparing the numbers of organisms in different areas using a quadrat:
Measuring ferns in light conditions:
Place quadrat (wooden/plastic square), on the ground at random locations across the area, using random numbers to select the diff locations.
Count the numbers of each organism inside the quadrat.
can be used on plants/slow-moving animals
Move quadrat to a diff random location and repeat step 2.
Repeat till you sampled a large number of random locations.
large number = more likely to get valid results
placed once = doesn’t accurately represent whole area
Measuring ferns in dark conditions:
Repeat experiment
Find that hypothesis is correct - fewer ferns found in light conditions.
Estimate the total population size of a species in an area:
total pop size = total area/area sampled * number of organisms of that species counted in sample
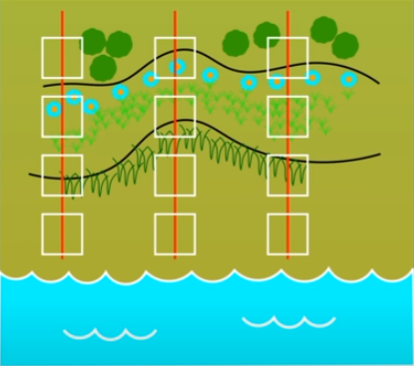
Sampling along a transect:
Hypothesis: “species of plants that we find on a sand-dune change as we move inland from the sea”
Hypothesis: Investigating whether the numbers of species change as we move across a habitat.
Transect is a line like a tape measure/rope, placed so it runs across the habitat
Place tape measure on the dune running from the beach inland.
Place first quadrat at the start of the transect and count diff plants in it.
on beach theres probably no plants
Move quadrat closer inland by a set distance (e.g 2m) and count again. Repeat as we move further inland.
Carry out transect many times for valid results - move tape measure along and repeat the whole process.
v6 - sampling organisms
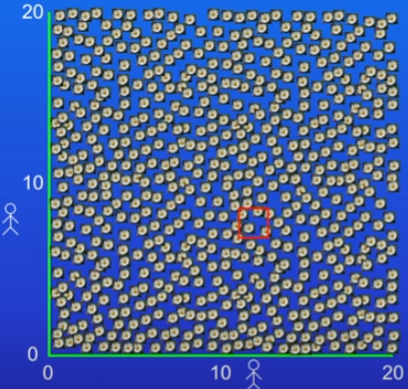
RP9: Sampling organisms - daisy field
Place two 20m tape measures at right angles.
A group of 3 pupils need 2 bags with the numbers 1 to 20.
First pupil removes number from bag. Imagine its 8. Student moves up to 8m point on one of the tape measures.
Second student selects number 12 and moves to 12m on the other tape measure
Third student places a 0.5×0.5m² quadrat on the 8×12m point.
Record number of daisies. Repeat this till you have 10 samples.
imagine they counted 300 daisies across the 10 quadrats
RP9: Estimate total pop of daises in the whole field
Estimate total pop of daises in the whole field:
total pop size = total area/area sampled * number of organisms of that species counted in sample
total area = 20m x 20m = 400m²
area sampled = 0.5 × 0.5 (quadrat) ×10 (times thrown) = 2.5m²
daisies counted = 300
400/2.5 × 300 = 48 000
RP9: Estimate total pop of daises in the whole field - issues
Estimate = may not represent whole area:
might be regions within area with much higher or lower number of daisies than the average.
if we think this is the case, increase the number of throws to cover a greater % of the area
RP9: measure effect of a factor on the distribution of a species
this case we are looking at light intensity effect on daisy distribution
Field of daises containing a tree - use transect line to see how daisy number changes from the tree outwards
Place tape measure at the tree
Use quadrat to count daisy number at the start of the transect and record light intensity at this point - using light metre or an app
Move quadrat 1m down and repeat measurements. Continue all the way down the tape measure.
may see more daisies as you move further from the tree since under the tree theres a lower light intensity and plants need light to photosynthesize
a tree will also absorb a lot of water/minerals from the soil
LI may not be the only abiotic factor affecting daisy count
v6 - RP9: Sampling organisms
Finding mean with anomalous results
anomalous means ones that don’t fit the pattern
these should NOT be included in the mean
Mode of 1, 3, 4, 5, 8, 11
There is no mode - most often appearing number
v7 - Mean, median and mode
Carbon cycle 2 key ideas
Photosynthesis (is the only way that) brings carbon into the cycle
cycle always starts with CO2 in the atmosphere
Aerobic respiration returns carbon back to the atmosphere
every living organism carries out respiration
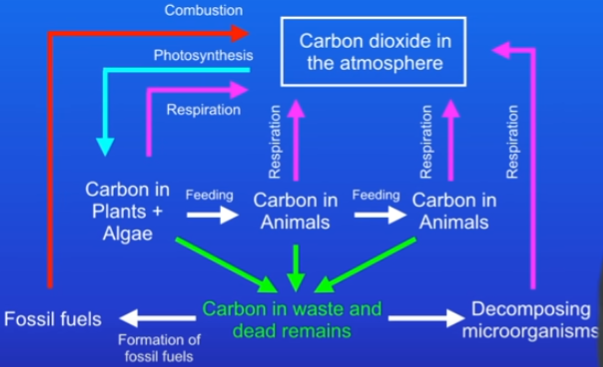
Carbon cycle steps
CO2 in the atmosphere is taken in by plants and algae through photosynthesis
the carbon is used to make carbohydrates, fats and proteins which make up plant and algae
Plants and algae respire, so some carbon is released back to the atmosphere as CO2.
Plants and algae can be eaten by animals. These animals can be eaten by other animals
carbon that was in the plants becomes part of the carbohydrates, fats and proteins in the cells of animals
Animals respire, so some carbon is released back to the atmosphere as CO2.
Animals release waste products like faeces and eventually all animals and plants die.
Now carbon is in waste products and dead remains that are broken down by decomposing microorganisms like bacteria and fungi. When they respire, carbon is returned to the atmosphere as CO2.
Importance of decomposers in the carbon cycle and issues they face
important since they return carbon AND release mineral ions to the soil
under certain conditions (oxygen lack), they can’t function effectively = carbon in dead remains can be slowly converted to fossil fuels
Consequences of decomposers not functioning
overly many millions of years, a large amount of carbon has been trapped underground as fossil fuels
Combusting fossil fuels is releasing a large amount of CO2 back into the atmosphere
v8 - Carbon cycle
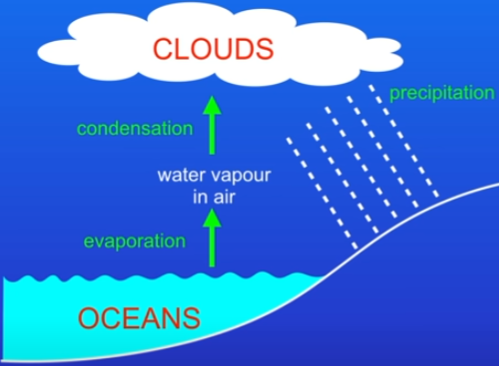
Water cycle in ecosystems
Energy from the sun makes water evaporate from the sea’s surface
Vapour travels into the air and cools down, condensing to form clouds
Water in clouds falls to the ground as precipitation (rain,snow,hail,sleet)
all precipitation forms contain fresh water with no salt contained
When water hits the ground:
some evaporates back to the atmosphere as vapour
some passes through rocks to form aquifers
a lot forms rivers/streams (which eventually drain back to the sea).
Water cycle in living organisms
Plants take up water in their roots - moves up xylem and passes out stomata as vapour = transpiration.
Animals take in water through food/drink - release in urine, faeces and exhalation
v10 - Decomposition
Decomposition by gardeners
Gardeners put dead plant material (like grass) onto the compost heap
Over time, bacteria and fungi decompose the plant material and produce compost.
They use compost as a natural fertiliser since it’s very rich in minerals that plants need to grow.
Optimal conditions for decomposition and important things to consider for each condition (issues)
Warmer temp = happens faster since decomposers use enzymes to break down plant materials. Enzymes work faster in warm conditions.
compost heaps are warm since decomposers release energy when aerobically respiring
if compost gets too hot, enzymes in decomposers can denature and decomposers can die
Water amount = decomposers work faster if compost is moist since many chemical reactions in decay require water
compost heap must not dry out
Oxygen amount = decomposers aerobically respiring which requires good oxygen supply
compost bins have holes in walls to let oxygen enter
gardening forks are used to mix compost regularly so more oxygen passes to centre
mixing compost also breaks up large clumps and increases SA for decomposers to act on
The result of no oxygen in decomposition and its uses
Decomposers will carry out anaerobic respiration
This produces a mixture of gases including methane = “Biogas”
Small-scale biogas generators are used to provide fuel for homes
these often use plant materials from food waste or animal manure
V10 - Decomposition
Decay in milk and why the practical mimicked decay
bacteria in milk start decay process after being left at room temp for days
bacteria use enzymes to produce acidic molecules which is why sour milk tastes acidic
decay is a very slow process so the practical will model decay by using lipase enzyme
results aren’t strictly decay but will be approximately the same as decay
RP10: Decay
In a labelled “lipase” test tube, use pipette to place 5cm³ of lipase solution inside.
In a labelled “milk” test tube, add 5 drops of Cresol red indicator, 5cm³ of milk and 7cm³ of sodium carbonate solution.
solution should be purple since sodium carbonate solution is alkaline and cresol red is purple in alkaline conditions
Place a thermometer into milk test tube, and put both tubes into a beaker of water at our 1st chosen temp. Start with 20C, around room temp.
Wait for our solution temps to be the same as the beaker water.
Use a pipette to transfer 1cm³ of lipase solution to the test tube containing milk and stir. At the same time start a timer.
Lipase will start to break down fat molecules in the milk, which releases fatty acids and causes the milk solution to become acidic.
in acidic conditions, the indicator changes to yellow
Once solution is yellow, stop timing and records the results.
Repeat at a range of diff temps
RP10: Decay Variables
independent - temp
dependent - time taken for milk solution to be yellow
control - volumes of solutions
RP10: Decay - key things to remember
use clean test tube for milk solution for each experiment
any traces of lipase from previous experiments will trigger the reaction before we are ready
since we are looking for colour change, it can be hard to decide when to stop timing
reduce effect of this by sharing data with other groups and calculating a mean
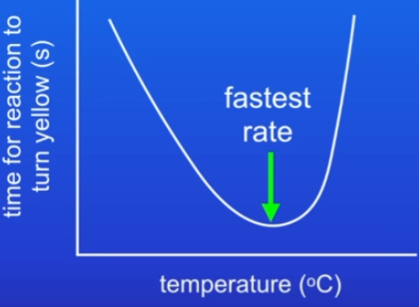
RP10: Decay - graph and results
low temp = slow reaction, since enzymes work slowly at low temp
at certain temp = reaction is taking place at fastest rate = optimum temp
conditions that are warmer than optimum temp = reaction slows down, may stop completely since enzymes denature at higher temps
Results:
Decay: decomposing microorganisms work faster in warm conditions but not in hot conditions, since enzymes denature when temp is too high
v11 - RP10: Decay
How abiotic factor changes can affect species distribution:
the variation type shown through diff fox species
the abiotic factor involved
Temperature showing geographic variation:
North Africa desert fox - adapted to hot desert conditions
large ears increase SA so it loses heat more easily
not found in Europe where conditions are cooler
Europe red fox - adapted to cooler conditions
further north, red fox disappears
Arctic’s arctic fox - adapted to extremely cold conditions around Arctic Circle
very small ears reduce SA so less heat is lost to air
How abiotic factor changes can affect species distribution:
the variation type shown through diff plant species
the abiotic factor involved
Availability of water showing geographic variation:
Cacti found in American desert - adapted to live where water is scarce
Don’t find cacti in regions where water is more plentiful - find plants adapted to wetter conditions like ferns
How abiotic factor changes can affect species distribution:
the variation type shown through wildebeest, bird (swallows), bats migration
the abiotic factor involved
Rainfall patterns showing seasonal variation:
Yearly huge wildebeest numbers migrate across Africa - following rainfall patterns in search of better grazing land
Summer and winter conditions showing seasonal variation:
Swallows (bird type) breed in the UK summer and migrate to Africa’s warm conditions during winter
Millions of bats migrate south from the US, to Mexico in the winter where conditions are warmer
Abiotic factors influenced by human activity, that change species distribution
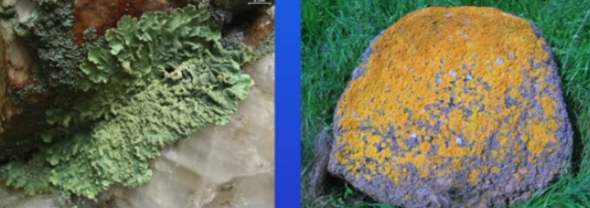
Gases in the atmosphere:
Lichen grows on rocks or trees
They’re very sensitive to sulfur dioxide gas which can be produced by burning fossil fuels
We find larger numbers of lichens where air is unpolluted
Levels of gases dissolved in water:
if sewage is allowed into steams, this can cause dissolved oxygen levels to drop
organisms like mayfly nymphs can’t live in low oxygen conditions = populations of these species can fall
V12 - Environmental Change
Biodiversity
The variety of all the different species of organisms on earth
Biodiversity importance
species depend on each other for food and shelter
species help maintain the environment - decomposers breaking down dead organisms
High Biodiversity
lots of different species = ecosystem is less dependent on 1 species
if population of one species falls, its less likely to affect the whole ecosystem
therefore makes an ecosystem more stable
Humans effect on Biodiversity and why we do this
Negative effect - deforestation:
tropical forests contain rich biodiversity
large areas are being destroyed to provide land for:
rice fields
grazing cattle
land used for crops, which are then used to make biofuels
Due to the reduction in habitats, (for farms, airports etc) this reduces biodiversity.
v13 - Biodiversity
Why are earths resources used more than ever before in recent years and what does this lead to
last hundred years, population of humans has increased massively
average standard of living has increased
These produce more waste, leading to pollution
How waste leads to pollution of water
Sewage:
we make a large amount of sewage (urine and faeces)
some countries release this into nearby waterways
UK sewage is treated before released - but sometimes untreated sewage is accidentally released into rivers/streams
Fertilisers:
river and streams can be polluted by this from farms
Both fertilisers and untreated sewage can cause dissolved oxygen levels to fall, killing aquatic organisms
Toxic chemicals:
released into rivers from factories - kills river animals
REDUCED BIODIVERSITY
How waste leads to pollution of air
Burning coal in Power stations:
acidic gases - cause acid rain
smoke - kill plants and animals
REDUCED BIODIVERSITY
How waste leads to pollution of land
Landfills:
millions of tons of waste dumped in these - destroy plant and animal habitats
toxic chemicals can leach out of landfills - pollute the soil
toxic chemicals are dumped directly on the land - kill living organisms
REDUCED BIODIVERSITY
v14 - waste management
Peat bogs/lands def and conditions
Contain large amounts of dead plant materials
Their conditions make decay very slow so they contain a lot of trapped carbon
Peat bog uses and the issues of uses
These habitats are being destroyed = reduces the area of this habitat
This reduces the variety of animals, plants and microorganisms that live there = reducing biodiversity
Once peat is extracted and used for cheap compost in farms, it begins to decay
releases a lot of CO2
Some countries burn peat for energy (electricity)
releases CO2, contributing to climate change
Issues with alternatives of peat bog compost
more expensive
peat-free compost may increase the price of food
v15 - land use
Global warming and unnatural GW explanation
Last hundred years, earths average temp is increasing
It’s changed many times in the past from natural changes in the climate, but scientists believe the current increase is caused by human activities
Gases in global warming
Many decades humans have released huge CO2 amounts into atmosphere
mainly due to burning fossil fuels
Methane levels also increased
produced by bacteria in paddy fields, used to grow rice
released by cows passing gas
Both are greenhouse gases = they trap heat in atmosphere = leading to GW
Peer review and the media on GW
Thousand scientific papers have been published on GW
These have been checked by other scientists before publishing (peer review)
Peer review detects false claims and checks research validity
Popular media reports (newspapers) aren’t subject to peer review = GW reports can be oversimplified, inaccurate or biased
How GW (global warming) affects animals and plants
Loss of habitats:
reduction in arctic ice levels = population of arctic organisms (polar bears) fall since habitat is smaller
Birds/insects may extend their range north to cooler conditions
many mosquito species carry diseases that affect humans (malaria)
currently can’t survive UK cold
GW - malaria insect range may spread to UK
Other:
animal migration patterns of many may change
spring plants in UK flower earlier due to warmth
Growing crops:
in future may grow crops like grapes in the UK (where we can’t today)
other parts of the world it may be too hot to grow necessary crops
v16 - Global warming
Reducing negative effects of humans on biodiversity
Breeding programmes for many endangered species
Protection and regeneration of rare habitats
Field margins and hedgerows on farmer fields
Governments less deforestation/co2
Individuals recycling
Reducing negative effects of humans on biodiversity
Breeding programmes for many endangered species
increase Sumatran tiger numbers by zoos lead them to other zoos hoping they’ll breed
Reducing negative effects of humans on biodiversity
Protection and regeneration of rare habitats
Wetlands have high biodiversity - many are drained to grow crops - being protected or reflooded
Reducing negative effects of humans on biodiversity
Field margins and hedgerows on farmer fields
biodiversity is low since 1 crop is used for a huge field = no variety in species
field margins - strips of land around fields so wild animals/plants can live
hedgerows planted between fields since many diff plant/animal species live in them
both preserve biodiversity on farms
Reducing negative effects of humans on biodiversity
Governments
Brazilian gov established national parks to protect the Amazon
Govs reduce CO2 emissions by using renewable energy - UK electricity is a large % from windfarms
reducing deforestation and co2 emissions can reduce loss of biodiversity
Reducing negative effects of humans on biodiversity
Individuals
recycling waste materials - lots are dumped in landfills which destroy habitats
recycling means less waste is in landfills = less habitats are destroyed
positive effect on biodiversity
v17 - maintaining biodiversity
Trophic levels
Positions on a food chain:
Level 1 are producers
Primary consumers
Secondary consumers
Tertiary consumers
Apex predator
Carnivores with no predators - aren’t killed and eaten by other animals.
What decomposers carry out and how?
Break down dead plants, animals and waste products like faeces
by this, they return mineral ions back to the soil
Carry this out by secreting (release) enzymes into the environment
Enzymes digest dead materials
Small soluble food molecules then diffuse back into the decomposer
v18 - trophic levels
Biomass
A measure of the total mass of living material in each trophic level.
It’s the living tissue of an organism, including proteins, lipids and carbs.
Calculating biomass of caterpillars in a food chain
collect all caterpillars in an area and kill them
dry them and weigh them = dry biomass
Is dry or wet biomass more useful
dry - moisture content of organisms can vary widely and produce inaccurate results
How to avoid killing animals for biomass
look up data needed in scientific journals
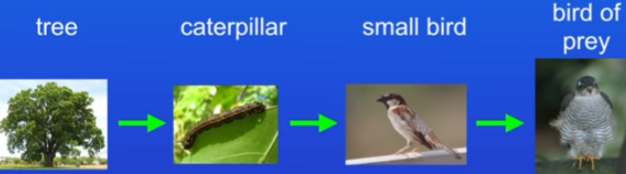
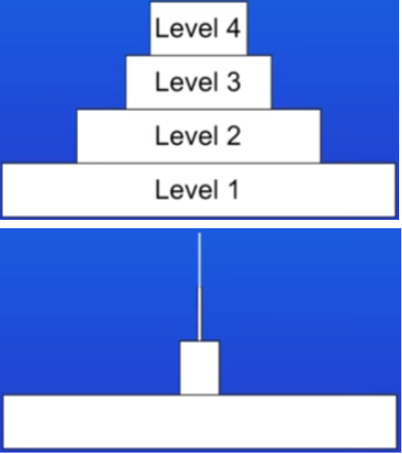
Pyramid of biomass def, example using the given food chain and explanation of levels
Represents trophic levels of a food chain. Biomass amount decreases for each level.
Level 1 - Producer (tree)
Level 2 - Primary consumer (caterpillar)
Level 3 - Secondary consumer (small bird)
Level 4 - Tertiary consumer (bird of prey)
Realistic pyramid shows that only 10% of biomass at one level passes to the next, so the number of organisms at each level decreases. Theres very few food chains with a large number of different trophic levels.
Why biomass amount decreases for each trophic level
not all material ingested by bird is absorbed, some is egested as faeces
some biomass absorbed is converted into waste products of metabolism and is released (e.g humans urea)
large amount of biomass is used by the bird for respiration to release energy
energy is important for movement, and in the case of mammals and birds, maintaining constant body temp
some is used for producing waste compounds from respiration (CO2 or H2O)
How much light energy is used by producers
1% that falls on producers is actually absorbed and used for photosynthesis
Efficiency of biomass transfer eq.
efficiency = gain in biomass/total biomass intake = d.p or x 100 for %
v19 - pyramids of biomass
Food security
Having enough food to feed a population
very important as more live in cities and less grow their own food
as pop increases we must find sustainable methods to feed everyone
6 biological threats to food security
Birth rate is increasing
Changing tastes
New pests/pathogens
Environmental change
Resources
Conflicts
biological threats to food security - Birth rate explained
Birth rate is increasing - pop growth means the food available will have to increase to feed everyone