Chapter 3 - The Nature-Nurture Debate
1/24
There's no tags or description
Looks like no tags are added yet.
Name | Mastery | Learn | Test | Matching | Spaced | Call with Kai |
|---|
No study sessions yet.
25 Terms
precocial / altricial
refer to species where the young differ in their degree of maturity when they hatch or are born:
precocial species: the young are physically mobile and able from the moment of birth or hatching; imprint on their siblings/mother, still require some parental support;
superprecocial species: the young receive no parental support and they have no need for environmental input;
altricial species: the young are incapable of moving around on their own and are dependent on their parents for food and safety for some time after hatching/birth;
nativism / empiricism
nativism: the view that many skills or abilities are ‘native’ or hard wired into the brain at birth, the result of genetic inheritance
empiricism: the view that humans are not born with built-in ‘core knowledge’ or mental content and that all knowledge results from learning and experience
Most authors see development as a mix of both nativism and empiricism: Spelke and Kinzler offer the reasonable view that ‘central and abstract concepts emerge in the human mind through a mix of innate concepts that are shaped by natural selection, and learning that is shaped by specific encounters with the objects to be learned’.
MA and IQ
mental age (MA) = an individual’s level of mental ability relative to others
William Stern introduced the term intelligence quotient (IQ), and in its original formulation it was simply calculated as a child’s MA divided by the child’s CA (chronological age) multiplied by 100.
The purpose of IQ tests is always to compare people’s (children’s or adults’) scores with those from people of the same population and of approximately the same age.
The average IQ at a given time is always 100.
To ensure this it means that tests are carefully standardised every few years to ensure that the population varies around this mean. This means that test makers provide a conversion chart so that an individual’s raw score (i.e. the number of items passed) can be expressed as an IQ score.
Children’s and adults’ raw scores tend to increase from one generation to the next (known as the Flynn effect), hence the need for regular standardisation of tests.
The items on IQ tests invariably proceed from the simple to the complex, so that an individual’s raw score (and hence their IQ) is derived from the number of items passed before they make mistakes.

g
The concepts of mental age and IQ suggest that intelligence is a single general ability, and there are those who argue that a general intelligence ability (often referred to simply as ‘g’) underlies performance on all intelligence tests.
Others suggest that intelligence is made up of a number of specific abilities or subskills.
Still others have argued that performance on intelligence tests is unrelated to our ability to ‘live our lives intelligently’. Research done on 30 ‘avid racetrack patrons’ for their ability to use a multiplicative model to handicap races. No correlation was found between ability and IQ. → IQ is unrelated to real-world forms of cognitive complexity.
how IQ tests measure intelligence
Many tests divide intelligence into two broad abilities, verbal and performance subscales:
Verbal subscales:
Similarities: The child is asked to say in what way things might be similar (‘In what ways do blue, green and yellow go together?’)
Comprehension: This subscale measures the child’s common sense and understanding (‘Why do people need to pay taxes?’)
Recall of digits: The tester reads out sequences of digits and after each sequence the child calls it back. For example: ‘6 – 9 – 4’ and later ‘4 – 7 – 8 – 5 – 1 – 7 – 2 – 4 – 8 – 3.’ The average digit span for adults is about seven items (so very few people would give perfect recall of the second list of digits), and it increases during childhood.
this item is given under ‘verbal’ subscales because it correlates better with verbal rather than performance.
Performance subscales:
Block design: The child is given a set of blocks with coloured patterns on them, then asked to use them to make patterns that the tester shows;
Copying: The child is shown a drawing and asked to copy it on a sheet of paper. Drawings are initially simple, progressively get more complex.
heritability
a statistical measure that describes how much of the variation of a trait in a population is due to genetic differences (rather than environmental differences) in that population.
Heritability estimates refer to a population, and tells us nothing about individuals.
A heritability of, for example, .50 informs us that, on average, about 50 per cent of the individual differences that we observe in intelligence may be attributable to genetic differences between the individuals in that population.
It does not mean that 50 per cent of any person’s intelligence is due to their genes and the other 50 per cent is due to their environment.
genes & environment: additive or interactive?
Genes and environment are not additive, in the sense that x per cent of intelligence is caused by genes and y per cent by the environment.
Rather, they interact with each other in causing the development of all human characteristics, including intelligence
genetic determinism / environmentalism
genetic determinism: the hypothesis that people become who they are as a consequence of their genetic inheritance.
If heritability is high, then some racial groups and classes of children who score poorly, on average, on IQ tests might be thought to do so for reasons that are primarily of genetic origin.
environmentalism: the hypothesis that people become who they are as a consequence of the learning and experiences they have had throughout life.
If heritability is low, these differences in IQ scores may be primarily environmentally determined and it becomes important to enhance the cognitive environment of the disadvantaged in order to provide an intellectually stimulating environment.
familial resemblance
= the resemblance between relatives whose genetic relationship to each other is known.
One type of evidence concerning genetic influences to cognitive development is from the relatedness, or similarity, of IQs between individuals who have various degrees of familial resemblance, from highly related people (identical twins) to unrelated individuals (complete strangers).
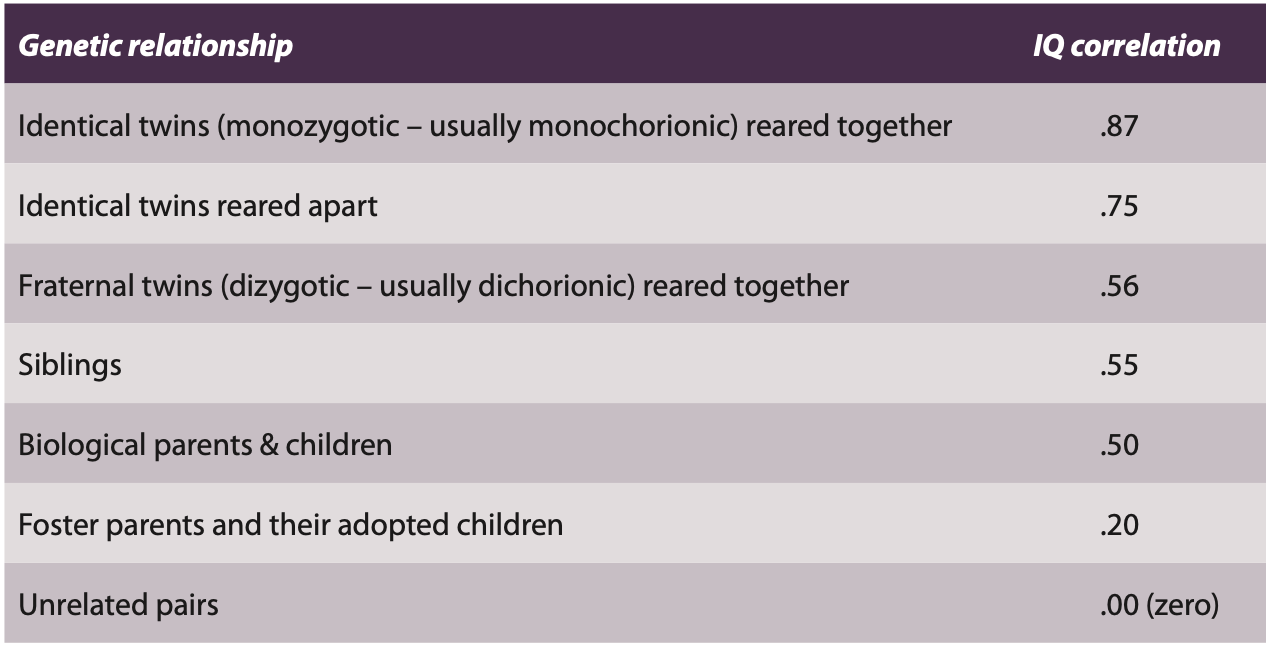
twins
monozygotic/identical twins: share all of their genes;
dizygotic/fraternal twins: share half of their genes;
parent/child: share half of their genes;
siblings: share around half of their genes;
The correlation of IQ between pairs of identical twins reared together is around 0.87 – this is the level of correlation one would expect if the same individuals took alternative versions of the same IQ test around the same time.
The correlation of IQ between pairs of identical twins reared apart is also high – 0.75. This might actually not be because of heritability, but because many of these ‘reared apart’ twins actually had very similar environments.
the ‘missing heritability’ problem.
= the failure to find any of the genes associated with cognitive abilities.
‘At present we have not yet identified a single gene locus robustly associated with normal range cognitive ability test scores.’
Nevertheless, it is commonly agreed that intelligence has a strong genetic component and it is thought that its heritability increases with the individual’s age:
‘The heritability of intelligence increases from about 20% in infancy to perhaps 80% in later adulthood’.
Recent estimates suggest that heritability of IQ averages around 0.5, meaning that 50% of the variation in IQ observed in a given population is accounted for by genetic differences.
gene x environment interaction (GxE)
genotype = an individual’s inherited genetic makeup;
phenotype = the interaction of genetic and environmental influences to create an individual’s physical appearance and behaviour:
genotype and environment interactions (GE) → phenotype (P).
a gene × environment interaction (G×E) is when different genotypes respond to similar environmental factors in different ways to create an individual’s phenotype.
GxE: Phenylketonuria (PKU)
Phenylketonuria (PKU): a rare genetic mutation
occurring in approximately 1 in 10,000 births, in which
the body is unable to break down a substance called phenylalanine, which therefore builds up in the blood and brain.
disturbs brain development and, if left untreated, results in severe mental r*tardation and learning difficulties.
In developed countries this is tested for soon after birth, with a blood spot (heel-prick) test, and newborns found to have high levels of phenylalanine in the blood can be put on a phenylalanine-free diet and these children can avoid the severe effects of PKU.
This is an example showing that a change in the environment, i.e. a phenylalanine-free diet, can affect the development of a particular trait (mental r*tardation), thus demonstrating a gene-environment interaction.
GxE: Chronic obstructive pulmonary disease (COPD)
It is common knowledge that smoking is a serious risk to health and approximately half of all long-term smokers will die prematurely due to a smoking-related disease. One such disease is chronic obstructive pulmonary disease (COPD).
COPD: a collection of lung disorders such as emphysema and bronchitis.
People with COPD have difficulties breathing because of airflow obstruction, primarily due to the narrowing of their airways.
The main cause of COPD is smoking; the likelihood of developing COPD increases the more you smoke and the longer you’ve been smoking.
There are a few lucky smokers who live to an old age apparently unaffected by years of smoke inhalation. Some part of their longevity results from their genetic makeup, or genome.
A study by a group of scientists found that genetic factors were associated with causes of lung health and disease, such that some smokers with certain DNA profiles had a higher risk of COPD, while others had a lower risk of COPD even though they were smokers.
However, they found that there were other DNA profiles that had a higher risk of COPD, which likely accounts for those few unlucky individuals who develop the disease despite never having smoked.
GxE: breastfeeding and IQ
It is known that breastfed children are healthier and develop higher IQs than bottlefed children, most likely because of the fatty acids uniquely present in breast milk.
fatty acids = the building blocks of the fat in our bodies and in the food we eat. They have many important functions in the body, including energy storage.
It has been reported that a variant in a single gene that is involved in the genetic control of fatty acid pathways, which has been linked to brain development, will affect children’s IQs: if the children have this variant of the gene they score seven points higher in IQ tests, whereas breastfeeding had no effect on the IQ of children with a different version of the gene.
Skeels’ study (Ohio orphanage)
Children raised in an overcrowded orphanage in Ohio, limited stimulation and human interactions. Two little 13-16 month old girls were judged to have developmental levels of 6-7 months. They were transferred to an institute for the mentally r*tarded, where they received affection, individual care and attention, and stimulation.
Six months after their transfer an improvement was noticed, then taken back to the orphanage and placed in adoptive homes.
11 other children were transfered to the institute, then adopted.
30 years later, many of the contrast group who remained in the orphanage had occupations correlated with individuals with low IQs, whereas those in the experimental group had ‘normal’ jobs, not encumbered by an institutional upbringing.
Although this early study was not, and was not intended to be, a controlled experiment, the message it conveys is that an early deprived upbringing can have serious detrimental effects on children’s development, and that these detrimental effects can be ameliorated, at least in part, by placement into good quality adoptive homes.
Romanian adoptees
Many children from Romanian orphanages were adopted by people in the UK.
Early exposure of a year or 2 to a substandard institution is related to higher than expected rates of a variety of long-term neurological, physical, cognitive, and behavioral deficiencies and problems, even if the children are subsequently reared in advantaged families.
Childrens’ psychological and cognitive problems were directly proportional to the amount of time the children spent in the orphanages, and the effects didn’t recede with time.
One group of children who have been assessed at 4, 6, 11 and 15 years, two control groups (a group of within-UK adopted children who, prior to adoption, had not experienced a deprived background, and a small group of children from Romania who entered the UK after the age of 6 months, but had not experienced institutional rearing).
For those who came to the UK when under 6 months of age the catch-up was complete in that there were no differences in cognitive ability when compared with two control groups.
Those institutionalised Romanian adoptees who were over 6 months at the time of adoption, although they showed signs of developmental catch-up, had cognitive levels that were well below those of the comparison groups.
The developmental catch-up experienced by the previously institutionalised children was a result of the radical improvement in rearing conditions. This catch-up is an example of environmental drift, that is development shifts in the direction of the changing environment.
long-term differences in Romanian adoptees
Differences are long term and have been found in the subsequent assessments, and in late childhood and adolescence four deprivation-specific patterns are associated with those children who were over 6 months at the time of adoption:
Quasi-autistic symptoms, characterised by ‘intense circumscribed interests and abnormal preoccupations’, which are associated with deficits in theory of mind.
Disinhibited social engagement, characterised by a marked disregard for social boundaries, together with an undue familiarity with strangers and a willingness to walk off with strangers and/or to walk away from the caregiver, and to ask inappropriate questions of strangers.
Inattention/overactivity, which shares many features with Attention Deficit Hyperactivity Disorder (ADHD).
Cognitive impairment. The cognitive levels of those children under 6 months at the time of adoption were in the average range, and comparable to a sample of within-UK adoptees. However, those Romanian adoptees who were adopted over the age of 6 months had a mean IQ that averaged some 15 points below the under 6-month group, and this intellectual impairment continued over time.
unskilled workers children IQ study
Schiff, Duyme, Dumaret and Tomkewicz (1982) examined 32 children who had been abandoned at birth and were adopted below 6 months of age (average approximately 4 months) by upper middle-class families, the parents of whom averaged around IQs of 110. The children’s biological parents were both unskilled workers, and at the time of the study 20 of the mothers had at least one other child of school age whom they had not abandoned: most of these 39 children had different biological fathers from the adopted children.
Results:
IQs of adult unskilled workers average around 95;
the IQs of the ‘control’ full- or half-siblings (aged between 6 and 14 years) also averaged 95;
the IQs of the adopted children (aged between 6 and 13 years) were above average with a mean of 109;
some 14 IQ points above the controls, and hence presumably well above what they would have achieved had they been reared in their biological homes.
→ a refutation to the suggestion that cognitive development is largely under genetic control
SES-IQ adoption study
Duyme, Dumaret and Tomkewicz (1999) selected 65 adopted children who, prior to adoption had been neglected and/or abused and had been removed from their biological family by court order.
In the year prior to adoption their ‘borderline’ IQs were all below 86, and averaged 77.
At the time of adoption the children were aged between 4 and 6 years and they were placed in adoptive families with low, middle, or high socioeconomic status (SES).
When they were subsequently tested in adolescence at a mean age of 13.5 years each of the three SES groups had higher IQs than pre-adoption, the means being related to the SES of the adoptive families: Those with low, medium and high SES were, respectively, 85, 92 and 98.
Clearly, this study demonstrates the effects of a complete environmental change on the children’s IQs, the gains being strongly related to the SES of the adoptive families.
the Flynn effect
= an increase in the average intelligence quotient (IQ) test scores over generations.
a clear example of environmental effects on cognitive development.
IQ scores in Western societies have been rising at an average rate of three IQ points per decade since 1932
possible causes:
reduction in family size → children get more parental input;
improvements in education;
improvements in diet;
increasing complexities of modern societies (technology).
clearly environmental, cannot be genetic because genetic changes take many generations to have an effect.
Raven’s Progressive Matrices (RPM)
= a culture-free non-verbal intelligence test with items arranged in order of difficulty.
poverty
absolute poverty: limited access to food and/or clean water;
relative poverty: households which earn 60% or less than the median income;
It is common for children living in poverty to have an inadequate diet, and to experience poor health, underachievement at school, and have limited opportunities to fulfil their potential.
Research with non-human animals, typically rats, where the environment can be precisely controlled, has established that environmental variations will affect brain development and cognitive functions both positively and negatively – a highly stimulating and nurturant environment facilitates brain growth while a limited non-nurturant environment inhibits it.
Hair, Hanson, Wolfe, and Pollak (2015), using structural magnetic resonance imaging (sMRI) brain scans of 385 economically diverse and typically developing children aged 4 to 22 years, tested to see whether differences in structural brain development might mediate the relationship between poverty and impaired academic performance.
→ ‘Children from families with limited financial resources displayed systematic structural differences in the frontal lobe, temporal lobe, and hippocampus’, brain areas are associated with cognitive performance and scholastic success.
The longer children live in poverty, the greater their academic deficits. These patterns persist to adulthood, contributing to lifetime-reduced occupational attainment.
Head Start (US)
Compensatory education offers supplementary programmes or services designed to help children at risk of cognitive impairment and low educational achievement succeed.
Head Start’s aim was, and is, to help break the cycle of poverty of low-income children from birth to age 5 (prior to formal schooling), providing the children with a comprehensive programme to support their cognitive, social, nutritional and emotional needs, and also to support parents and engender positive parent–child relationships.
→ it seemed that children enrolled in Head Start had an increase of around 10 IQ points, but that shortly after enrolling in school, and when Head Start stopped, these advantages soon disappeared and the children’s IQ levels reduced to the levels that they would have been if they had not had the early Head Start experience.
Whether or not the cognitive gains last depends on whether teachers and parents respond to the initial changes in the children’s behaviour and performance, and that parental involvement in their children’s education and development is a particularly important factor.
Positive benefits of Head Start:
Reduced numbers of US children had to repeat a grade/year.
Fewer children were placed in special education classes or classified as learning disabled.
Teachers rated the children more positively on attitudes to teaching and learning
The children had higher self-esteem and self-efficacy.
In later life they were less likely to get into trouble with the police.
Sure Start (UK)
has the aim of ‘giving children the best possible start in life’ by providing play sessions for children, family support with advice on parenting, guidance on health and nutrition, speech and language therapy, and access to specialist support services.
Teaching improved parenting skills and had great benefits in reducing problem behaviour in young children + decreased rates of severely injured children. Parents were taught to:
Increase positive child behaviour through praise and incentives.
Improve parent-child interaction: relationship building.
Set clear expectations: limit setting and non-aversive management strategies for non-compliance.
Apply consistent gentle consequences for problem behaviour.
Haters said: “the benefits of Sure Start were limited, small and were associated with the degree of social deprivation, so that the effects were beneficial for non-teenage mothers, but were negative for teenage mothers and children of parent(s) who did not work”.
But in the end conclusions were positive.