Finals - Long Quiz (Data Visualization and Reports in Power BI workshop)
1/20
There's no tags or description
Looks like no tags are added yet.
Name | Mastery | Learn | Test | Matching | Spaced | Call with Kai |
|---|
No analytics yet
Send a link to your students to track their progress
21 Terms
In the module, what are you expected to do as the Chief Marketing Officer of VanArsdel, Ltd.?
Create a full Power BI report with conditional formatting, a logo in the filter, and a custom theme
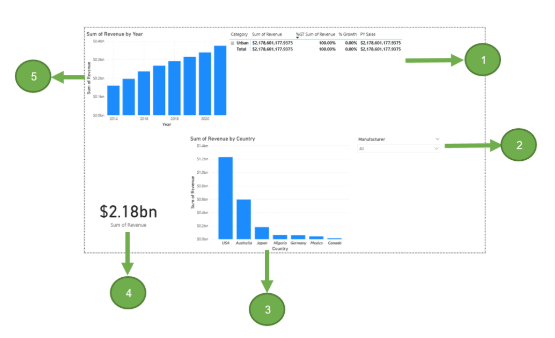
Choose the best matching answers that correctly pair each visual with its name. What is number 1?
Matrix

Choose the best matching answers that correctly pair each visual with its name. What is number 2?
Slicer

Choose the best matching answers that correctly pair each visual with its name. What is number 3?
Stacked Column Chart

Choose the best matching answers that correctly pair each visual with its name. What is number 4?
Card
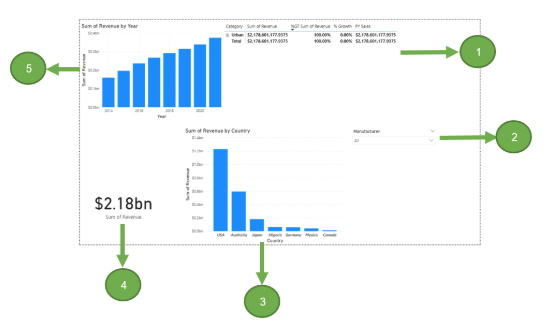
Choose the best matching answers that correctly pair each visual with its name. What is number 5?
Clustered Column Chart
Choose the answers that best match the correct sequence for adding a logo. Answer #2
Check that the Manufacturer slicer visual is still selected. From the Data pane, select the Logo field from the Manufacturer table.
__________________________
Then, select Image URL. Setting the data category property to Image URL helps Power BI understand that the data in this field is a URL so it can render the image in the report.
___________________________
Select the X to the right of the Manufacturer field in the box so that the Logo field replaces it
Resize and move the visuals as needed.
____________________________
Select the Sum of Revenue by Year visual
____________________________
____________________________
From the ribbon, select the Column tools tab and choose the Data Category drop down.
Choose the answers that best match the correct sequence for adding a logo. Answer #4
Check that the Manufacturer slicer visual is still selected. From the Data pane, select the Logo field from the Manufacturer table.
__________________________
Then, select Image URL. Setting the data category property to Image URL helps Power BI understand that the data in this field is a URL so it can render the image in the report.
___________________________
Select the X to the right of the Manufacturer field in the box so that the Logo field replaces it
Resize and move the visuals as needed.
____________________________
Select the Sum of Revenue by Year visual
____________________________
____________________________
With the Slicer visual selected, drag and drop the Logo field from the Manufacturer table to below the Manufacturer column in the Field box in the Visualizations pane.
Choose the answers that best match the correct sequence for adding a logo. Answer #7
Check that the Manufacturer slicer visual is still selected. From the Data pane, select the Logo field from the Manufacturer table.
__________________________
Then, select Image URL. Setting the data category property to Image URL helps Power BI understand that the data in this field is a URL so it can render the image in the report.
___________________________
Select the X to the right of the Manufacturer field in the box so that the Logo field replaces it
Resize and move the visuals as needed.
____________________________
Select the Sum of Revenue by Year visual
____________________________
____________________________
Select the VanArsdel, Ltd. logo in the Manufacturer slicer visual to filter all the other visuals.
Choose the answers that best match the correct sequence for adding a logo. Answer #9
Check that the Manufacturer slicer visual is still selected. From the Data pane, select the Logo field from the Manufacturer table.
__________________________
Then, select Image URL. Setting the data category property to Image URL helps Power BI understand that the data in this field is a URL so it can render the image in the report.
___________________________
Select the X to the right of the Manufacturer field in the box so that the Logo field replaces it
Resize and move the visuals as needed.
____________________________
Select the Sum of Revenue by Year visual
____________________________
____________________________
From the Visualizations pane, select the Line and clustered column chart to change the visual type.
Choose the answers that best match the correct sequence for adding a logo. Answer #10
Check that the Manufacturer slicer visual is still selected. From the Data pane, select the Logo field from the Manufacturer table.
__________________________
Then, select Image URL. Setting the data category property to Image URL helps Power BI understand that the data in this field is a URL so it can render the image in the report.
___________________________
Select the X to the right of the Manufacturer field in the box so that the Logo field replaces it
Resize and move the visuals as needed.
____________________________
Select the Sum of Revenue by Year visual
____________________________
____________________________
Finally, from the Data pane, drag and drop the % Growth field from the Sales table to the Line y-axis box.
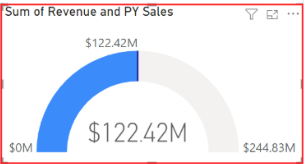
Given the ff. Gauge visual, which fields from the Data pane were used?
PY Sales and Sum of Revenue
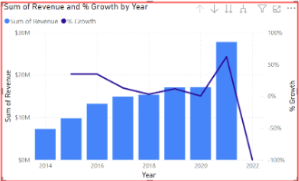
Which visual is shown below?
Line and clustered column chart

Which ribbon tab displays the Themes menu below?
View
Which visualization is shown below?
Slicer

What is the name of the arrow outlined in red?
Drill up

Since based on the below visualization, 2022 has no Revenue value, which menu option (outlined in red) should be used to remove it?
Exclude

What is the name of the Custom Visual shown below?
Play Axis

What is the name of the icon (outlined in red).
Spotlight

What visualization is marked with a red outline?
column chart
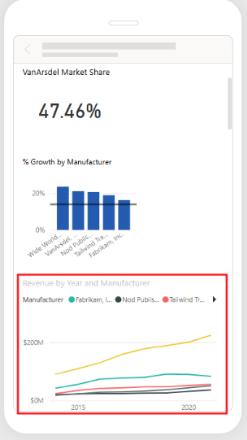
What visualization is marked with a red outline?
line chart