finding and appraising evidence for diagnostic tests and clinical measures
1/60
There's no tags or description
Looks like no tags are added yet.
Name | Mastery | Learn | Test | Matching | Spaced | Call with Kai |
|---|
No study sessions yet.
61 Terms
diagnostic tests
“special tests”: clincial examination techniques
tests performed and/or interpreted by others (ex. radiographs, labs)
measures
techniques we perform to quantify a pts impairment, activity limitation, or participation restriction
index test
new test or tool that researchers evaluate for diagnostic accuracy as per a specific condition
reference standard
current best available method for diagnosing a condition
used as a benchmark for the index test
gold standard
ultimate standard
best when this is ref standard
prospective design without randomization
consecutive pts who meet eligibility criteria are recruited
participants may or may not have target condition
all participants receive index test and ref standard
results from index and ref are determiend
prospective design w/ randomization
consecutive pts who meet eligibility criteria are recruited
participants may or may not have target condition
random assignment assigns participants to index, all receive same ref standard
results from each index and ref standard are determined
case control
pts who meet eligibility criteria and are known to have or not have target condition are recruited
all participants receive index test and same ref standard
results from index test and ref standard are determined
rater reliability
are ppl conducting the measurements achieving consistent measures?
types: intra (within) and interrater (between)
test reliability
given no real change, are measures stable over time?
type: test-retest
ex. ppl answering survey of pt satisfaction respond similarly when given same survey 2 weeks apart
equivalence reliability
do different measurement techniques of the same phenomenon provide equivalent results?
type: parallel (alternate)
ex. spanish translation of a test of items to diagnose dementia provide same results as original english
internal consistency reliability
do all items or components of measurement technique provide info about phenomenon?
type: split half reliability, item reliability
split half reliability example
correlation btwn scores on the even and odds item on a pt questionnaire of self-perception of health is high
item reliability example
each item on a pt questionnaire of self-perception of health correlates highly w/ total scorecard
nominal data statistics
percent agreement
kappa (k)
ordinal data statistics
percent agreement
weighted kappa (kw)
interval ratio data statistics
percent agreement
intraclass correlation coefficient (ICC)
percent agreement
values range from 0 to 100% (higher values=more agreeemnt)
influenced by prevalence
does not remove chance agreement (values inflated)
cannot determine probalbity (p value) of % agreement or confidence intervals
kappa (k)
values range from -1.0-1.0 (higher values=more agreement; negative values=worse than chance)
removes chance agreement (values are not inflated due to chance agreement)
influenced by prevalence
can determine probability (p value) of kappa and CIs
weighted kappa
values range from -1.0 and 1.0 (higher values indicate more agreement; negative values indicate agreement worse than chance)
removes chance agreement (values are not inflated due to ^)
can determine probability (p value) of kappa and CIs
intraclass correlation coefficient (ICC)
can examine where sources of error arise (raters, subjects)
3 models, each w/ 2 types
higher values=more agreement (1.0=perfect; 0.0 and negative=no agreement)
can have more than 2 raters and unequal observations
infl. by range of measures
role of chance agreement
can determine probability (p value) of ICC and CIs
face validity
tool or method of measurement appears appropriate for the stated purpose
assessment is subjective rather than statistical
construct validity
a phenomenon (ex. QoL) may have several aspects (domains, facets)—all domains must be measured
constructs not typically measured directly, can be assessed statistically and by other types of validity
content validity
for each domain of a phenomenon, items/content are developed to assess that domain
experts are asked if items adequately represent domain, if items are clear
criterion related validity
results of new test or measure are compared to a criterion
concurrent validity
new test/measure is given close in time to a well-established test or measure of same phenomenon
correlation coefficients are often used to assess concurrent validity
predictive validity
predictions based on measurements or scores from the new test are used to make predictions of a future behavior or outcome
sensitivity
ability of the test to correctly identify (+ test result/true positive) in someone with the disorder
formula: patients w/ disorder who test positive/all pts with disorder
specificity
ability of the test to correctly identify (- test result/true negative) in someone without the disorder
formula: pts w/o disorder who test negative/all pts without disorder
positive predictive value (PPV)
ability of the test to correctly determine % of people with disorder from all of the people w/ positive test results
formula: pts w disorder who test positive/all pts who test positive
negative predictive value (NPV)
ability of the test to correctly determine % of people without the disorder from all of the people with a negative test result
formula: pts w/o disorder who test negative/all pts who test negative
positive likelihood ratio (LR+)
likelihood that a positive test result was observed in a person with the disorder vs. a person without disorder of interest
probability of identifying true positive
formula: sensitivity/1-specificity
negative likelihood ratio (LR-)
likelihood that a negative test result is observed in a person with the disorder vs. in a person without the disorder of interest
probability of identifying true negatives
formula: 1-sensitivity/specificity
likelihood ratio
combines both sensitivity and specificity into a single measure of diagnostic performance
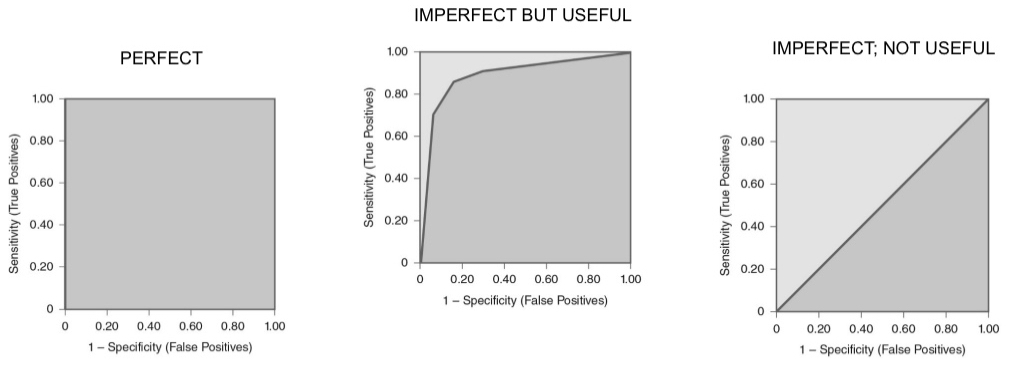
ROCs
used to compare diagnostic tests across different thresholds of sensitivity and specificity

top purple line
positive upper limit

red line
zero/no difference
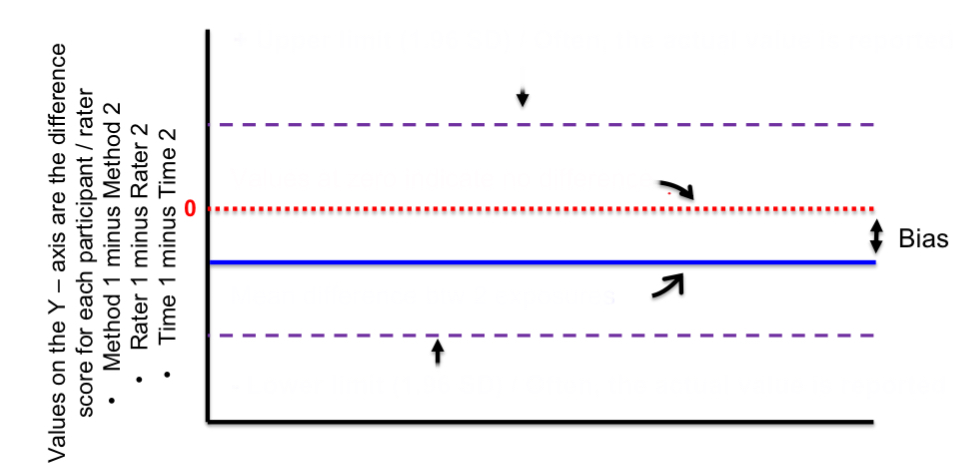
blue line
mean difference btwn 2 exposures

bottom purple line
negative lower limit

distance btwn red and blue lines
bias
pre-test probability
prevalence (%)
pre-test odds
what you think the odesa re that the pt has the disorder before you conduct the diagnostic test
post-test odds
what you think the odds are that the pt has the disorder after you conduct the diagnostic test
post-test probability
probability of the disorder once the test results are obtained
=pretest odds*LR+
LR+ > 10 or LR- <0.10
large effect
LR+ = 5-10 or LR- = 0.10-0.20
moderate effect
LR+ = 2-5 or LR- =0.20-0.50
small effect, sometimes important
LR+ = 1-2 or LR- =0.50-1.0
negligible
p value
probability that the result occurred due to chance or otherwise
confidence interval
range of values within which the true value is estimated to lie within a certain (usually 95%) probability
should you use this evidence?
is the study high quality (e.g. does the design minimize bias?)?
are the results important enough to use?
is the test or measure of interest available, practical, and safe for application in the clinical setting?
was your pt represented in the study sample?
can you estimate the pre test probability of the disorder and is it worth proceeding w/ the test especially if costly?
pt values or circumstances—risk of injury, important benefits, cost effectiveness, belief in evidence, previous experiences
verification bias
relates to reference standard
not all participants receive ref standard
incorporation bias
relates to ref standard
some or all of ref standard is incorporated within index test
differential verification bias
relates to ref standard
some participants receive different ref standard
observer bias
relates to examiners giving index test or ref standard
examiners conducting either ref standard or index test know clinical presentation of the participant
referral filter
relates to participants
possible participants are referred to the study due to suspicion of disease/disorder
diagnostic/revivew bias
relates to examiners giving index test or ref standard
examiners conducting either ref standard or index test/measure know result of other test/measures
spectrum bias
relates to participants and study design when a case control study is used
participants do not have a wide range of disease severity, comorbidities, or demographics that interact with the index or ref test
disease progression bias
relates to participants
the target condition changes in severity (either worsened or gets better) btwn administration of the index and reference tests
QUADAS tool
appraising a diagnostic study
assessment of study credibility-diagnostic tests or measures
did the investigators include subjects w/ all levels or stages of condition being evaluated by the index test? (spectrum bias)
was the time btwn index & ref tests short enough to rule out change in condition? (disease progression bias)
were all participants included in final analysis? if data was missing, was proportion of tests missing significant? (selection bias)—sensitivity testing
were the selection criteria for participants clearly described? (selection bias)
were the people interpreting either the ref standard and/or the index test blinded to result of the opposite test? (review bias)
was the reference standard independent of the index test? (incorporation bias)
was the ref standard given to all participants? (verification bias)
were individuals interpreting each test/measures results unaware (mask/blind) of the other tests results? (measurement bias)
was the time btwn application of the index test and the gold standard comparison test short enough to minimize the opportunity for change in the subjects’ condition? (disease progression bias)