Data Mining and Warehousing: Module 1 and Module 2
1/82
There's no tags or description
Looks like no tags are added yet.
Name | Mastery | Learn | Test | Matching | Spaced | Call with Kai |
|---|
No analytics yet
Send a link to your students to track their progress
83 Terms
Data Mining as Evolution of Information Technology
Data mining is the result of the natural evolution of information technology, specifically through the utilization of data management systems. The demand for more advanced systems with increased storage capacities and processing power have contributed to the growth and availability of data. These developments have influenced more effective mechanisms for data storage, retrieval, and data processing, which resulted in the generation of voluminous data. These data eventually became a valuable resource that aids decision making. As an economic asset, it helps organizations improve operations, increase revenue, improve the quality of products and services, and remain competitive.
Data Mining as Essential Step of Knowledge Discovery in Data
Data mining is the process of digging through a collection of data to discover hidden connections and patterns for the prediction of future trends. It uses some techniques to perform the tasks of extracting knowledge from data. Hence, data mining is also referred to as knowledge discovery from data. However, data mining is viewed by others as an essential step in the process of knowledge discovery. The process will be discussed in greater detail in the next sessions.
Data Mining as Interdisciplinary Subfield
Data is typically mined from databases or data warehouses, explored using some statistical techniques, and analyzed using machine learning algorithms to find patterns and connections.
Predictive Analytics
In the business analytics framework, data mining is referred to as this
Target Marketing
Data mining is used to understand customers better. It can be used for the segmentation of market groups for the customization of promotional campaigns.
Credit Risk Management
Data mining is used by financial institutions to create models to predict a borrower’s ability to take on and repay debt. Using a variety of demographic and personal information, these models automatically select an interest rate based on the level of risk assigned to the client.
Fraud Detection
Financial institutions apply data mining models to detect and stop fraudulent transactions automatically. By tracking spending habits, these models will flag anomalous transactions and instantly withhold payments until customers verify the purchase.
Healthcare
Data mining is used to predict a patient’s likelihood for different health conditions based on risk factors. Demographic, family, and genetic data can be modeled to help patients make changes to prevent or mediate the onset of unfavorable health conditions.
Sentiment Analysis
Data mining is utilized to gain an understanding of how a group of people feels towards a topic. Social media data is commonly used for this purpose.
Recommender Systems
Data mining is used in online systems to recommend products and services based on consumer behavior.
Spam Filtering
Data mining is also used to analyze the characteristics of malicious messages.
Education
Data mining is used in education to predict students’ future learning behavior and analyze student outcomes for improvement of teaching and learning strategies. Data mining can also be used by institutions to make accurate decisions for the development of the educational system.
Criminal Investigation
Data mining is used for exploring and detecting crimes and their relationships with criminals.
Automation Decision-Making
Data Mining allows organizations to continually analyze data and automate both routine and critical decisions without the delay of human judgment.
Accurate Prediction and Forecasting
Data mining facilitates planning and provides managers with reliable forecasts based on past trends and current conditions.
Cost Reduction
Data mining allows for more efficient use and allocation of resources. Organizations can plan and make automated decisions with accurate forecasts that will result in maximum cost reduction.
Customer Insights
Firms deploy data mining models from customer data to uncover critical characteristics and differences among their customers. Data mining can be used to create personas and personalize each touchpoint to improve overall customer experience.
Volume
Describes the challenge of storing and processing the enormous quantity of data collected by organizations. As data collection increases, it is more difficult to find the correct data and slows down the processing speed of data mining tools.
Variety
Encompasses the many different types of data collected and stored. Data mining tools must be equipped to simultaneously process a wide array of data formats and structure.
Velocity
Details the increasing speed at which new data is created, collected, and stored. Because of this, data mining is challenged in associating the rapidly increasing rate of data generation.
Veracity
Acknowledges that not all data is equally accurate. Data can be messy, incomplete, improperly collected, and even biased. With anything, the quicker data is collected, the more errors will manifest within the data. The challenge of veracity is to balance the quantity of data with its quality.
Cost
As data 4Vs of data challenge organizations, data mining requires more sophisticated computing infrastructure and processing power.
Privacy and Security
The increased storage requirement of data has forced many firms to turn toward cloud computing and storage. While the cloud has empowered many modern advances in data mining, the nature of the service creates significant privacy and security threats. Organizations must protect their data from malicious figures to maintain the trust of their partners and customers.
Data Cleaning
Is the removal of noise and inconsistent data.
Data Integration
Is performed by combining multiple data sources.
Data Selection
Is the retrieval of data relevant to the analysis from the database.
Data Transformation
Is the consolidation of data into forms that are appropriate for mining by performing summary or aggregation operations.
Data Mining
Is an essential process where intelligent methods are applied to extract data patterns.
Pattern Evaluation
Is performed to identify the interesting patterns representing knowledge based on interestingness measures.
Knowledge Representation
Is the application of visualization and knowledge representation techniques to present mined knowledge to users.
Cross-Industry Process for Data Mining (CRISP-DM)
Is an open standard process model that describes the conventional approaches used in data mining. It is the most widely used analytics model that applies to different disciplines as a structured approach to planning a data mining project.
Business Understanding
Is the initial stage of the CRISP-DM model. It involves a clear understanding of business objectives and needs. It is necessary to know the key factors that may influence the outcome of your project.
Data Understanding
Fundamental facts and figures collection are done from all available sources. Then the properties of data acquired are examined, and the quality of information is verified by answers to specific relevant questions concerning the completeness and accuracy of the material.
Data Preparation
After the sources are entirely identified, proper selection, cleansing, constructing, and formatting is done. Exploration of information may be executed for noticing the patterns in light of business understandings.
Modeling
The selection of modeling techniques is the very first step to take, followed by the generation of the test scenario for validating the model’s quality. Generate a few more models and assess them to make sure that they fall in line with the business initiatives.
Evaluation
The results of models are evaluated in the backdrop of business intentions. Then new objectives may sprout up owing to the new patterns discovered. This is an iterative process, and the decision whether to consider them or not has to be made in this step before moving on to the final phase.
Data Presentation
The final information gathered has to be presented suitably to the stakeholders. This has to be done as per their expectations and business requirements. The process may be simple or complex, depending on numerable factors.
Samples
The data by creating one or more data tables. The samples should be large enough to contain important information, yet small enough to process.
Explore
The data by searching for anticipated relationships, unanticipated trends, and anomalies to gain understanding and ideas.
Modify
The data by creating, selecting, and transforming the variables to focus on the model selection process.
Model
The data by using the analytical tools to search for a combination of the data that reliably predicts a desired outcome.
Assess
The data by evaluating the usefulness and reliability of the findings from the data mining process.
Incomplete Data
Can occur for several reasons such as unavailability of data attributes of interest, malfunctioning equipment, some data may not be recorded because they are not considered necessary at the time of entry.
Data Reduction
Obtains a reduced representation of the data set that is much smaller in volume yet produces that same analytical result. Include dimensionality reduction and numerosity reduction.
Dimensionality Reduction
Data encoding schemes are applied to obtain a reduced or compressed representation of the original data. Examples include data compression techniques (e.g. wavelet transforms and principal component analysis), and attribute subset selection (e.g. removing irrelevant attributes), and attribute construction (e.g. small set of more useful attributes is derived from the original set).
Numerosity Reduction
The data are replaced by alternative, smaller representations using parametric models(e.g. regression) or non-parametric models(e.g. histograms, clusters, sampling, or data aggregation).
Normalization
Is the scaling of data to a smaller range (e.g. 0.0, 1.0).
Concept Hierarchy
Is done by replacing low-level concepts (e.g. numeric values such as attribute age) with a higher level (e.g. young, middle-aged, senior).
Discretization
Is transforming a continuous attribute into a categorical attribute.
Noise
Is a random error or variance in a measured variable.
Binning
This method smooths a sorted data value by consulting its neighborhood that is the values around it. The sorted values are distributed into several buckets or bins.
Data Integration
Data mining requires often requires data integration, the merging of data from multiple data stores. Careful integration can help avoid redundancies and inconsistencies in the resulting data set. This can help improve the accuracy and speed of the subsequent data mining process. The semantic heterogeneity and structure of data pose significant challenges in data integration.
Entity Identification Problem
Is the matching up of objects in schema integration.
Object Identification
Happens when the same attribute or object may have different names in different databases.
Derivable Data
Occurs when one attribute may be a “derived” attribute in another table.
Redundancy and Correlation Analysis
An attribute may be redundant if it can be derived from another attribute or set of attributes. Inconsistencies in attribute or dimension naming can also cause redundancies in the resulting data set.
Correlation Analysis (Nominal Data)
Χ2 (chi-square) test is used to analyze the correlation nominal data. The formula is:

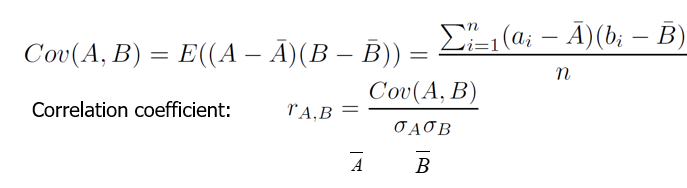
Correlation Coefficient
Is also known as Pearson’s Product Moment Coefficient. The formula is:

Covariance
Is similar to the correlation. It is mathematically represented as:
Positive Covariance
If CovA,B > 0, then A and B both tend to be larger than their expected values.
Negative Covariance
If CovA,B < 0 then if A is larger than its expected value, B is likely to be smaller than its expected value.
Independence
CovA,B = 0 but the converse is not true:
Some pairs of random variables may have a covariance of 0 but are not independent. Only under some additional assumptions (e.g., the data follow multivariate normal distributions) does a covariance of 0 imply independence.
Principal Component Analysis (PCA)
Is used to find a projection that captures the largest amount of variation in data. The original data are projected onto a much smaller space, resulting in dimensionality reduction. Find the eigenvectors of the covariance matrix, and these eigenvectors define the new space.
Attribute Subset Selection
Is another way to reduce the dimensionality of data. Redundant attributes. Duplicate much or all of the information contained in one or more other attributes.
Numerosity Reduction
Is used to reduce data volume by choosing alternative, smaller forms of data representation.
Regression Analysis
Is a collective name for techniques for the modeling and analysis of numerical data consisting of values of a dependent variable and of one or more independent variables.
Dependent Variable
Also called response variable or measurement
Independent Variable
AKA explanatory variables or predictors
Linear Regression
Y = w X + b
Two regression coefficients, w and b, specify the line and are to be estimated
Using the least-squares criterion to the known values of Y1, Y2, …, X1, X2, …
Multiple Regression
Y = b0 + b1 X1 + b2 X2
Many nonlinear functions can be transformed into the above
Log-linear Models
Approximate discrete multidimensional probability distributions
Estimate the probability of each point (tuple) in a multi-dimensional space for a set of discretized attributes, based on a smaller subset of dimensional combinations
Useful for dimensionality reduction and data smoothing
Histogram Analysis
Use binning to approximate data distributions and are a popular form of data reduction. It divides data into buckets and stores the average (sum) for each bucket.
Patitioning Rules
Equal-width: equal bucket range. Equal-frequency (or equal-depth)
Smoothing
Remove noise from data
Attribute/Feature Construction
New attributes constructed from the given ones
Aggregation
Summarization, data cube construction
Nominal
Values from an unordered set, e.g., color, profession
Ordinal
Values from an ordered set, e.g., military or academic rank
Numeric
Real numbers, e.g., integer or real numbers
Clustering Analysis
Is used for unsupervised learning, uses top-down split or bottom-up merge method.
Decision-tree Analysis
Is used for supervised and uses top-down split
Correlation
Analysis is used for unsupervised learning and uses a bottom-up method.
Concept Hierarchy
Organizes concepts (i.e., attribute values) hierarchically and is usually associated with each dimension in a data warehouse. Facilitate drilling and rolling in data warehouses to view data in multiple granularities.