8.4 Human Population Carrying Capacity
1/24
There's no tags or description
Looks like no tags are added yet.
Name | Mastery | Learn | Test | Matching | Spaced |
|---|
No study sessions yet.
25 Terms
Carrying Capacity (k) Defined
Maximum number of individuals of a species that an ecosystem can support
Often human-determined
Easy to determine for wild animals; for humans it’s not so easy
Resources all life requires: water, food/ energy, shelter/ space
What different things do humans need to survive? (reasons human k is hard to calculate)
Transportation, medicine/ health care, minerals, clothing, electricity/ appliances/ technology … humans use a lot of stuff that impacts the Earth
Human needs vary by region (think MEDC vs LEDC)
Whose standard of living is correct?
Ecological Footprint (EF)
A model used to determine if humans are living within our carrying capacity
Assesses human impact & sustainability
Is a population living sustainably within an area?
Consider food, space, water to support a population without causing damage
Bison in Yellowstone NP: 2500 to 4500 depending on available food
When population gets too large, individuals are culled from the herd (killed)
Deer in Valley Forge NP: k= 31-35 deer/ mi2 (in 2009 there were 241 deer/ mi2)
Mean (average) population size is typically within carrying capacity
If population < k then either J or S curve (see 2.1.3 notes)
Recall r & k strategists
Determining human carrying capacity (k)
Waste isn’t all biodegradable leads to environmental degradation
Resources vary
Luxuries & necessities
Human population moves goods via Global Trade
Food imports/ exports
imports/ exports other goods
Technology - makes life easier, but can be bad for the environment (could be good too)
BAD: pollution from mining of resources to production to shipping of products to disposal
GOOD: solar panels, biofuels, energy efficient appliances & cars, design for circular use, explore options for helping survival (GE foods), using tech to predict weather & climate change
Because of the above points, it is hard to determine
Waste
produced at a rate greater than environment can assimilate it
Resources
range is greater than what other species need
farmers
subsistence: use less pesticides, fertilizers, space than commercial farmers (use machinery (needs FFs), pesticides, fertilizers, lots of water, use GMO seeds)
predator-prey relationship
predators tend to use more space, have a lower carrying capacity than prey
bc need to eat more to combat entropy
Imports
Global trade of foods
constant supply of produce that used to only be available seasonally + exotic foods from other places
Waste is imported/ exported
Sweden imports trash to make energy
U.S. used to export recycling to China
Chester, PA incinerator gets trash from other states
Technology
Includes tools (modern & primitive), early agricultural, fossil fuels, fire
Anything that can be used to do work & make it easier
Local or global?
All of the above vary by region and even within countries.
Earth’s carrying capacity
UN, 2001: between 4-16 billion people
Median is 10 billion
Estimates can drop due to resource depletion coupled with increased consumption
Models based on Malthus + his opponents
Can Earth continue to sustain us?
Can we create technology to keep living sustainably?
2 aspects
Biocapacity = Earth’s bioproductive land + sea
Forests, croplands, pastures, fisheries
Land available to grow food & absorb waste
Measured in Gha (global hectare) = 100 m2 (inside of a 400 m track)
Demand = the amount of bioproductive land needed for resources + space for infrastructure & waste disposal
WWF, 2014: global EF in 2010 was 18.1 billion gha (2.6 gha person)
1.7 gha is biocapacity available
0.9 gha is a shortfall (using more than we have)
Things used to measure EF
Energy
Renewable or nonrenewable
Travel/ transportation
Individual or public transportation
Fuel type + emissions
Air travel
Goods (stuff)
Food, clothing, gadgets, other things we consume
Infrastructure + settlements take up space
Human needs take space away from (urbanization)
Forests & other ecosystems
Agricultural lands
Less forests & natural ecosystems reduces the number of plants to absorb carbon dioxide: waste of combustion of FF + wood/forests
More space used increases footprint
Food + fiber
Comes from pastures & croplands
Inputs to growing the crops & animals (water, fertilizers or food, space, pesticides)
Are animals pasture raised or raised inside
Non- food crops:
Sugar, corn, sorghum for biofuel (ethanol)
Cotton, flax, silk
Pharmaceuticals
Tobacco
Coffee, tea
Seafood: wild caught vs. farmed
Food miles!
More specific footprints
Carbon
Total carbon based GHGs emitted via industry, domestic, event, flight, locality, country
Water
Amount of water used for washing & drinking, and used to grow food
Estimate: 800 L water is needed to make 1 L milk
Food
How much food a human needs (where does the food come from?)
Based on the land needed to raise crops/ animals/ animal feed and the land needed to absorb carbon emissions from food production or fishing
Case Study: Peru’s EF
Demographic data
CBR: 18.28
CDR: 6.01
NRI: 1.28 (natural rate of increase)
DT: 57 yrs
Growth Rate: 12.26
EF & biocapacity per person
Peru has a credit
Abundant natural resources
Rainforests
Overuse of resources
Hazards
Fe, Cu, Au, Ag, petroleum. wood, fish, coal. gas, hydropower
GDP per capita: US $6500
Why a low EF? What might be changing?
lots of resources but less of a need, however their biocapacity is falling → incr. pop + decr. in bioproductive land
16% of pop. has no access to H2O; 28% no access to sanitation
EF: 1.54 gha/person
biocapacity: 3.86 gha/person
+2.32 gha/person credit!
Earth Overshoot Day
The day each year when we have used all the resources for the year
Global biocapacity x 365
world EF
Agenda 21
1992 Earth Summit in Rio
178 countries adopted the agenda
Social & economic dimensions to deal with poverty, consumption & health
Conservation & management resources for development
Strengthen roles of women, children, NGOs, local municipalities & indigenous people
Implementation: how to get it done using science, technology, education & international institutions
The Planetary Boundaries Model
Created by Johan Rockström & 28 other reputable scientists
Identified 9 quantifiable “planetary boundaries”
Each boundary involves regulatory processes that help Earth's resilience & stability
Crossing a boundary increases the risk of creating irreversible environmental changes since there are limits to development
“Up to what limits will the Earth system be able to absorb human activities without compromising the living conditions of species?”
Model was revised in 2022 since much more data was available
As more data becomes available, it can be further revised
Uses of the Planetary Boundaries Model
Human disruptions to various systems on Earth is scientifically identified using data
Includes many more systems than just climate change
Can be an alert to action for both the public and policymakers
Limitations
Only concerned with ecological systems (environmental justice cannot be considered since the human aspect is not included)
Boundaries change as new data is obtained (“a work in progress”)
It is a global model- may not apply to every locality/ country
The Doughnut Economics Model
A framework to create a regenerative & distributive economy that meets the needs of ALL people
2 concentric rings
Inner ring: social foundation
To ensure that everyone has access to life’s essentials
Based on social SDGs
Outer ring: ecological ceiling
ensures that we don’t surpass the planetary boundaries to protect Earth’s support systems
Based on planetary boundary science
Combined they represent the minimum needed for an ecologically & socially just economic system
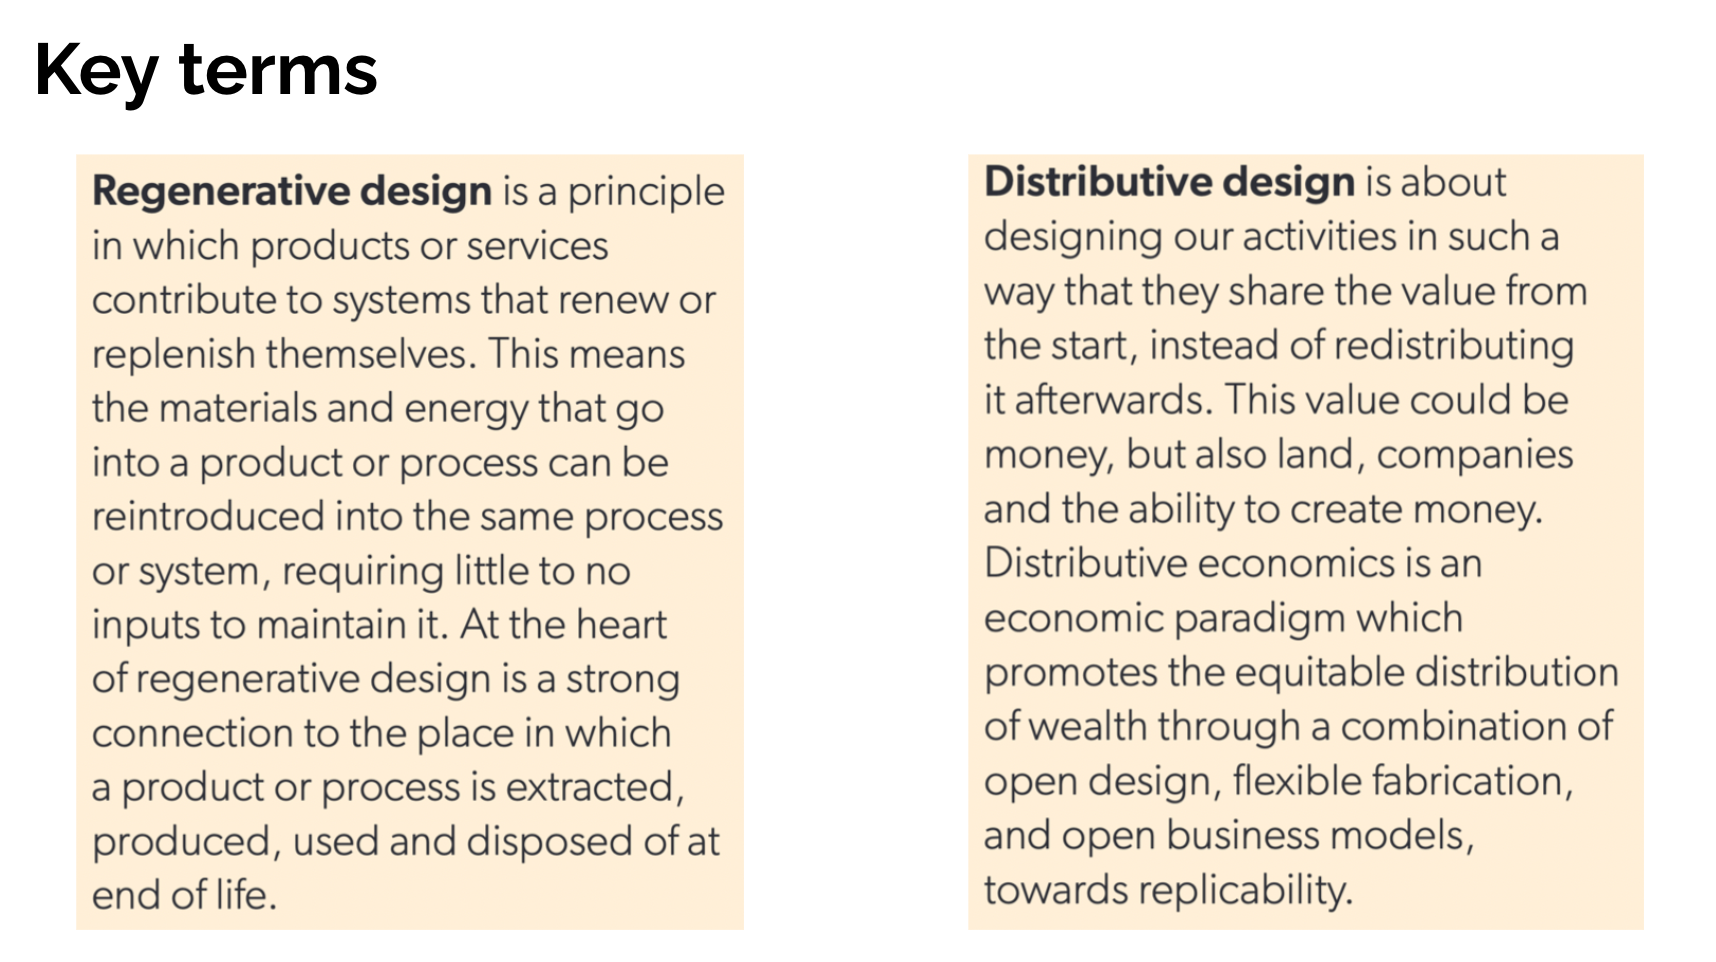
Key Terms
Uses of the Doughnut Model
Supports environmental justice
Is being used at different scales (national level through localites)
Supports sustainable action
Has reached popular awareness
Limitations of the Doughnut Model
Still being worked on
If individuals are focused on their own wealth it won’t work
Principles of regenerative & distributive practice are toop broad
No specific policies