Advanced Math
1/185
There's no tags or description
Looks like no tags are added yet.
Name | Mastery | Learn | Test | Matching | Spaced | Call with Kai |
|---|
No analytics yet
Send a link to your students to track their progress
186 Terms
Derive e^x
d/dx e^x = e^x
d/dx e^(ax + b) = a x e^(ax + b)
d/dx e^(f(x)) = f'(x) x e^(f(x))
Derive exponetials
d/dx a^(f(x)) = f'(x) x ln(a) x a^(f(x))Derive Nature Logs
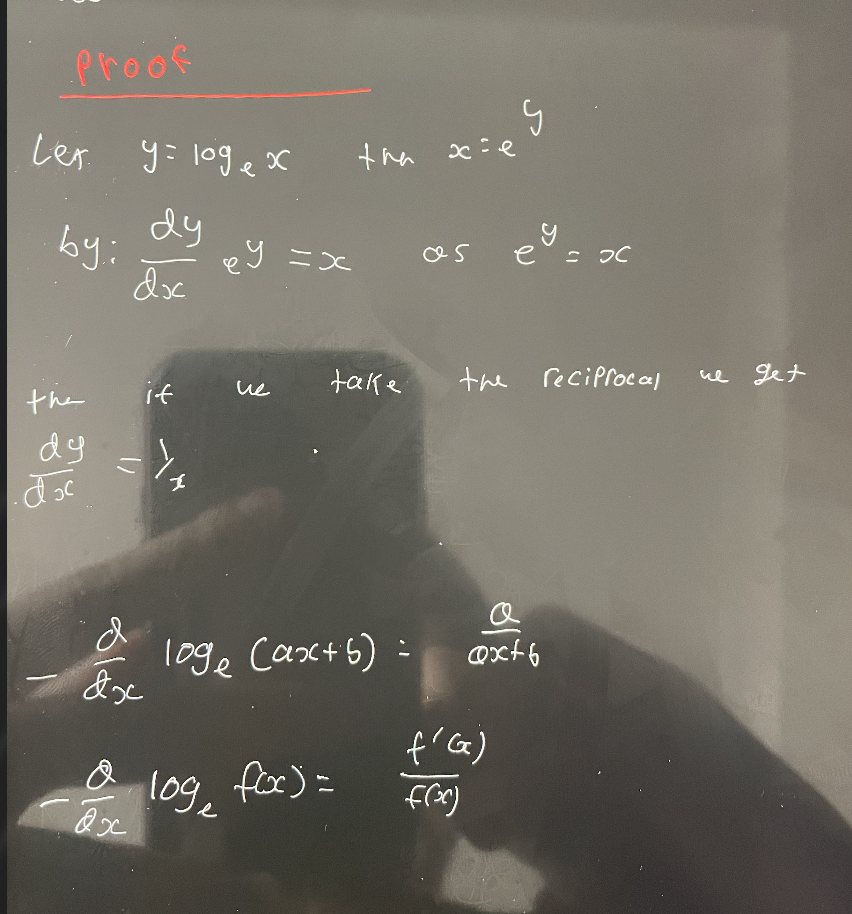
d/dx ln(f(x)) = f'(x)/f(x)
Proof for this
Trig derives
when we derive
cot(f(x)) = −cosec2 x F(x)⋅F’(x)
Cosec = −csc(F(x)) x cot(F(x))⋅F’(x)
Sec = sec(F(x)) x tan(F(x)) x F′(x)
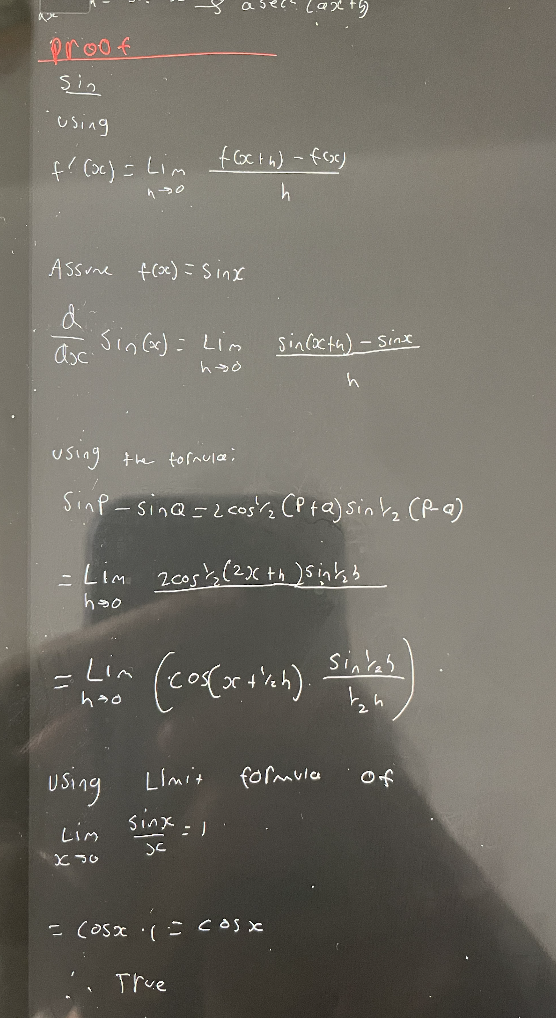
Proof for Sin
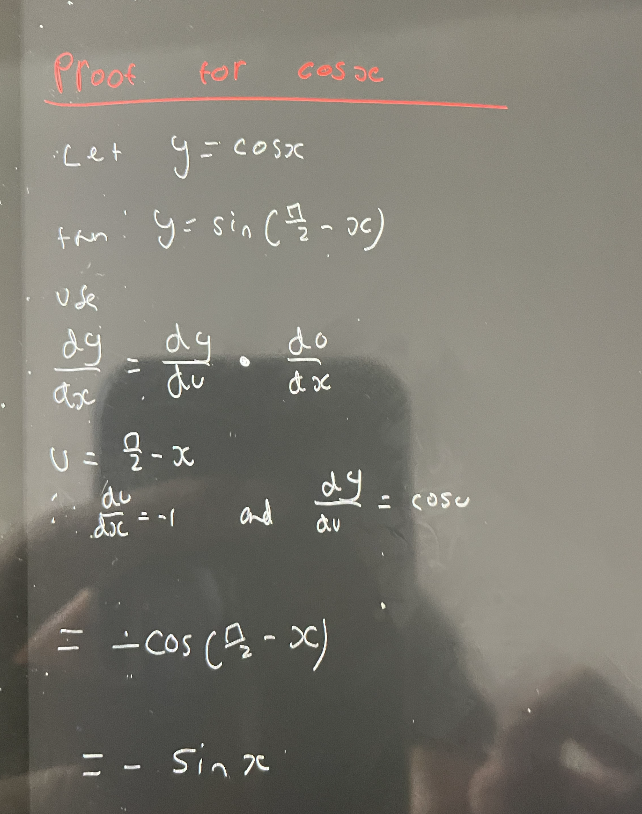
Proof for cos
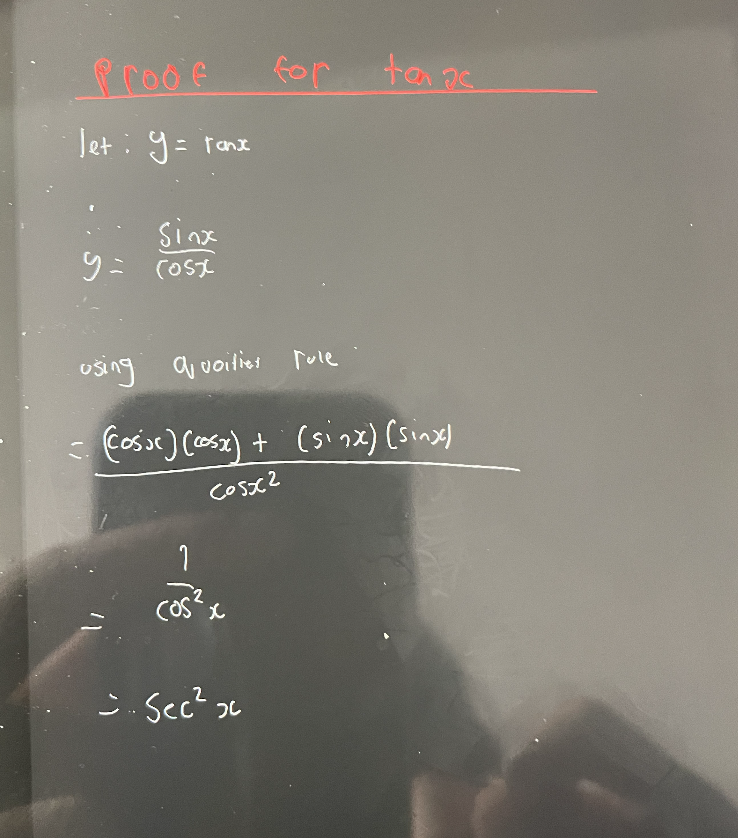
Proof for Tan
Further Differentiation
skip
Increasing, decreasing and stationary rules at a point
F’(Φ) > 0, then F(x) is increasing at x=Φ
F’(Φ) < 0, then F(x) is decreasing at x=Φ
F’(Φ) = 0, F(x) is stationary at x=Φ
Graphs to remember Turning points and points of inflection
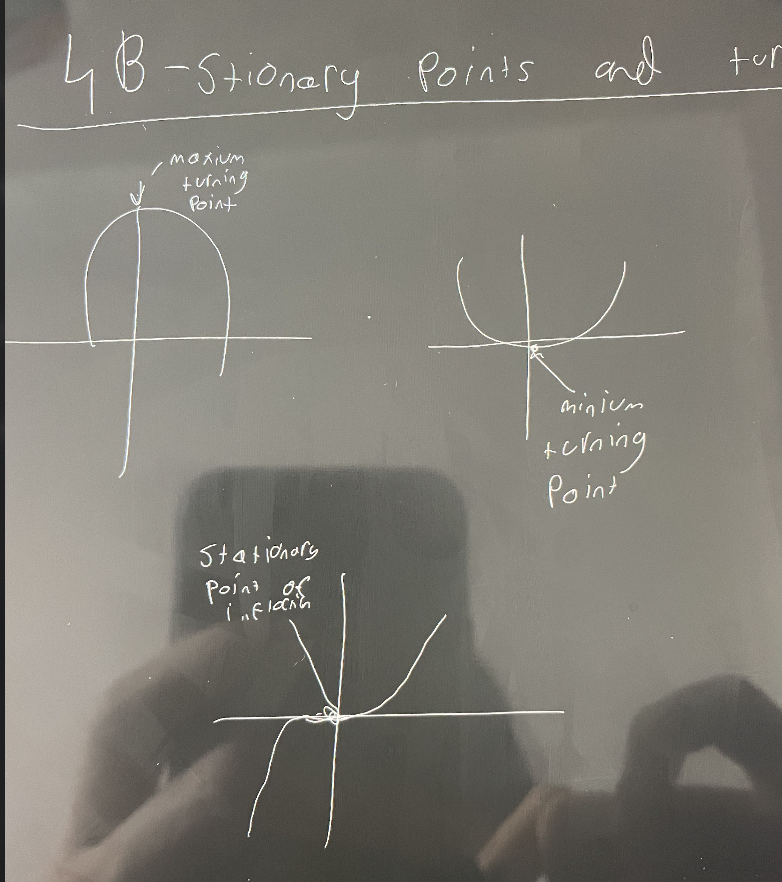
Turning points
A stationary point is called a turning point if the derivative changes sign around the point
Maximum turning point
The curve goes from increasing to decreasing
Minimum turning point
curve goes from decreasing to increasing
Local Maximum
Where the function reaches a peack in its nearby region. (highest point)
Local minimum
like the local minimum but its at the lowest
Point of inflection and how to determine it
Where the curve changes its shape.
So the point where the tangent crosses the curve making the concavity change
only graph given: find where curve switchs
only equation: find y’' = 0
How to find stationary points
find F’(x)
equate for x by setting F’(x)=0
solve for x
What does it mean when it asks for the nature
its asking for the local minimum or maximum or the point of inflection
To determine its nature we
double derive using this rule
F’’(x) > 0, Local minimum: curves upwards
F’’(x) < 0, Local maximum: curves downwards
F’’(x) = 0, Point of inflection
(if you get x sub in stationary points to determine nature)
Concavity and poitns of inflection
if F’’(Φ) is - then its concave down at x=Φ
if F’’(Φ) is + then it concaves up at x=Φ
What is Global maximum and minimum
It’s basically the highest and lowest point in the graph
how to find the maximum or minimum value of F(x)
So first determine the value of x that maximises F (so do F’(x)=0 and find staionary points if its a parabola if its not then look at the domain and find Global maximum and sub it into F(x) )
NOTE IT IS NOT A CORD
How to do opimisation
introduce the two variables “let y be the quantity that is to be maximised and let x be the quantity that can be varied”
form equations
find global maximum and minimum
write conclusion
Using second derivative to test stationary points
F’’(Φ) > 0, concaves up at x=Φ making it the minimum turning point
F’’(Φ) < 0, concaves down at x=Φ making it a maximum turning point
F’’(Φ) = 0, more work needed go back to table
Integration
NOTHING
What is a integral?
reverse differentiation by summing infinitely small quantities. used to find the area under the curve
or
∫ F(x) dx = Area of shaded region
What is a definite integral
The definite integral is defined to be the area of a region under the curve between the boundaries a<x<b
in which
x = a (Lower limit)
x = b (Upper limit)
∫ba F(x) dx
Shape areas to remember
Triangle: ½ Bh
Trapizium: ½ (a+b) W
Circle: πr²
Tips for definite integrals
if y cord is not provided sub x in
A - (- B) = Base
How to find Area without the graph (fundamental theorem of integrations will touch more on this later)
Find primitive function
Then use limits of F(B) - F(A)
Integrating functions with a negative value
when it has a negative value, its just saying that the graph is below the x axis
can be show as
Area 1+ Area 2 - Area 3
where Area 1 and 2 are above x axis
Area 3 are below the x axis
Odd functions
It is odd when the area of each shaded hump is the same, hence the whole integral from 2 to -2 is zero because the equal humps above and below the x axis cancel out
(SIN IS ODD BTW)
Show through:
∫a-a F(x) dx = 0
Even Functions
Since itll have al line of symmetry in the y axis , the areas to the left and right of the y axis are equal so itll double instead of canceling
(COS IS EVEN)
∫a-a F(x) dx= 2∫a0 F(x) dx
Dissection of the interval
∫ba F(x) dx = ∫ca F(x) dx + ∫bcF(x) dx
tip ( The c’s across from each other cancel out so use that theory to form this equation when needed)
What if it has zero width
∫aa F(x) dx = 0
Reversing the interval
∫ba F(x) dx = - ∫ab F(x) dx
works with
F(A) - F(B) = - (F(B) - F(A) )
Sums of functions
∫ba F(x ) + G(x) dx =∫ba F(x) dx + ∫ba G(x) dx
Multiple of a integral
∫ba F(x) X K dx = K∫ba F(x) dx
Proving Fundamental Theorem (Differential Form)
d/dx ∫xa F(x) dx = F(x)
If F(x) is continous, then the signed area function for F(x) is the primitive of F(x) of
A’(x) = d/dx ∫xa F(T) dT = F(x)
Note
A’(x)= Orginal founction
Use A(x) to find area and deriving gives A’(x)
Equation = Height
Indefinite Integrals
Find the primitive and since there are no bounds we have to add +C at the end of the integral
Compound regions ( no integration)
just find the areas and add them not hard
Compound regions ( with integration)
∫ba (G(x) -F(x) ) dx
F(x) is below G(x)
if the graph connects use the formula above
if it doesn’t but its separated then find both halfs and add
Trapizoidal rule (next 7 slides will be it )
What is the width for it
b-a
F(a)- f(b)/ 2
What is the average of parrallel sides
Area of trapizium in this case
b-a/2 * (f(a) + f(b))
The method is to
Replace the curve by a straight line, by a chord giving us the cords (a,f(a)) and (b, F(b))
if it concaves up it overestimates the integral
if it concaves down it under estimates it
if its linear itll give the exact value
Rules with it
Trapezoidal rule with n subintervals
∫ba F(x) dx = b-a/2n (f(a) + f(b) + 2( f(x1) +…. f(xn))
How to determine subintervals
look at the table of values. minus the total amount of x’s in the table by 1
Another way to find the subintervals is to
h= b-a/n
n= number of x values - 1
if they give it in terms of function values then to find x1, x2, x3
we do
x1= a+h
x2= a+2h
x3+ a+ 3h
and so on
to determine how many xn’s to use just do n+1
Reverse chain rule
∫ F(x) * F’(x) dx= (F(x)) ^ n+1/ n+1
what are the steps
determine u
derive u
make du= u’ dx
sub u into the equation
manipulate the equation so you can sub in du
integrate
Integration of exponentials
∫e^f(x) dx= 1/F’(x) *e^f(x) +C
integration of exponetials of base a
∫a^f(x) dx = 1/F’(x) Lna * a^F(x) +C
Integration of reciprocal
∫ F’(x)/F(x) dx= Loge | F(x)| + C
∫ 1/ax+b dx = 1/a [loge (ax+b) ] + C
1/ xlogea
deriving logax
ax= exlogea (works for a but just remove the x in it)
Tips for this
Trig deriving
each one is mulitpled by 1/F’(x)
∫sin(fx) dx = -cosF(x)+C
∫cos(fx) = sin(F(x))+C
∫ sec²(fx) = tan(F(x))+C
∫cosec(fx) cot(F(x))+C
∫ sec(fx) sec(F(x)) +C
except for these 2
∫ cot fx) = loge |sinx| +C
∫ tan(fx) = -loge |cosx|+C
Yr 11 Probability (nothing here)
The basic Formula for Probability
P(Event)= Number of favourable outcomes/ number of possible outcomes
What is sample space
The sample space is the set of all possible outcome
Complement of an Event
The complement of event E, written E′ is the event that E does NOT occur.
.
P(E′)=1−P(E)
Intersection of sets
A∩B=A and B ‘
A∪B=A or B (or both)
The union of sets
Rules not mutually exclusive
P(A∪B)=P(A)+P(B)−P(A∩B)
For mutually exclusive evnts
P(A∪B)=P(A)+P(B)
Conditional Probaility
Probability of event A given event B has occurred.
P(A|B)=P(B)/P(A∩B)
if its independent then it just equals to P(A)
P(A∩B) Formulas
P(A∩B)
Probability of A and B
P(A∩B)=P(A)P(B) (InDependent)
P(A∩B)=P(A)P(B∣A) (Dependent)
Product rule
P(A and B)+ P(A|B) x P(B)
if its indepentdent then its just: P(A) x P(B)
What is a discrete probability distribution
A discrete probability distribution assigns probabilities to each possible countable value of a random variable.
What is a random variable
A random variable is a variable that represents a numerical outcome of a random process or experiment.
the outcomes of a random experiment
what is the expected value
The expected value is the long-term average value of the random variable.
E(X)=∑x P(X=x)
What is the variance
The variance measures the spread of the distribution.
Var(X)=∑(x-mu)² p(x)
∑x² p(x) - mu²
What is standard deviation
Standard deviation is a measure of how far values typically vary from the mean of a distribution.
it is the square root of the variance
YR 12 Stats (nothing)
What is a mode
Mode is the most popular score
What is the range
The range is the difference between the maximum and minimum
What is a cumulative frequency table
its like a normal table but for the cumulative you keep adding the new frequency to the one you already have for example
F= Frequency for this
C= cumulative
F1= 88
C1= 88
F2= 10
C2= 98
etc etc
The formula for Mean
∑xf / n
n= total frequency
Formula for variance
∑x²F/ n - (mean)²
What is the inter quartile range and how to calc it
it is the measure of the spread and its calculated by Q3-Q1
What is the 5 number summary (with its respected formula)
minimum
Q1 - n+1/4
Q2 - n+1/2
Q3 - 3(n+1)/4
Maxium
What is Bivariate data
Data in the form of ordered pairs
What is interpolation
It is the prediction of results within a range of variables
What is Extrapolation
is the process of estimating values outside the range of known data using an existing trend.
Key points (exam-ready)
Uses a pattern or model from given data
Predictions are made beyond the smallest or largest x-values
Results are less reliable than interpolation
Example
If data shows population growth from 2015–2025, predicting the population in 2035 is extrapolation.
What is Pearsons Correlation Coefficient
Pearson’s correlation coefficient is a numerical measure of the strength and direction of a linear relationship between two variables.
show by
r= ∑ (x- x mean)( y- y mean) / Sqr ∑(x- x mean)² ∑ (y- y mean)²
Pearsons. correlation Regression line formula
m= ∑(x- x mean)( y- y mean) / ∑(x- x mean)²
B= y mean - m(x mean)
What is Relative Frequency
Estimates of probabilities
What is a Discrete probability distribution
A discrete probability distribution lists all possible values of a discrete random variable and their associated probabilities.
for it to be valid P(X=x) must equal to 1
Probability Densitiy function (PDF)
is a function in the domain of [a,b]
it is the basic i definite integral but it will always equal to one
THings to know about PDF
Mode is the global maximum
Probability is the area under the curve
Cumulative distribution function
F(A)=0
F(B)= 1
is the signed area function of the PDF
F(x)= P(X<x)
with bounds x and a of F(t) dt
Tips for in general with PDF and CDF
P(0<X<1) these are youre bounds
P(W<X< Y) = F(Y)- F(W)
How to calc CDF
integrate with no bounds
make it equal 1
find C
Or
use the formula from above
Formula for Mean/ expected vaue using integration
∫ab xF(x) dx
Formula for variance using integration
∫ba (x-mu)² F(x) Dx∫ba x² F(x) dx - mu²Where is the expected distribution?
It is in the centre
What is Normal Distribution (and its formula)
A normal distribution is a continuous, symmetric probability distribution shaped like a bell curve, centered at the mean.
Φ(z)= e^1/2 x z^2 / sqr 2 pi