2.4 national income and 2.5 economic growth
1/25
There's no tags or description
Looks like no tags are added yet.
Name | Mastery | Learn | Test | Matching | Spaced | Call with Kai |
|---|
No analytics yet
Send a link to your students to track their progress
26 Terms
Circular flow of income
an economic model that illustrates how money flows in an economy
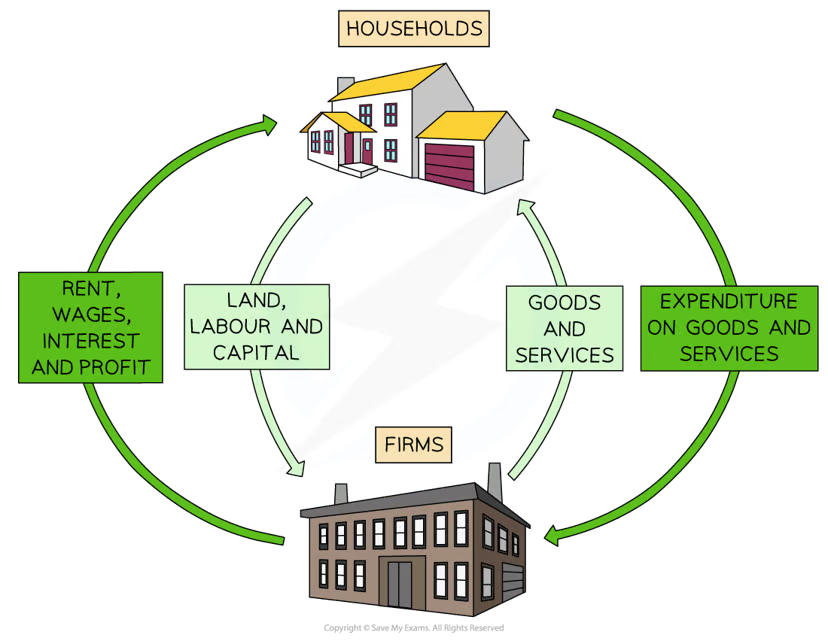
Diagram analysis of the circular flow
Households own the wealth in the economy
These are the factors of production
Households supply their factors of production to firms and receive income as a reward
They receive rent for land, wages for labour, interest for capital, and profit for enterprise
With this income, they purchase goods/services from firms
Firms purchase factors of production from households
They use these resources to produce goods/services
They sell the goods/services to households and receive sales revenue
National income is the value of the output of an economy over a period of time
It can be calculated using the income approach or expenditure approach
Expenditure = income
Income is a flow in the economy, whereas wealth is a stock of assets that can be used to generate income
Injections
add money into the circular flow of income and increase its size
Increased government spending (G)
Increased investment (I)
Increased exports (X)
withdrawals
remove money from the circular flow of income and reduce its size
Increased savings by households (S)
Increased taxation by the government (T)
Increased import purchases (M)
Injections > withdrawals
economic growth
vise versus is a fall in real GDP
the multiplier effect
Occurs when an injection into the circular flow causes the real national income to increase by a greater amount
size of the multiplier is dependent on the (MPC), (MPS), the marginal propensity to import (MPM) and the marginal propensity to be taxed (MPT). If the marginal propensity to withdraw is smaller, then the multiplier will be higher, and vice versa
multiplier ratio
the ratio of change in real income to the injection that created the change
Marginal propensity to consume
The proportion of additional income that is spent

marginal propensity to save
The proportion of additional income that is saved
marginal propensity to tax
The proportion of additional income that is paid in tax
marginal propensity to import
The proportion of additional income that is spent on imports
calculating the MPC

calculating withdrawals

Significance of the Multiplier in Shifting AD
if taxes increase, the value of the multiplier reduces
If interest rates increase, savings increase and consumption decreases, and the multiplier reduces
If exchange rates appreciate, the level of imports will increase and the multiplier decreases
If confidence in the economy increases consumption increases and the multiplier increases
short run economic growth
Changes to any of the components of aggregate demand (AD)
An increase in real GDP = economic growth
Long run economic growth
Caused by improvements to the quality or quantity of the factors of production
Actual growth
the increase in the productive potential of an economy as demonstrated by a shift outward of the production possibilities frontier (PPF) or the long-run aggregate supply (LRAS) curve
potential growth
when there is an increase in the real value of goods and services produced in an economy over a given period of time
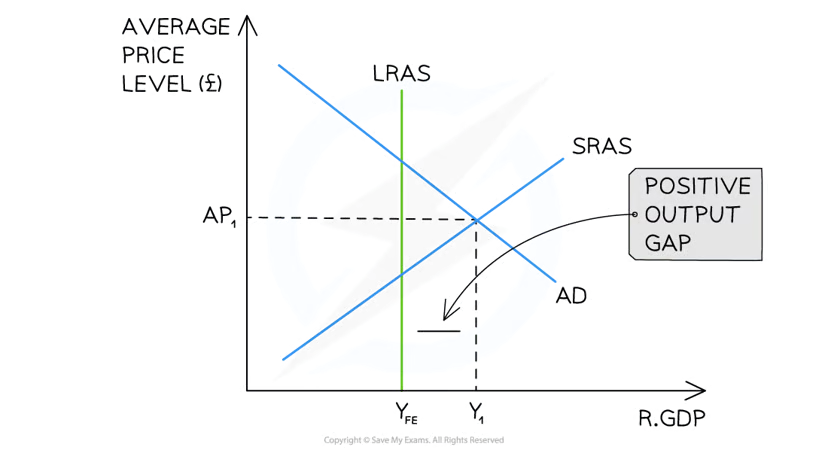
output gap
the difference between the actual level of output (real GDP) and the maximum potential level of output
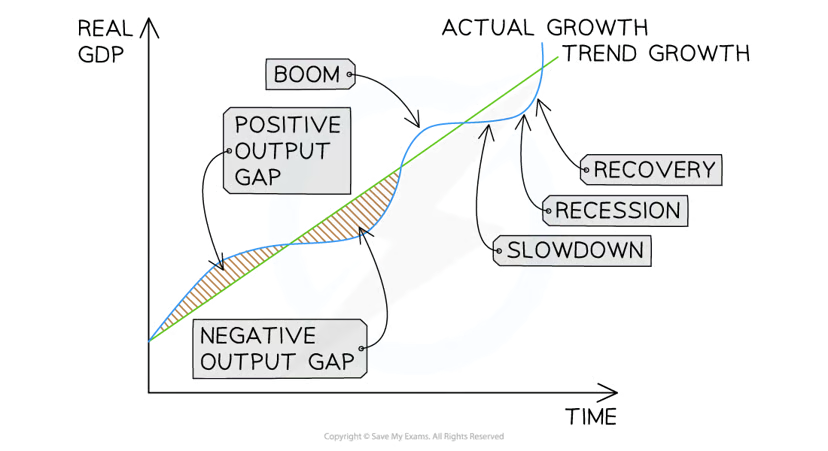
positive output gap
when real GDP is greater than the potential real GDP
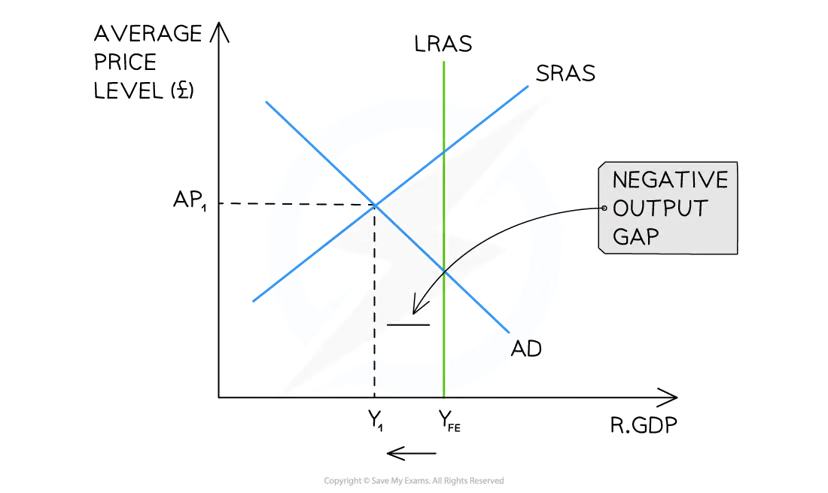
negative output gap
when the real GDP is less than the potential real GDP
there is spare capacity
Business cycle
refers to the changes in real GDP that occur in an economy over time
characteristics of a recession
two consecutive quaters of negative growth
high unemployment
spare production capacity
low confidence for firms/households
characterstics of a boom
high economic growth
decreasing unemployment
demand pull inflation
Benefits of economic growth
increased incomes
decreased levels of poverty
improvement in quality and quantity
higher sales revenue
higher gov tax revenue
costs of economic growth
demand pull inflation
lack of equity
negative externalities
increased inflation can harm export sale