SCO 3056: Midterm 1
1/72
There's no tags or description
Looks like no tags are added yet.
Name | Mastery | Learn | Test | Matching | Spaced | Call with Kai |
|---|
No analytics yet
Send a link to your students to track their progress
73 Terms
SCPC System
The essential task is to…
• manage efficiently the flow of materials, the utilization of people and equipment, and to respond to customer requirements by utilizing the capacity of suppliers, internal facilities, and (in some cases) customers to meet customer demand
SCPC System Framework
Front end
• Strategic mission of a SCPC system
• Establishes the overall company direction for supply chain planning and control
• Serves as a long-term decision support
Engine
• Tactical mission of a SCPC system
• Encompasses the set of SCPC systems for detailed material and capacity planning
• Serves as an intermediate-term decision support
Back end
•Operational mission of a SCPC system
•Depicts SCPC execution systems
•Serves as a short-term decision support
Long term support
• Strategic direction decision
• Capacity planning decision (e.g., equipment, facility, suppliers, etc.)
• To meet future market demand
Intermediate-term support
• Matching supply-demand in terms of volume and product mix
• Provides the exact material and production capacity needs
• Providing customers/suppliers information (delivery times, quantities)
How many?
Which models?
Where?
When?
Materials?
Inventory?
Workforce?
Suppliers?
Customers?
Short-term support
• Detailed scheduling of resources to meet production
requirements
• Planning day-to-day activities
• Tracks and reports the daily use of resources and execution
Timing/schedules
Materials
People
Equipment
Work centers
ERP (Manager)
ERP is a comprehensive software approach to support decisions concurrent with planning and controlling the business
ERP (IT Community)
ERP is a term describing a software system that integrates application programs in finance, manufacturing, logistics, sales and marketing, human resources, and other functions in a firm
Accomplished through a database shared by all the functions and data-processing applications
ERP
• ERP requires consistent measuring across all applications
• There are four aspects of ERP software that determine the quality of an ERP system
The software should be multifunctional in scope
The software should be integrated
The software needs to be modular in structure
The software must facilitate basic planning and control activities
Transaction Processing
the posting and tracking of the activities that
document the business
Efficient handling of the transactions as goods move through each step of the process
is the primary goal of an ERP system
Decision support
the system helps the user make intelligent judgments
about how to run the business
This is a second objective of an ERP system
How ERP Connects the Functional Units
• A typical ERP system is made up of functionally oriented and tightly
integrated modules
• All the modules of the system use a common database that is updated in
real time
• ERP vendors are constantly looking for ways to improve the functionality of
their software, so new features are often added
The Scope of ERP Applications
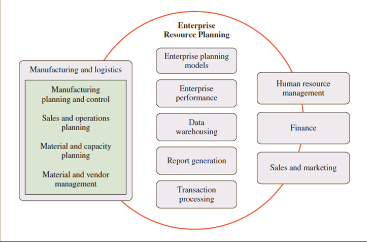
Typical ERP Modules
• Finance
Automatic capture of basic accounting transactions at the source
• Manufacturing and Logistics
Largest and most complex of the module categories
Typical components include:
Sales and operations planning
Materials management
Plant maintenance
Quality management
Production planning and control
Project management
• Sales and Marketing
Customer and sales management, forecasting, and so on
• Human Resources
Supports the need to manage, schedule, pay, hire, and train people
Data Integration
• ERP works from a single database
• Transactions are processed in real time
• Data entered by one functional area updates all other functional areas and
the data are processed in real time
Eliminates reposting of data (errors)
Ensures a common vision instantly displayed
• Data warehouse: a special program that is designed to automatically
archive and process data for uses that are outside the basic ERP system
applications
How Supply Chain Planning and Control Fits Within ERP
• ERP is concerned with all aspects of a supply chain
managing materials
Scheduling machines and people
Coordinating suppliers and key customers
• The coordination required for success runs across all functional units in the
firm
An ERP system is designed to provide the information and decision support needed to
coordinate this
Evaluating System Effectiveness
• An ERP system can provide the data needed for a comprehensive set of
performance measures
This allows the firm to evaluate strategic alignment of the various functions with the
firm’s strategy
• Three major functional areas make up the internal supply chain of a
manufacturing enterprise
Purchasing
Manufacturing
Sales and distribution
• Tight cooperation is required between these three functions for effective
manufacturing planning and control
Implications if all Three Areas are Allowed to Work Independently
• Purchasing will buy the largest quantities possible
Result in large amounts of raw material inventory
• Manufacturing group desires to maximize production volumes
Spread the fixed costs of production over as many units as possible
Result in high WIP
Time between batches increases
Response time to unexpected demand increases
• Distribution will try to fully load every truck
Minimize transportation cost
Result in larges amount of inventory in distribution centers
• Sales group might sell product that cannot possibly be delivered on time
Integrated Supply Chain Metrics
• Developed by the APICS Supply Chain Council
• Designed to measure the impact of decisions on the entire supply chain
• Avoids incentives to behave independently by developing metrics that
reflect the entire supply chain
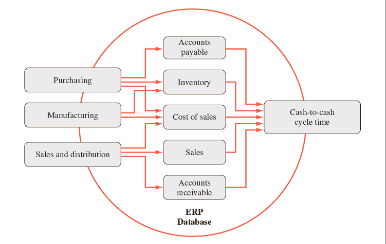
Cash-to-Cash Cycle Time
• Cash-to-cash cycle time: integrates the purchasing, manufacturing, and
sales/distribution cycles
Calculating the measure requires the use of data related to purchasing, accounting,
manufacturing, and sales
• Is a measure of cash flow
Where cash comes from
Where cash is spent
Net change in cash
• Cash-to-cash cycle time = Inventory days of supply
+ Days of sales outstanding
- Average payment period for material
Integrated ERP Data for Cash-to-Cash
Cycle Time Calculation
Sales & Operations Planning (S&OP)
• An integrated business process that links strategic goals to production in
order to balance supply and demand within a supply chain
• It aims to coordinate various business elements including sales,
marketing, finance, operations, new product development, manufacturing,
and sourcing to derive one integrated plan
• It is performed at least once a month and is reviewed by management at
an “aggregate level”
• It provides the key communication links for top management to coordinate the
various planning activities
The Role of S&OP
• The role of S&OP is to balance supply and demand at the volume (overall sales
rates, production rates, aggregate inventories, and order backlogs) level
Volume
(big picture, product family production rates, etc.)
Mix
(details, individual products)
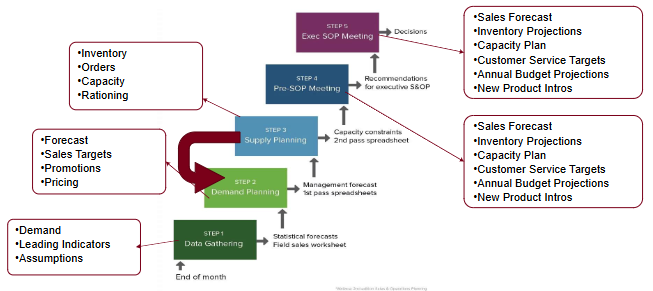
The Monthly S&OP Process
S&OP Structural Decisions
Who are the S&OP players?
How many product families?
What’s the appropriate unit of measure for
each product family?
Who are the S&OP Players?
• Executive champion/sponsor– senior executive
• S&OP process owner– director of sales administration, demand manager,
materials manager, sales manager, production control manager
• Demand planning team– demand manager, product manager, forecast
analyst, sales manager, salesperson, customer service manager, sales
administration manager, new products coordinator, and S&OP process owner
• Supply planning team– plant manager, materials manager, purchasing
manager, master scheduler, distribution manager, production control
manager, new products coordinator, and S&OP process owner
• Pre-S&OP team– demand manager, materials manager, customer service
manager, forecast analyst, product manager, master scheduler, plant
manager, purchasing manager, controller, new product coordinator, and SIOP
process owner
• Executive S&OP team–upper management representative of each functional
area
S&OP and Communication
The plan must be expressed in
terms that are meaningful to non-
manufacturing executives
The operations portion of the plan
must be stated in terms that
manufacturing functions can use
Communicating S&OP Information–
Displays
Information can be
conveyed in several ways:
Charts (monthly forecast,
cumulative production,
alternative plans)
Tabular displays (easily
captured and
communicated using
spreadsheets)
S&OP Keys to Success
Data integrity
Widely understood and transparent process
Active participation from various parts of the organization
Great communication – especially when something changes or there’s a problem
Top management involvement is imperative in the S&OP process. The S&OP process should relate directly to the strategic plan.
Top Management Role
Commit to the S&OP process
Modify performance measures and reward structures to align with the plan
Force resolution of trade-offs between functions
Lead the cultural change
Functional Roles
What is the
primary
responsibility of
each department
given the
S&OP?
• Hit the plan
And what is the
second most
important
responsibility?
• Communicate
when something
will prevent hitting
the plan
Forecasting
he process of predicting a future event
All forecasts are wrong, but some are useful
knowing demand enables firms to match supply
• Forecasting is crucial to business decisions
capacity, scheduling, inventory, advertising, etc
Function of a Forecast
• Marketing: Planning of promotions and pricing
• Operations: Planning of production and procurement, selecting
suppliers, determining capacity requirements, managing inventory
• Strategy: Planning of business expansion/contraction
• Finance: Cash flow planning; coordination with investors,
budgeting
• Human Resources: Hiring/layoffs, seasonal recruiting, training
Forecast Horizon
• Strategic planning (Plan the system)
Generally involves long-range plans related to:
Types of products and services to offer
Facility and equipment levels
Facility location
• Tactical planning (Plan the use of the system)
Generally involves short- and medium-range plans related to:
Inventory management
Workforce levels
Purchasing
Production
Budgeting
Scheduling
Time Series
chronologically ordered data that may contain one or more components of demand
• The key idea about time series analysis is that past demand
contains substantial information about future demand
• Forecast based only on past values
assumes that factors that influenced past will continue to influence
future
Time-Series Decomposition
Average demand: An ‘average’ around which observations
vary.
Trend: A predictable increase or decrease in the level over time.
Seasonality: A pattern of predictable and recurring shifts in the
level.
Random Noise: Unpredictable variations in the demand
pattern.
The Causes of Seasonality
• Annual Seasonality
Insurance enrollments
Weather effects
• Quarterly Seasonality
Textbook purchases
• Monthly Seasonality
End-of-the month/Payday Effects
• Weekly Seasonality
Weekend shopping/outdoor
• Daily Seasonality
Lunch/End-of-Workday Effects
Forecasting Notation
•At : Demand observed in period t
•Ft : Forecast of demand for period t
i.e. forecast of next period’s demand : Ft+1
Simple Moving Average
• is a series of arithmetic means
• useful when demand is neither growing nor declining rapidly
• does not forecast trend or seasonality well
• requires much historical data
• how to select n (the period length)?
Longer periods provide more smoothing (less responsive)
Shorter periods react to trends more quickly (more responsive)
Weighted Moving Average
• Simple moving average formula implies equal weighting for all
periods
• Weighted moving average permits unequal weights on prior
demand
• When a detectable trend or pattern is present, weights can be
used to place more emphasis on recent values
• The assignment of weights rely on expertise/intuition
• The sum of the weights must be equal to 1
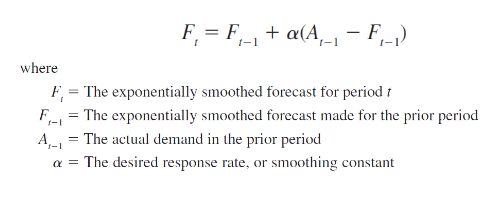
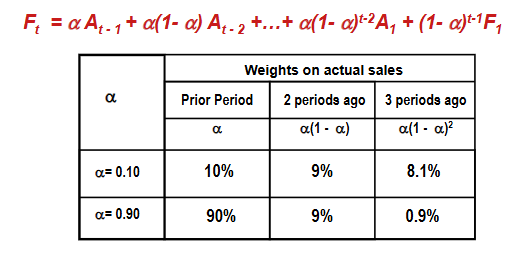
Exponential Smoothing
• A sophisticated weighted moving average forecasting
method
weights decline exponentially
most recent data are weighted most
• The most used of all forecasting techniques
• Well accepted for six reasons
Exponential models are surprisingly accurate
Formulating an exponential model is relatively easy
The user can understand how the model works
Little computation is required to use the model
Computer storage requirements are small
Tests for accuracy are easy to compute
Exponential Smoothing (Formula)
• Requires smoothing constant (𝛼)
ranges from 0 to 1
subjectively chosen to reflect responsiveness
Forecast Effects of Smoothing Constant
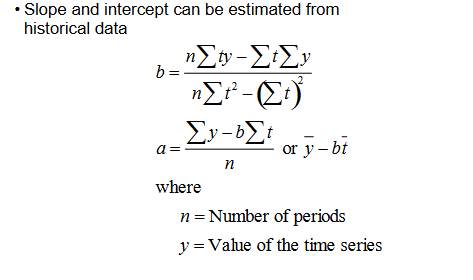
Regression Analysis
Regression identifies a relationship between two or more correlated variables by fitting a line to a set of data points
• Simple linear regression - the simplest form of regression that involves a linear relationship between two variables
Y = a + bX
• Y is value of dependent variable, a is the y-intercept of the line, b is the slope, and X is the value of the independent variable
Linear Trend
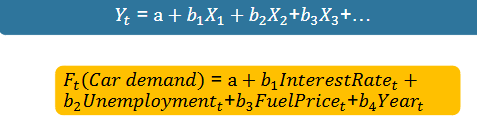
Multiple Linear Regression
Often, more than one independent variable may be a valid
predictor of future demand
•In this case, the forecast analyst may utilize multiple regression.
•Analogous to linear regression analysis, but with multiple independent
variables.
•Multiple regression supported by statistical software packages.
Dealing with Components
Option 1
• Estimate demand components separately (this is useful if
components are very stable)
1) Only Trend- Already covered in linear regression !!!
2) Only Seasonality
3) Both trend and seasonality: Compute trend on seasonalized data
4) Both trend and seasonality: Compute trend on deseasonalized data
Option 2
• Use forecasting methods that model components explicitly
(this is useful if components are not very stable)
• e.g.: Trend-adjusted exponential smoothing
Example-1: Only Seasonality
1. Calculate seasonal index
2. Forecast demand using known
methods (Moving average,
exponential smoothing, etc.)
3. Adjust forecast for seasonality
using seasonal index
• The seasonal index is the ratio of the amount sold during each season divided by the average for all seasons.
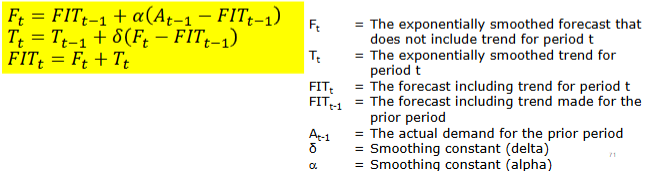
Trend-Adjusted Exponential Smoothing
• An trend in data causes the exponential forecast to always lag the actual data
• Can be corrected somewhat by adding in a trend adjustment
• To correct the trend, we need two smoothing constants
Smoothing constant alpha ()
Trend smoothing constant delta (δ)
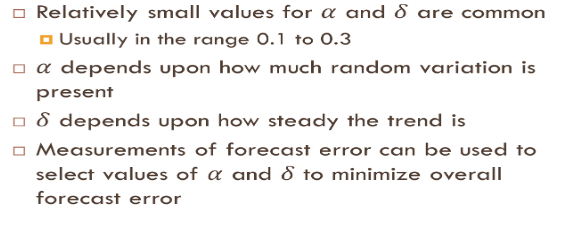
Choosing Alpha and Delta
Forecast Errors
• Forecast error is the difference between the forecast value and
what actually occurred.
Forecast Errort = Demandt – Forecastt
et = At – Ft
• All forecasts contain some level of error.
• Sources of error
Bias – when a consistent mistake is made
Random – errors that are not explained by the model being used
Accuracy is the magnitude of difference between actual and forecast demand
Bias is a systematic pattern of over-forecasting or under-forecasting demand
Mean Absolute Error (MAE)
The MAE is sometimes also
referred to as MAD, i.e. Mean
Absolute Deviation
Easy to use; gives you a
measure of how many units you
are off, on average
Mean Squared Error
(MSE)
The square root of this gives you something similar to a standard deviation of a forecast error
Forecast Accuracy
100% - MAPE
Facilitates cross-time series comparisons due to
adjustment of scale – however, does not work for
intermittent demand, and can be very skewed for low
demand items.
Choosing a Forecasting Method
• No single technique works in every situation
You want to achieve:
• No pattern or direction in forecast error
Error = (At - Ft) = (Actual - Forecast)
Seen in plots of errors over time
• Smallest forecast error
Mean square error (MSE)
Mean absolute deviation (MAD)
Mean absolute percentage error (MAPE)
Managing Inventory
• Inventory: the stock of any item or resource used in an organization
Includes raw materials, finished products, component parts, supplies, and work-in-process
A typical firm has roughly 30% of its current assets and as much as 90% of its working capital invested in inventory
• Inventory system: the set of policies and controls that monitor levels of
inventory
Determines what levels should be maintained, when stock should be replenished, and how
large orders should be
Why Carry Inventory?
Anticipation stock …to meet anticipated demand
• Seasonal inventories …to smooth production requirements
• Safety stock …to protect against stock-outs (risk in demand)
• Pipeline inventory (WIP) …to maintain independence of operations (risk in supply)
• Cycle stock …to take advantage of order cycles, exploiting economies of scale
• Hedging inventory …to help hedge against price increases…to take advantage of quantity discounts
Why Not Carry Inventory?
• Inventory = stacks of money sitting on forklifts, on shelves, and in trucks and
planes while in transit
• For many businesses, inventory is the largest asset on the balance sheet at
any given time
• Inventory can be difficult to convert back into cash
• It is a good idea to try to get your inventory down as far as possible
The average cost of inventory in the United States is 30 to 35 percent of its value
Objective of Inventory Control
• Inventory management has two main concerns:
Level of customer service (Having the right goods available in the right quantity in the right
place at the right time)
Costs of ordering and carrying inventories
Key Inventory Terms
Lead Time: time interval between ordering & receiving an order
• variability ↑ additional stock to reduce risk of shortage between deliveries
Holding (Carrying) Costs: cost to carry an item in inventory for a
length of time
• interest/taxes, insurance, depreciation, obsolescence, deterioration, spoilage,
pilferage, breakage, warehousing, opportunity cost…
Percentage of unit price (e.g., 20% – 40%)
Example: $100 item in inventory for 1 year costs $20 – $40
Dollar amount per item
(Fixed) ordering cost / Set up cost: → that does NOT depend on
quantity
• preparing invoices, shipping, inspecting quantity & quality, moving goods to
temporary storage / machine adjustments, changing cutting tools
Shortage/stockout costs: costs when demand exceeds supply
(difficult to measure objectively)
• Opportunity cost of not making sale, loss of customer goodwill, late charges
• Lost production or downtime
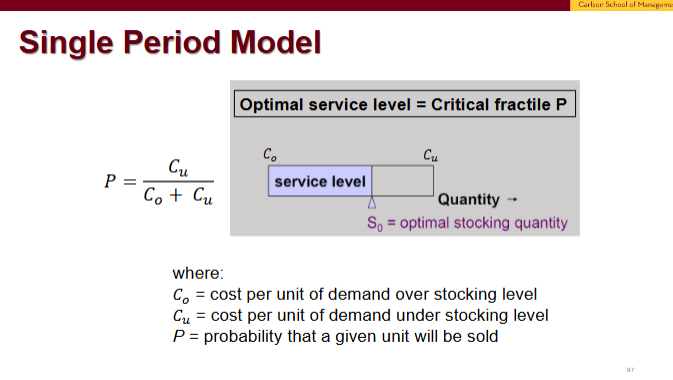
Single Period Inventory Model
GOAL: identify order quantity that
minimizes lost sales and unsold
inventory
Consider the problem of deciding how
many newspapers to put in a hotel lobby
Demand is uncertain (i.e. stochastic)
Solving Single Period Model
• Assume we want an 80 percent
chance of not running out (i.e.
service level: probability that
demand will not exceed supply)
• Assume that the probability
distribution of sales is normal with
a mean of 90 lbs and a standard
deviation of 10 lbs
• Stocking 90 lbs yields a 50
percent chance of stocking out
Economic-Order Quantity Model
AKA: Reorder point systems (ROP), Continuous review systems
Economic Order Quantity (EOQ)
• Assumptions:
One product
Demand is known and stable
Lead time is known and constant
Price per unit is constant (no quantity discount)
All demand is satisfied (No backorder or shortage)
Trade-off between inventory carrying cost and
ordering costs is modeled
Economic Order Quantity Model (order size)
Questions
• When to order from
the supplier?
• How much to
order?
Objective
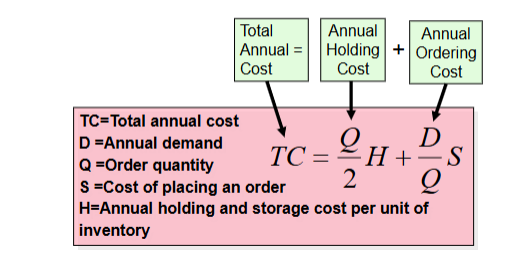
• Minimize total
annual cost
• Frequent orders
Small size
Incur fixed cost frequently
Low average inventory level
• Infrequent orders
Large size
Incur fixed cost infrequently
High average inventory level
Economic Order Quantity Model Total Cost
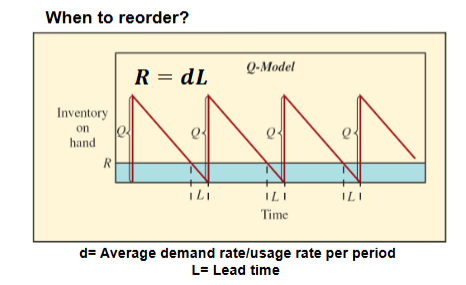
Economic Order Quantity Model When to Reorder
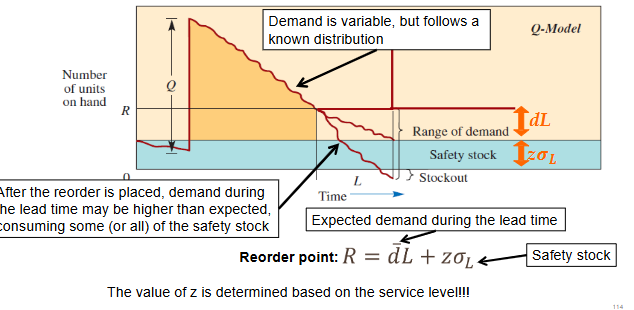
Stochastic Inventory Control
• Recall when demand is deterministic
reorder point R = dL
However, the demand is often uncertain, therefore the R needs to be re-considered
• Use safety stock (SS) to tackle uncertainty
• Safety stock: the amount of inventory carried in addition to the expected
demand
deterministic demand requires no SS
higher service level requires more safety stock
desired service level helps us determine the optimal size of safety stock
Stochastic Inventory Control (models)
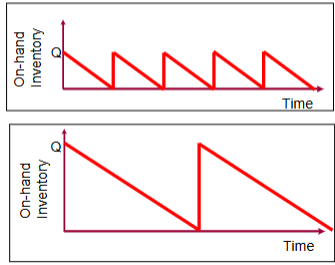
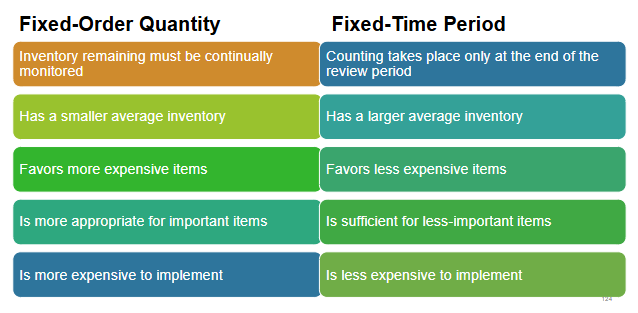
• Fixed Order Quantity Model
an order of a fixed quantity Q is placed every time the inventory falls
below a reorder point R
event-triggered
Continuous review
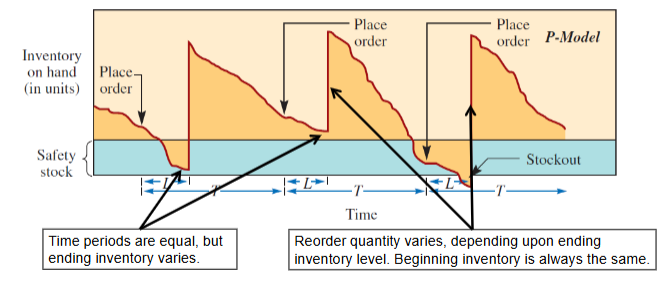
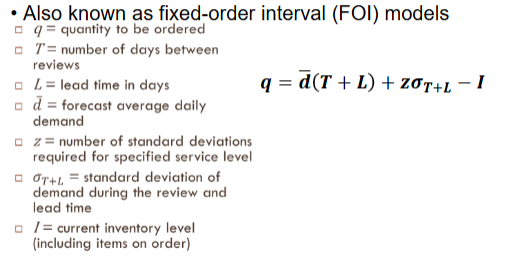
• Fixed Time Period Model
A quantity that depends on the current inventory level is ordered (order
up to a target level)
time-triggered
Periodic review
Fixed Order Quantity (FOQ) Model
Fixed Time Period (FTP) Model
Fixed Time Period (FTP) Model (formula)
Multi-Period Models – Comparison
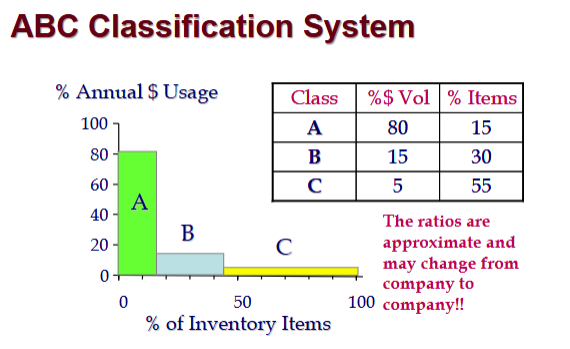
ABC Classification System
• A-B-C approach
Classifying inventory according to some measure of importance, and allocating control efforts accordingly
A items (very important)
10 to 20 percent of the number of items in inventory and about 60 to 70 percent of the annual dollar value
B items (moderately important)
C items (least important)
50 to 60 percent of the number of items in inventory but only about 10 to 15 percent of the annual dollar value