QMB 3602 Exam 3 UCF
1/101
There's no tags or description
Looks like no tags are added yet.
Name | Mastery | Learn | Test | Matching | Spaced | Call with Kai |
|---|
No analytics yet
Send a link to your students to track their progress
102 Terms
provide meaningful insights to help guide management's decisions
The purpose of linear programming is to...
the constants in the functional constraints and objective function (coefficients or right side values)
Parameters of a linear programming model are...
False, most important insights are made after finding the optimal solution
(T/F) You conduct what-if analysis before finding the optimal solution.
What-if Analysis
addresses what would happen to the optimal solution if different assumptions are made about future conditions
Benefits of What-if Analysis
- it allows us to see which parameters are sensitive
- it allows us to perform a sensitivity analysis
- it can provide insight about managerial decisions
Sensitive Parameters
parameters in which small changes affect the optimal solution
Sensitivity Analysis
the part of what-if analysis that focuses on individual parameters and how sensitive the optimal solution is to changes in them
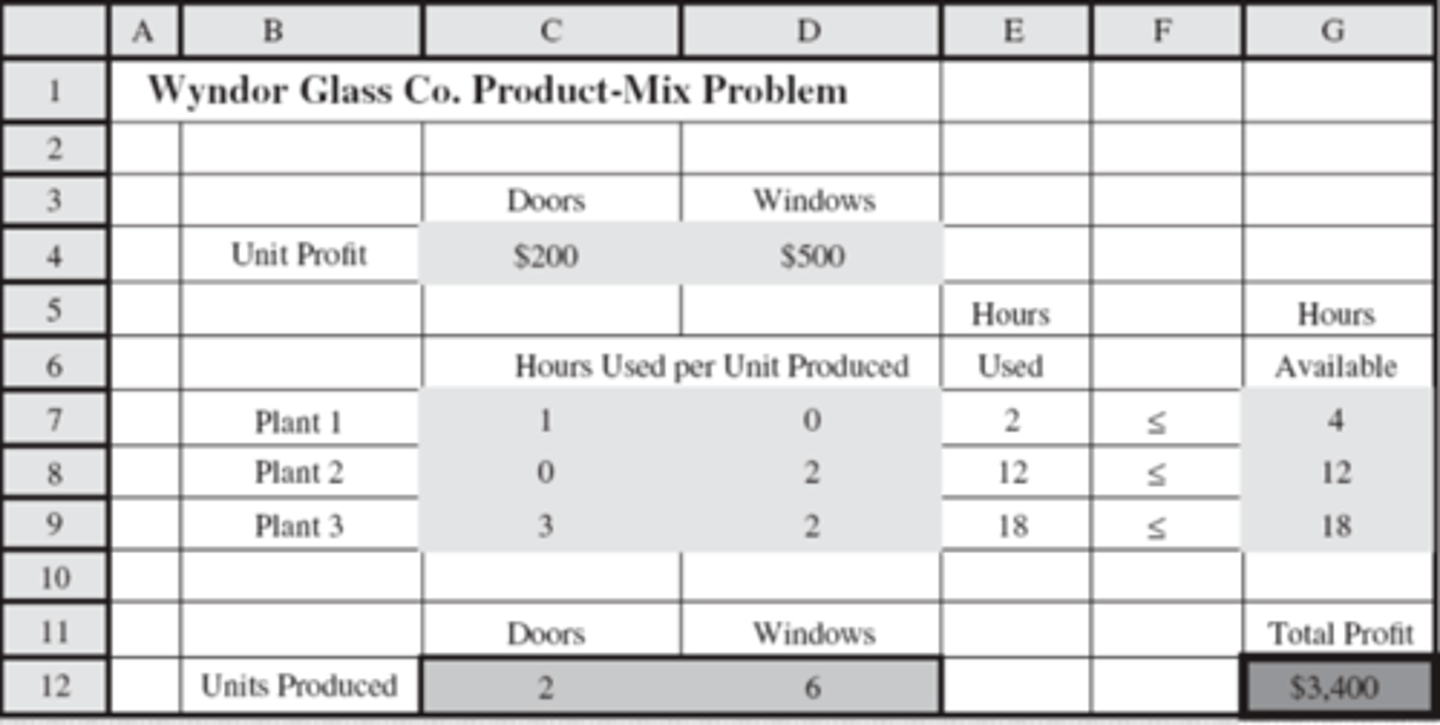
G7, G8, G9
Which cells in this spreadsheet represent management decisions?
Explanation:
These are usually limits placed by management, what if analysis can tell us how changing those limits will impact the business

C12 and D12
Which cells contain the optimal solution?
What 4 types of changes can what-if analysis consider?
- The effect of SINGLE changes in objective function value
- The effect of SIMULTANEOUS changes in objective function values
- The effect of SINGLE changes in a constraint
- The effect of SIMULTANEOUS changes in constraints
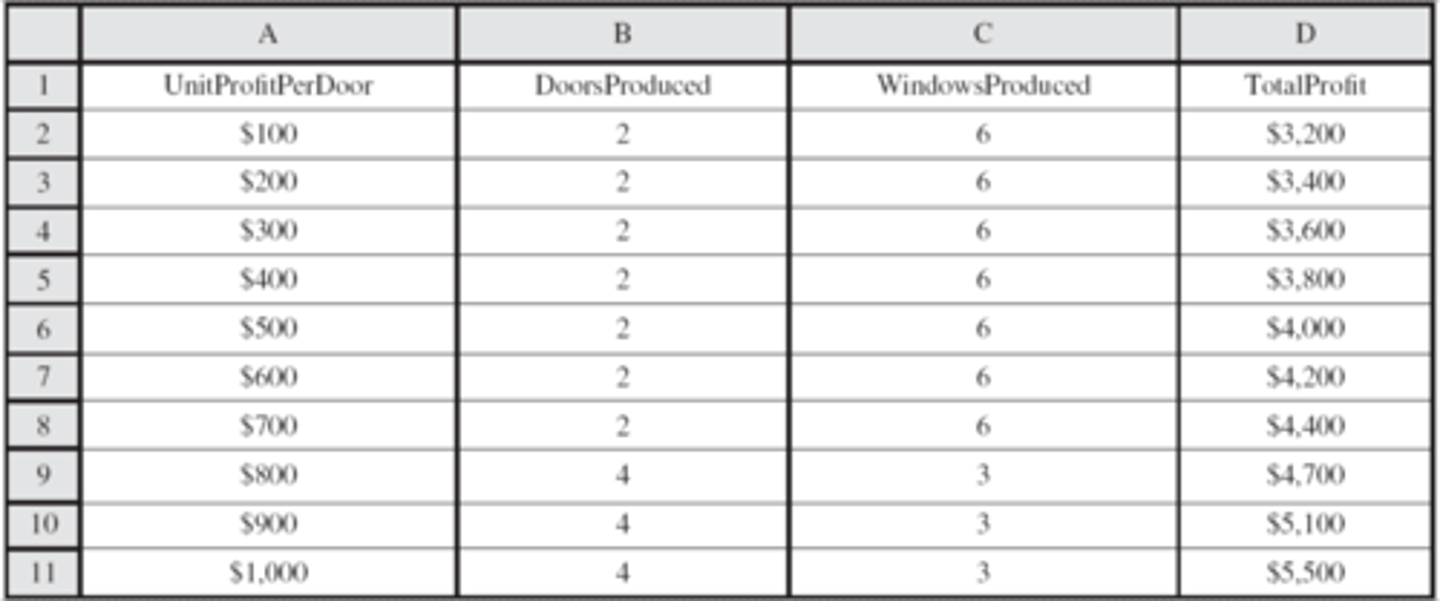
parameter analysis report
This is an example of a
True
(T/F) An allowable range report is the same as a sensitivity report
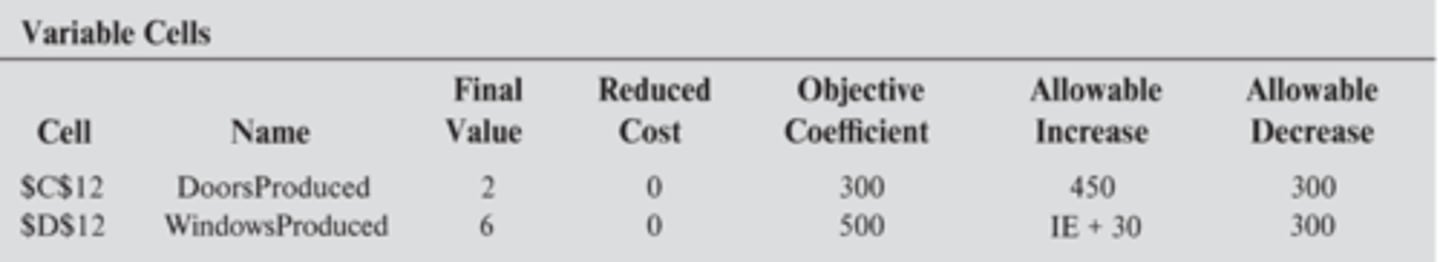
sensitivity/allowable range
This is an example of a ________ report
The 100% Rule
- Step 1: if simultaneous changes are made in the coefficients of the objective function, calculate the % of allowable change for each.
- Step 2: If sum ≤ 100%, the original solution is definitely still optimal
True
(T/F) Under the 100% rule, it is possible for the original solution to be optimal even if the sum is > 100%
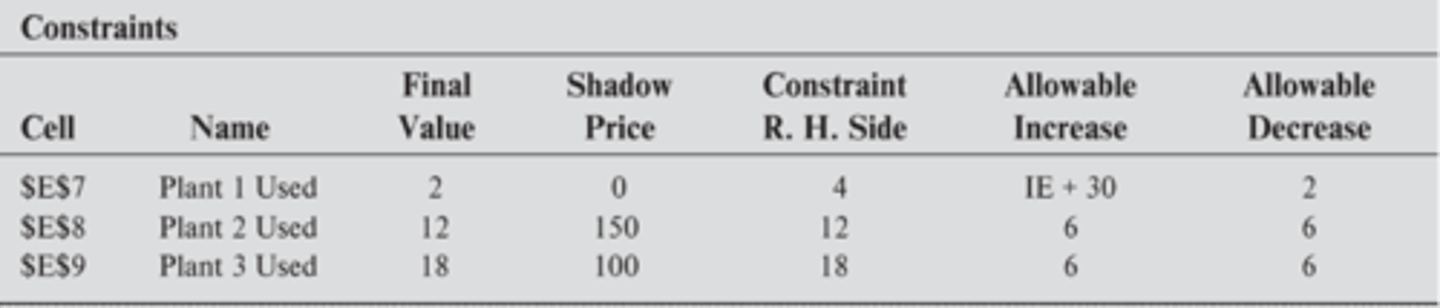
Shadow Price
the rate at which the optimal value (total profit) can be increased by increasing the right side values (constraint)
Note:
a__ __ is valid if the right side values are within their allowable range

Right side values(constraints)
This is the allowable range for what type of values?
The 100% Rule (right sides)
Step 1: Calculate the percent of allowable change for the right side
Step 2: If the shadow prices do not exceed the allowable range AND the sum of percent’s is ≤ 100%, the shadow prices are definitely still valid
to minimize the cost of the flow on arcs
What is the objective of a minimum cost flow problem?
network
This diagram is a representation of a ________

nodes
The shaded circles on the diagram are ______

arcs
The arrows in the diagram are called
Note:
Each arc has a capacity which is the maximum amount of flow allowed through it

F1 and F2
Which nodes are supply nodes?

W1 and W2
Which nodes are demand nodes?
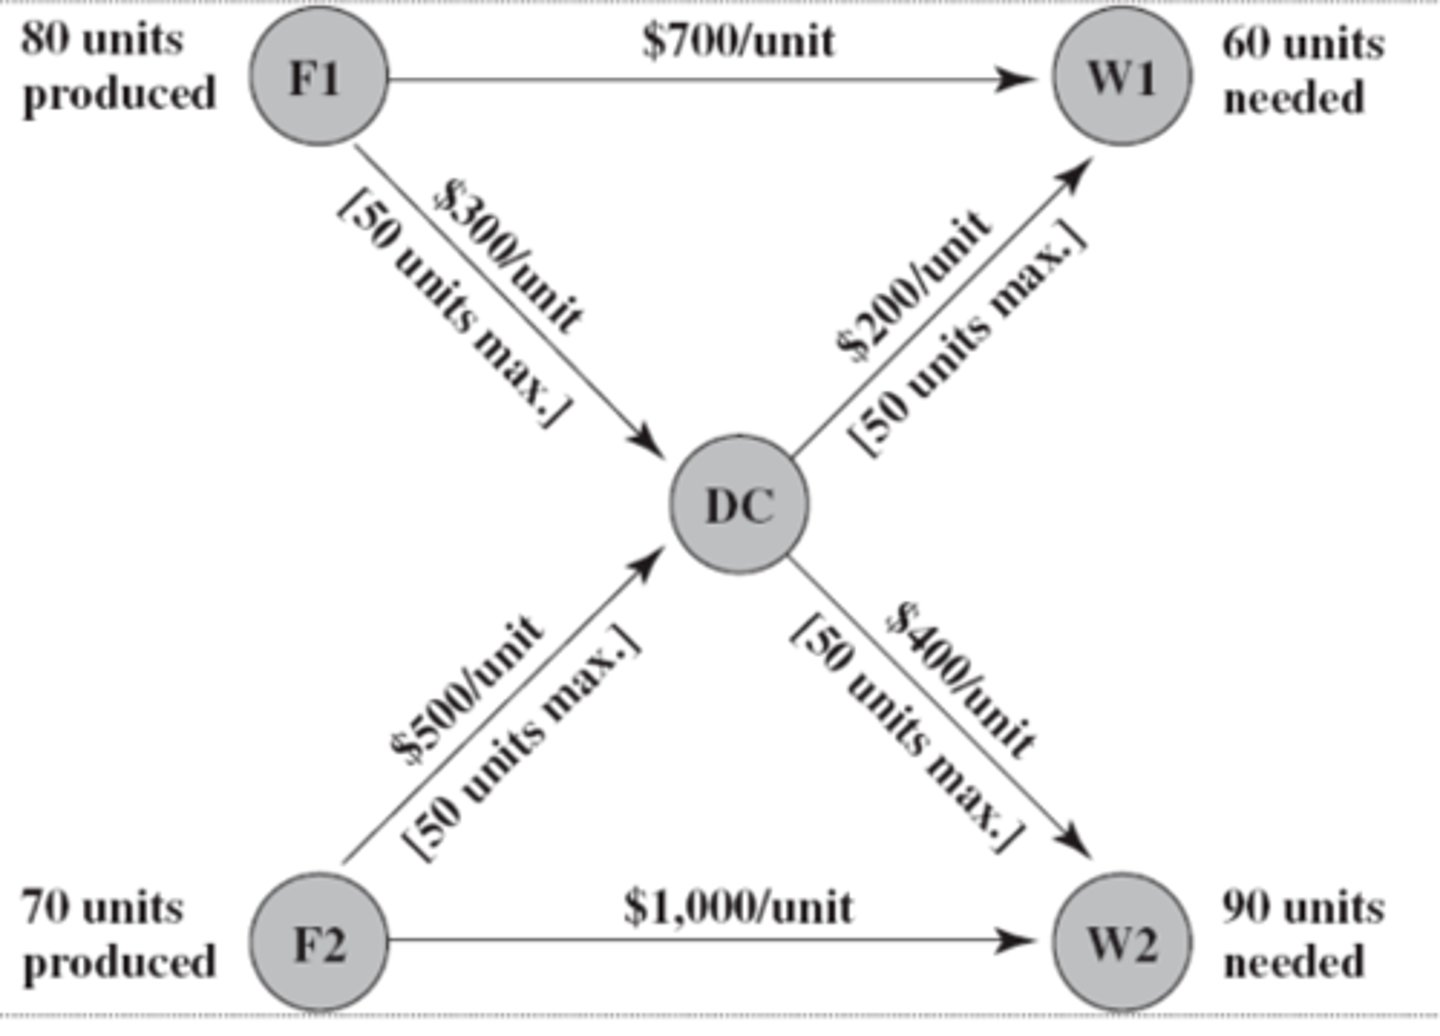
Yes, DC
Are there any transshipment nodes?

Transshipment Nodes
- can both send and receive from other nodes in the network
- transshipment nodes posses conservation of flow which means that the flow out is equal to the flow in
Assumptions of a Minimum-Cost Flow Problem
- At least one of the nodes is a supply node
- At least one node is a demand node
- All the remaining nodes are transshipment nodes
- Flow through an arc is only allowed in the direction of the arrow
- The network has enough arcs with sufficient capacity for all demand and supply nodes
- The cost of flow through each arc is proportional to the amount of flow
- The objective is to minimize total cost and maximize total profit
Feasible Solutions Property
Book Definition:
states that a minimum cost flow problem will have feasible solutions only if supply node total = demand node total
Professor Definition:
states that there will always be a solution when you use solver, assuming you set it up correctly
Integer Solutions Property
Book Definition:
As long as all the supplies demands and arc capacities have integer values, any minimum-cost flow problem with feasible solutions is guaranteed to have an optimal solution with integer values for all its flow quantities
Professor Definition:
states that the solution you get from solver will always be an integer
False, network simplex can solve much larger minimum cost flow problems than solver
(T/F) Solver can solve much larger problems that the network simplex method
Special types of minimum cost flow problems:
1. transportation problems (from exam 2)
2. assignment problems (from exam 2)
3. transshipment problems (from exam 2)
4. maximum flow problems (module 9)
5. shortest path problems (module 9)
Transportation Problems
- Minimizing the cost of shipping something from the source directly to the destination
- It is basically a minimum cost flow problem with no transshipment nodes
Assignment Problems
- Involves assigning people (or other operational units) to a group of tasks where each unit performs a task
How it works:
- Each unit or person is a supply node = 1
- Each task is a demand node = 1
Transshipment Problems
- Is just a minimum cost flow problem that has unlimited capacities for all its arcs
objective of a maximum flow problem
- The objective is to find a flow plan that maximizes the amount of flow through the network (rather than minimizing the cost of the flow)
maximum flow
This diagram represents a _____ _______ problem
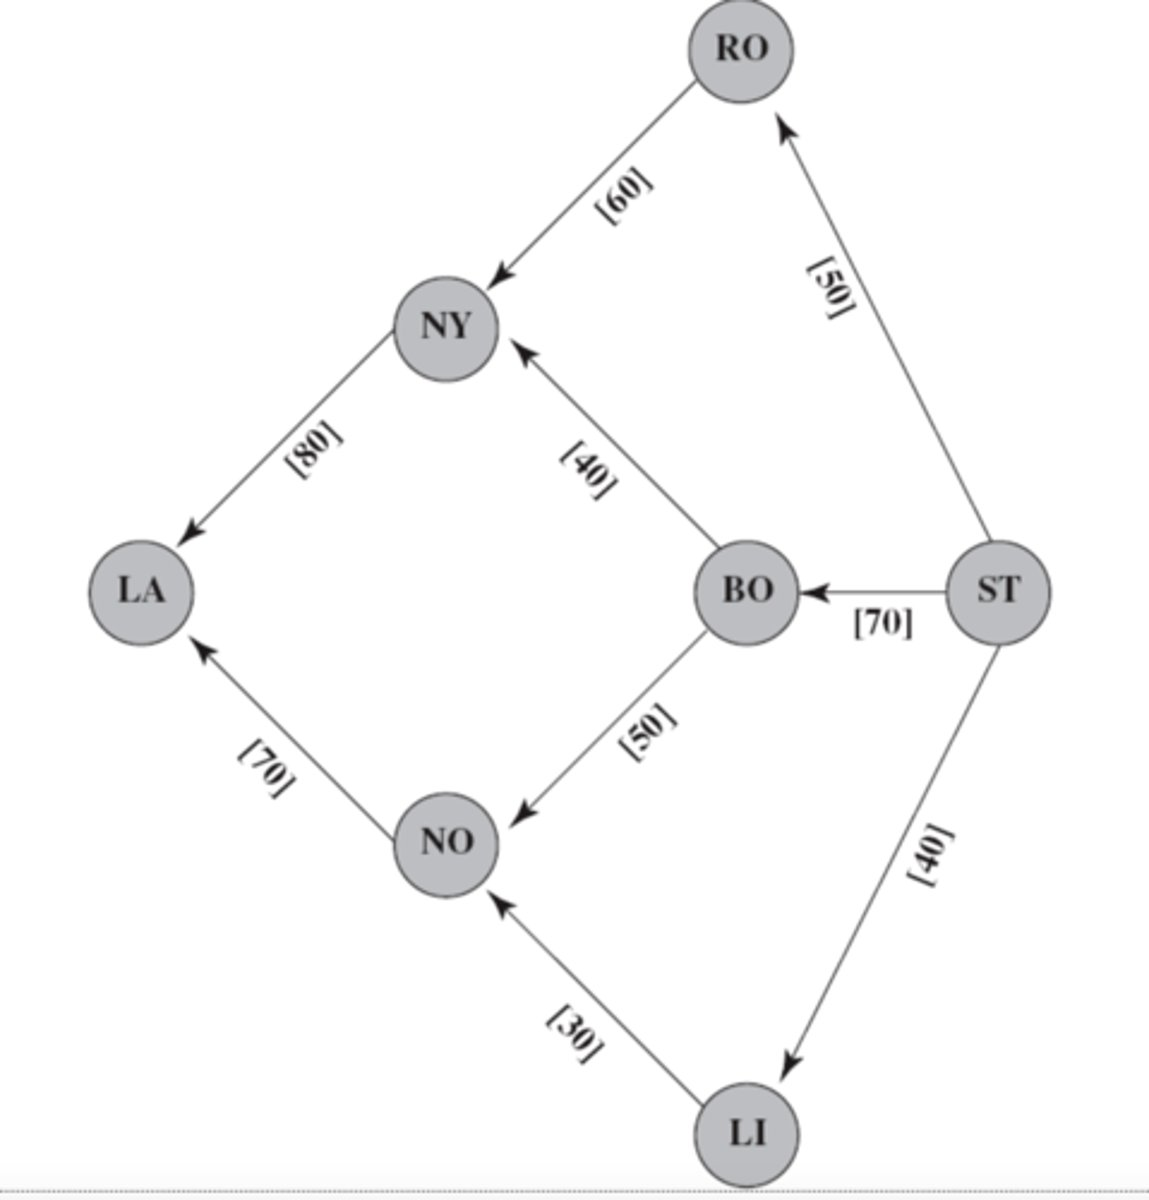
Assumptions of a max flow problem:
- All flow through the network originates at one node called the source and terminates at one node called the sink
- All the remaining nodes are transshipment nodes
- Flow is only allowed in one direction
- At the source, all arcs point away from the node
- At the sink, all arcs point toward the node
- The objective is to maximize the total amount of flow from the source to the sink
- Measured by amount leaving the source OR the amount entering the sink
- Source = supply node, generates flow
- Sink = demand node, absorbs flow
- Source and sink do not have fixed supply or demand
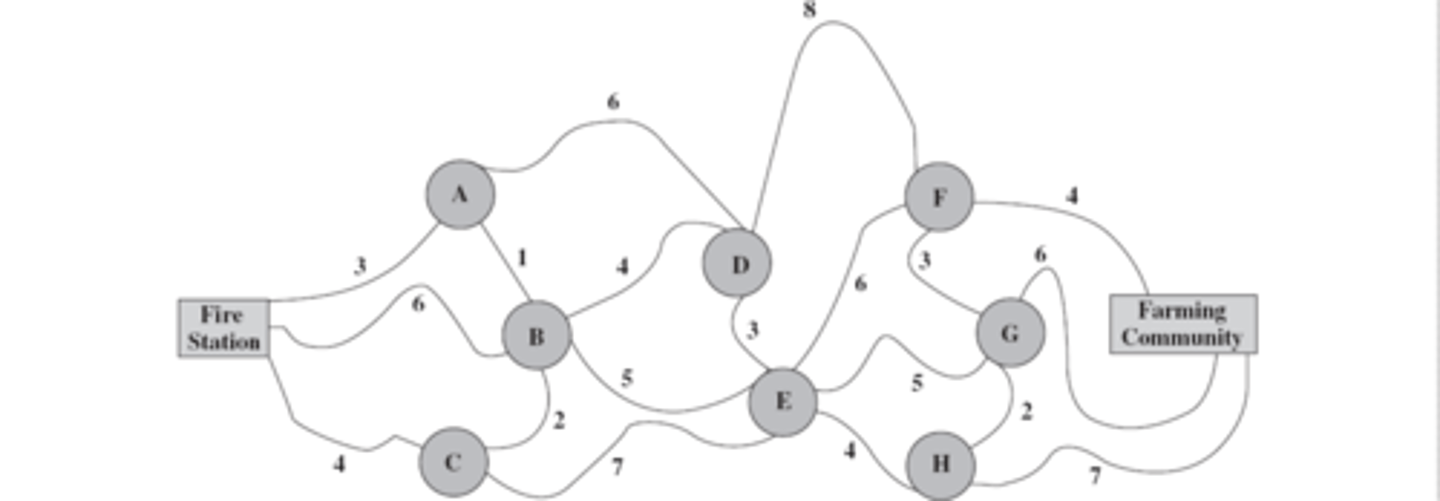
Shortest Path Problem
used for finding the shortest path between 2 points
Links
links connect nodes in the network like arcs but are different because flow can travel either way
Shortest path problem assumptions
- the path through the network starts at a node called the origin and ends at a node called the destination
- Links and arcs are both allowed although its usually mostly links
- Associated with each link or arc is a positive number called its length (can be distance, cost, time, etc.)
- The objective is to find the shortest path (minimum total length) from the origin to the destination
Dummy Destination
A fictitious destination introduced into the formulation of a shortest path problem with multiple possible termination points to satisfy the requirement that there be just a single destination (idk if this is important)
shortest path
This diagram represents a _____ _____ problem
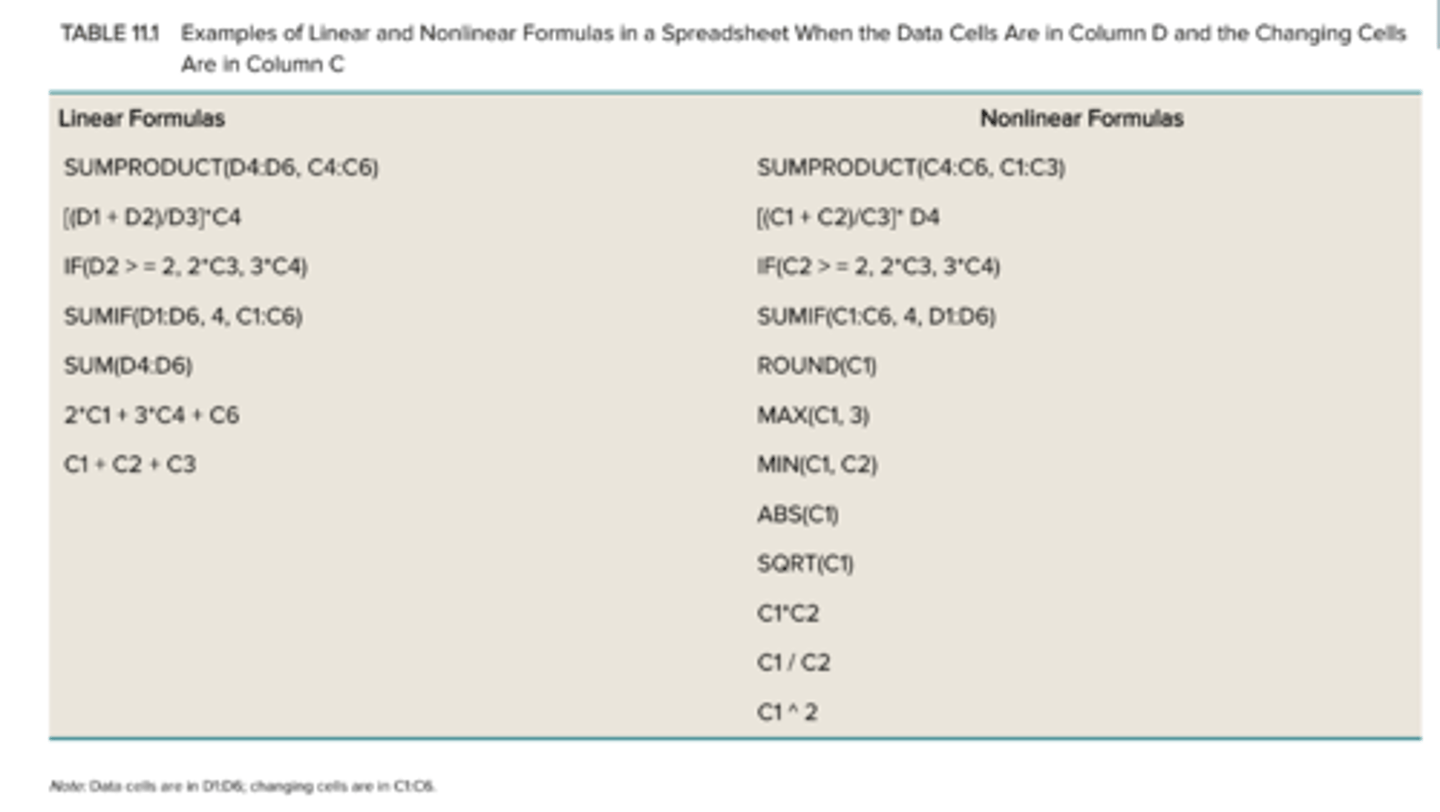
Nonlinear programming model
is one that has at least one nonlinear formula for an output cell
Nonlinear Formula
A formula becomes nonlinear if it ever multiplies, divides, or assigns an exponent to any changing cell
True
(T/F) Nonlinear programming often provides greater precision than linear programming for analyzing managerial problems
examine the output cells for nonlinear formulas
How do you distinguish between a linear programming model and a nonlinear programming model?
non-proportional, proportional
Nonlinear programming model = ________ relationship
Linear programming model = _______ relationship
True
(T/F) Constructing nonlinear formulas is considerably more difficult than developing linear formulas
linear
This is a ______ programming mode
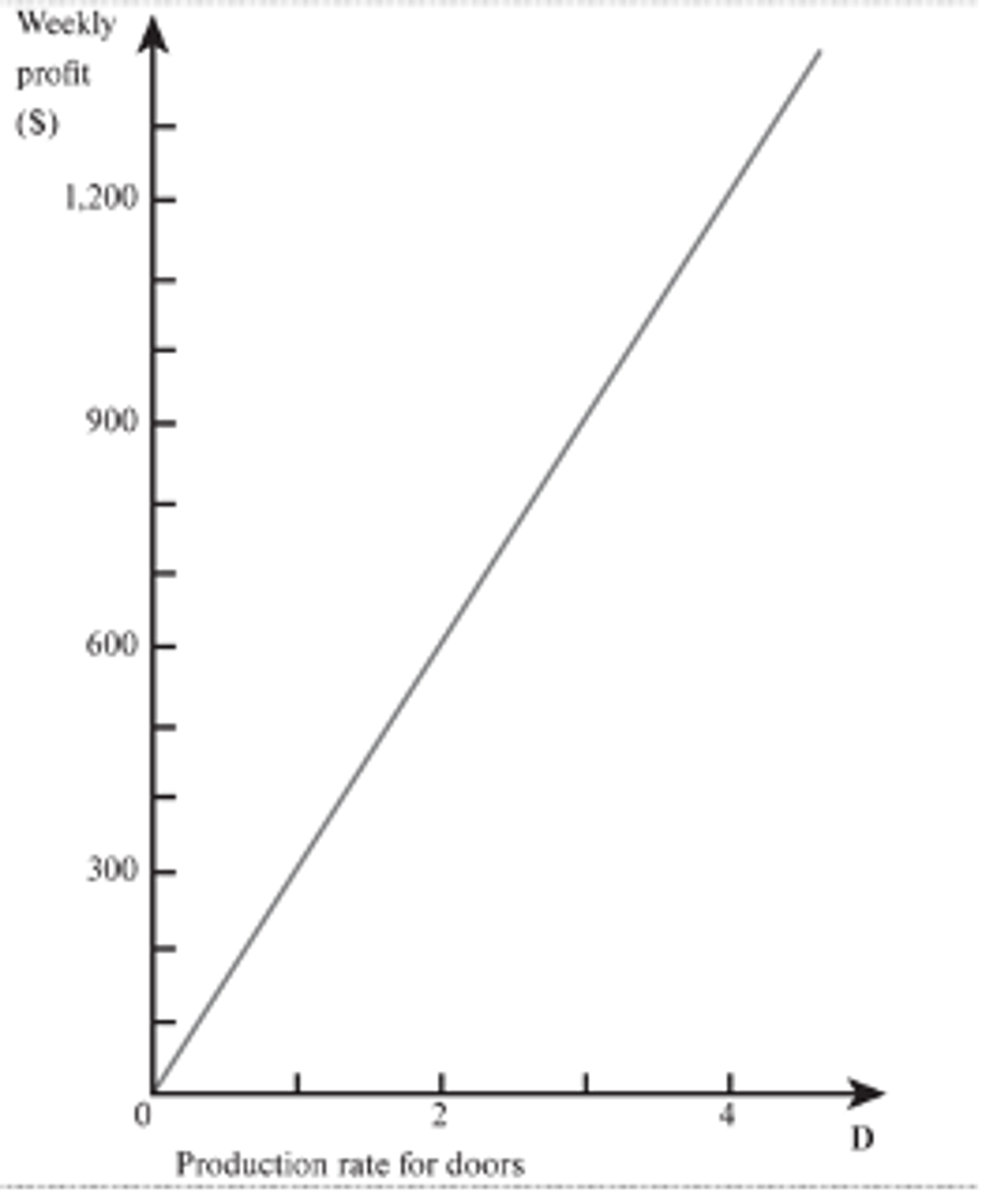
decreasing marginal returns
The top left graph shows ________ marginal returns
Note:
this is typical

Piecewise Linear
The top right graph is a ________ _________ graph
- consists of a sequence of line segments
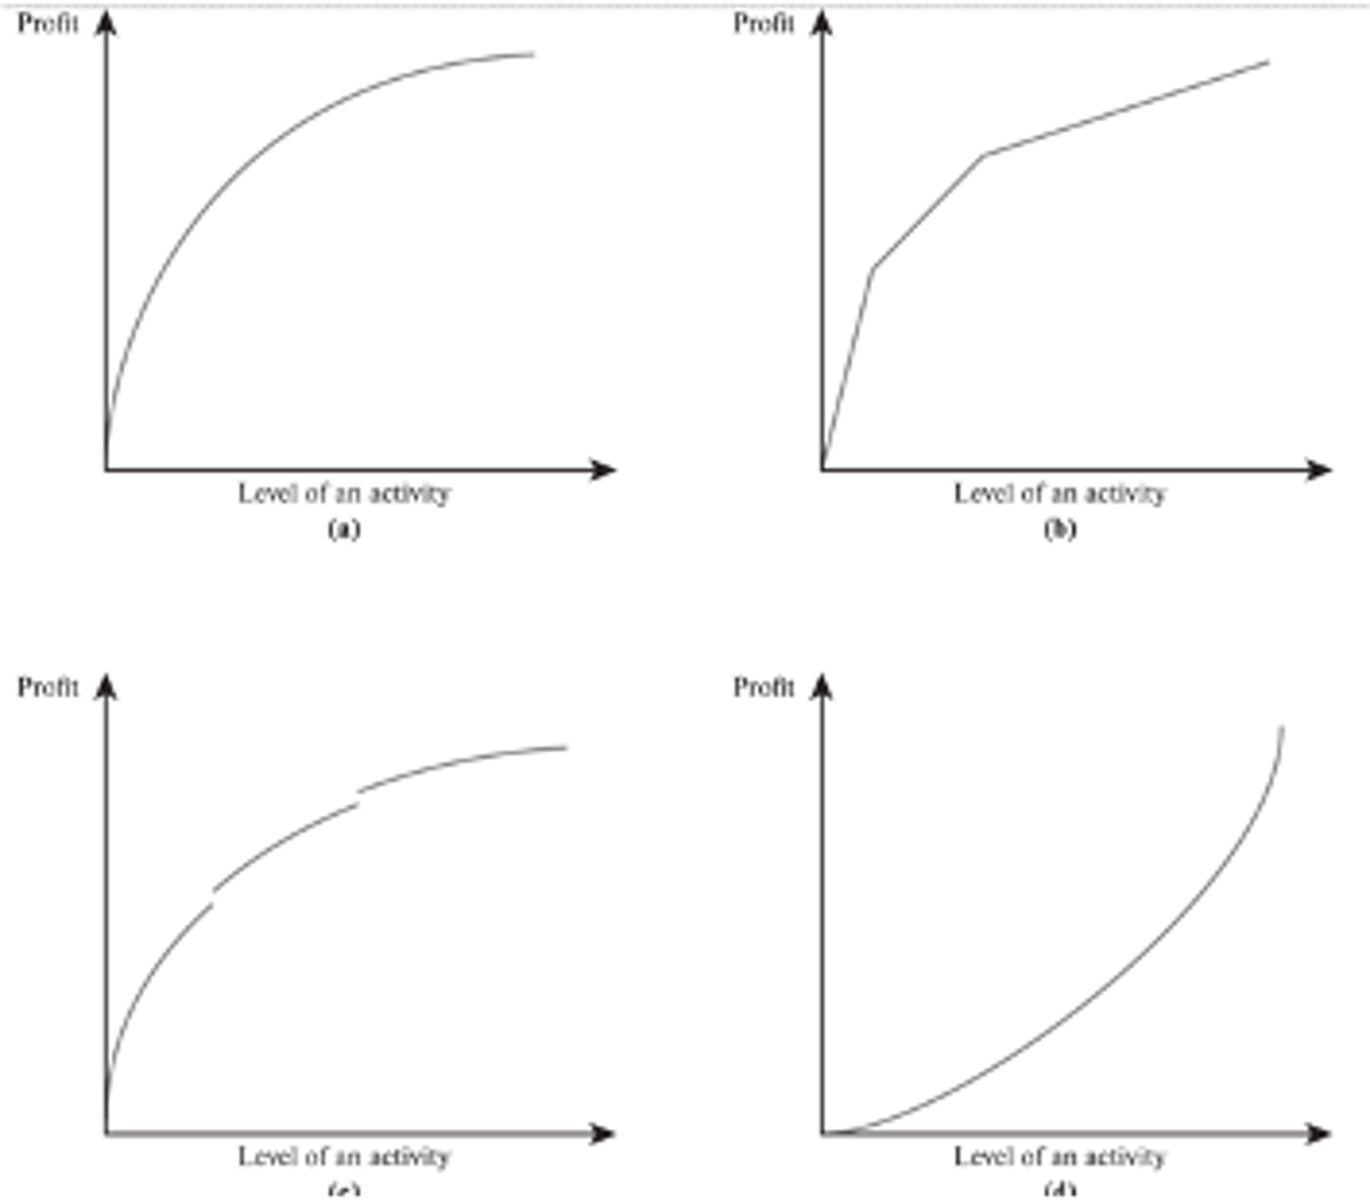
discontinuities
The breaks in bottom left graph are called ________
- spots in the graph where it is disconnected because it suddenly jumps up or down

increasing
The bottom right graph shows _________ marginal returns

Proportionality Assumption of Linear Programming
- this assumption tells us that the decision variable and objective function are proportional
- nonlinear programming problems arise when this assumption is violated
minimize
Cost graphs are used to ________ the cost of activities
maximize
Profit graphs are used to _______ profit
True
(T/F) It is possible for a model to be nonlinear even if the proportionality assumption is met
refer to photo
Examples of Linear and Nonlinear Formulas:
Research/Business Report
- refers to mechanism of delivery of the research findings insights and recommendations
- this includes things such as written or oral, physical, or electronic, etc.
Changes in reporting technology:
- Emphasis on reporting insights rather than sharing data or information
- Improved web-based features for reports
- Dominance of audience centric planning rather than data-centric planning
- Emergence of automation in some parts of the process
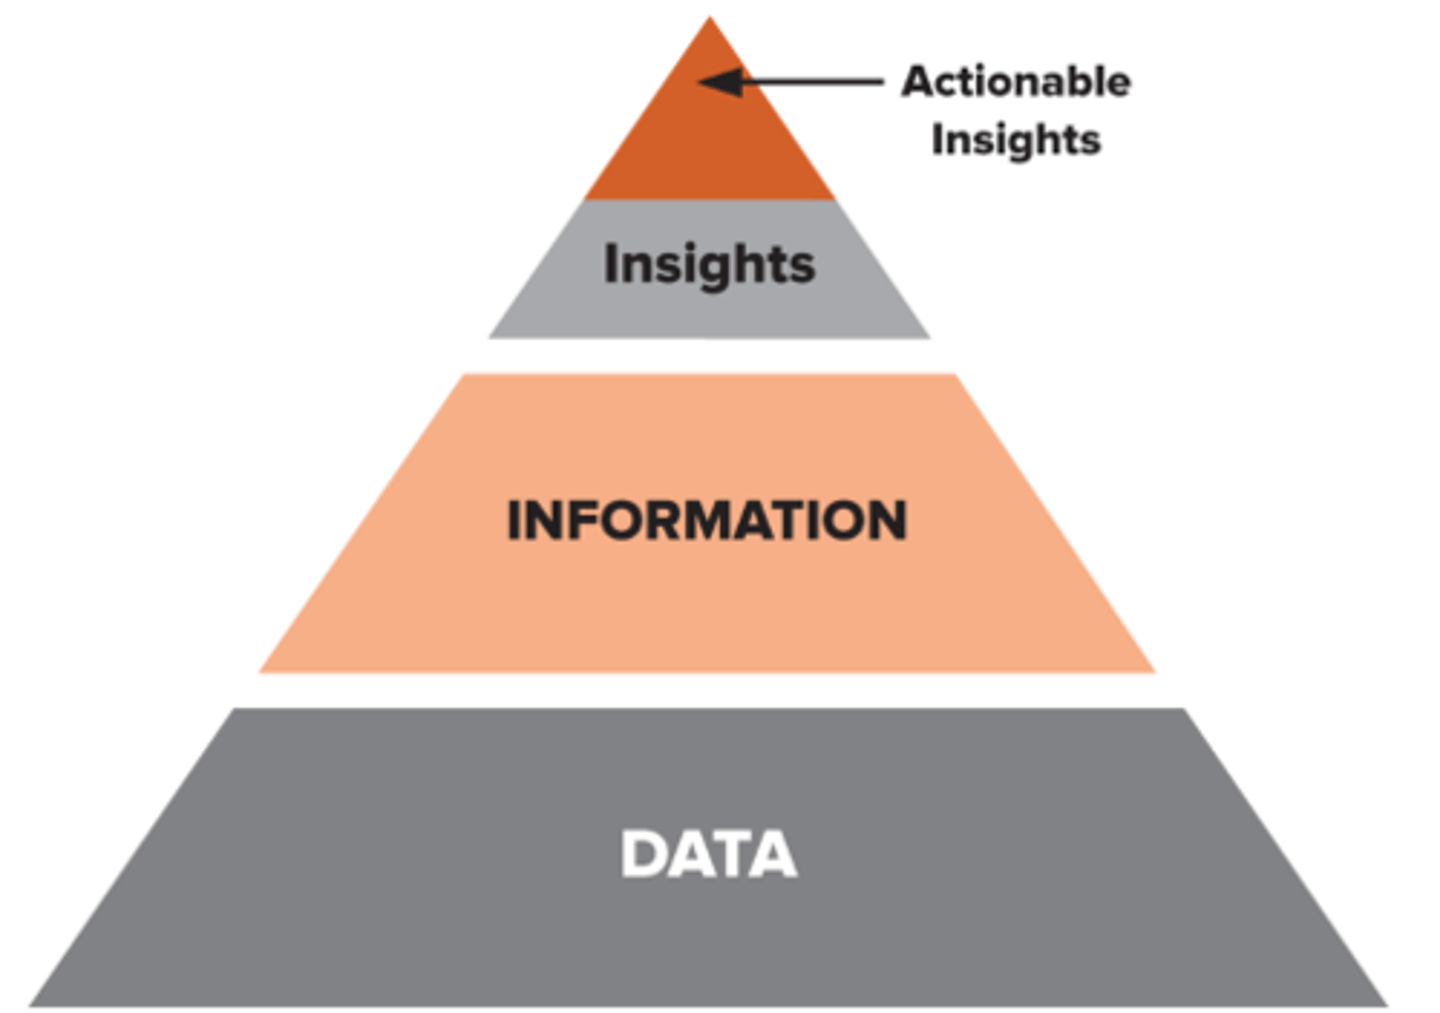
Information
data that has been processed
Data Visualization
developing a researcher's visual representation
Insights
conclusions generated by analyzing information
Actionable Insights
insights aligned with key business goals and strategies that lead to recommendations for specific decisions
Data Centric Planning
- A research report whose focus is on delivering as much data and insights as possible. The result is a factual and statistical presentation.
Audience Centric Planning
- A research report whose focus is on gaining the audience's support of the insights and recommendations. The result is a persuasive presentation that tells a story.
audience effect
Good researchers understand that the primary purpose of their report is to gain a desired ________ _______
Audience Analysis refers to
- An analysis of the expected audience for a research report
- Can be formal (interviews, surveys) or informal (conversations with others)
In audience analysis, the following is considered:
Audience Composition
Research Question Knowledge
Research Predispositions
Recommendation Effects
Audience Effect
Supplemental Purposes
Audience composition refers to
who will receive the report?
Research question knowledge refers to
what background does the audience have of the research?
Research dispositions refer to
the audience's beliefs about the topic before the presentation (selective perception)
- there are 5 types of biases under this category
Anchoring bias
audience relies on first impressions
Confirmation bias
an audience searches for info that supports what they already believe
Conformity bias
an audience relies on groupthink, does not express conflicting ideas for the purpose of group harmony
Survivorship bias
The audience tends to believe stories that resulted in success rather than failure
Loss Aversion bias
An audience's tendency to favor ideas that are expressed positively rather than negatively
Also to not want to lose money
Recommendation effects refer to
how might audience members be effected by the recommendations made?
Audience Effect refers to
what is the desired audience effect?
Supplemental purposes refer to
what other purposes must the report accomplish?
Written, Oral, Combo of both
3 Report Structures
Oral report
- Implies no written report
- Most provide some type of written material such as hand outs
Written report
- Allows the audience to digest the information at their own pace
- Can be weak due to lack of oral aspect
Written & Oral
- Greatest flexibility
- Most effective
Management Report
A report written for a non-technically oriented manager
Technical Report
A report written for an audience of researchers
4 Critical Components of Oral & Written Research Reports
Intro
Background
Methodology
Findings/Recommendations/Insights
**appendices may be included for written reports but the 4 above are essential to both**
A proper intro should
prepare the audience
establish credibility
have descriptive title
have a concise summary
A proper background section should
- Provide audience with knowledge needed to interpret research findings
- Establish credibility for the researcher
- Establish validity of the findings
A proper methods section should
- summarize the design and provide a margin of error
- include the limitations of the project in this section
A proper results section should
use the process in the picture
Data → Info → Insights → Actionable Insights → Recommendations
this is the largest section of any report

False, only written
(T/F) Appendices may be used in oral reports
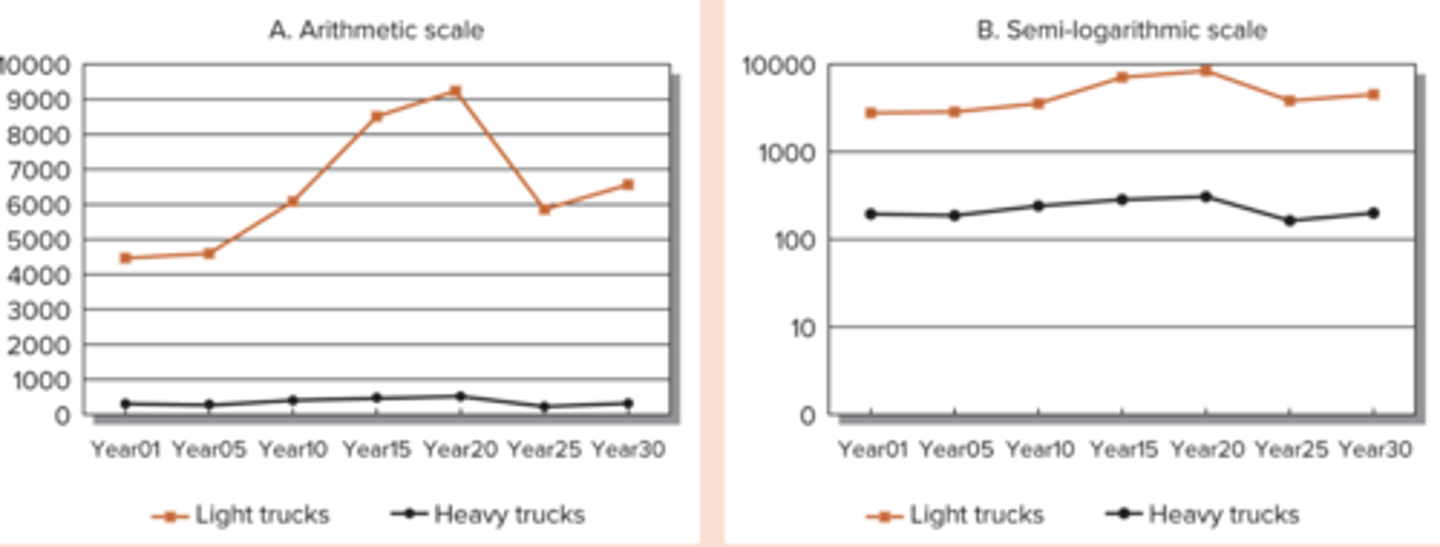
Line Graph
used to display the same data at different points in time
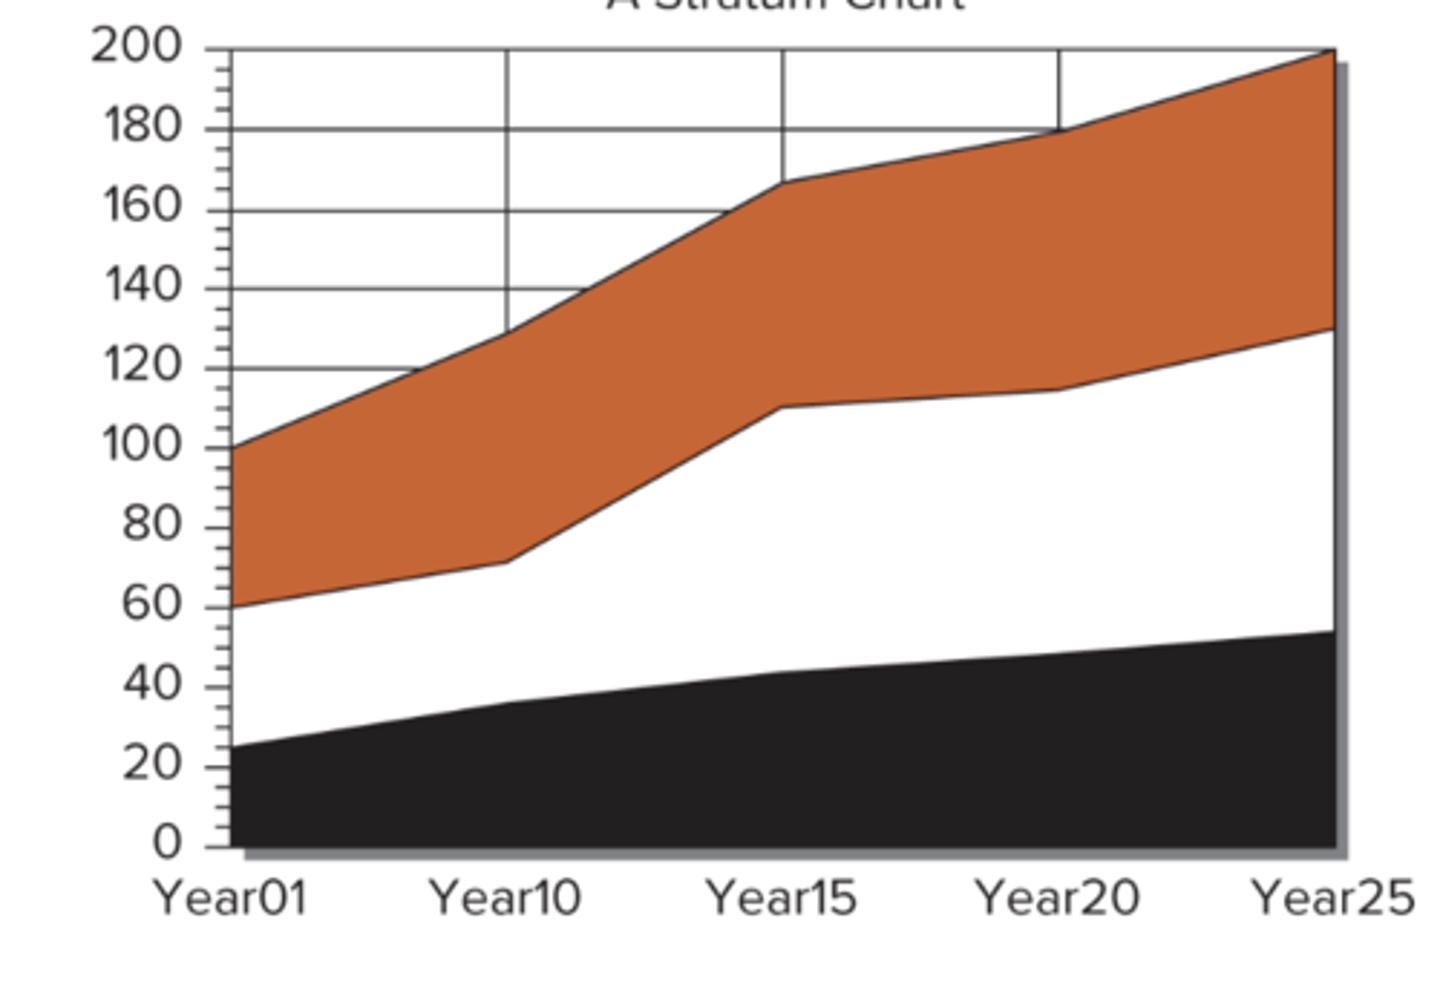
Area Graph
best used to show changes in patterns over time
aka - stratum/surface graph
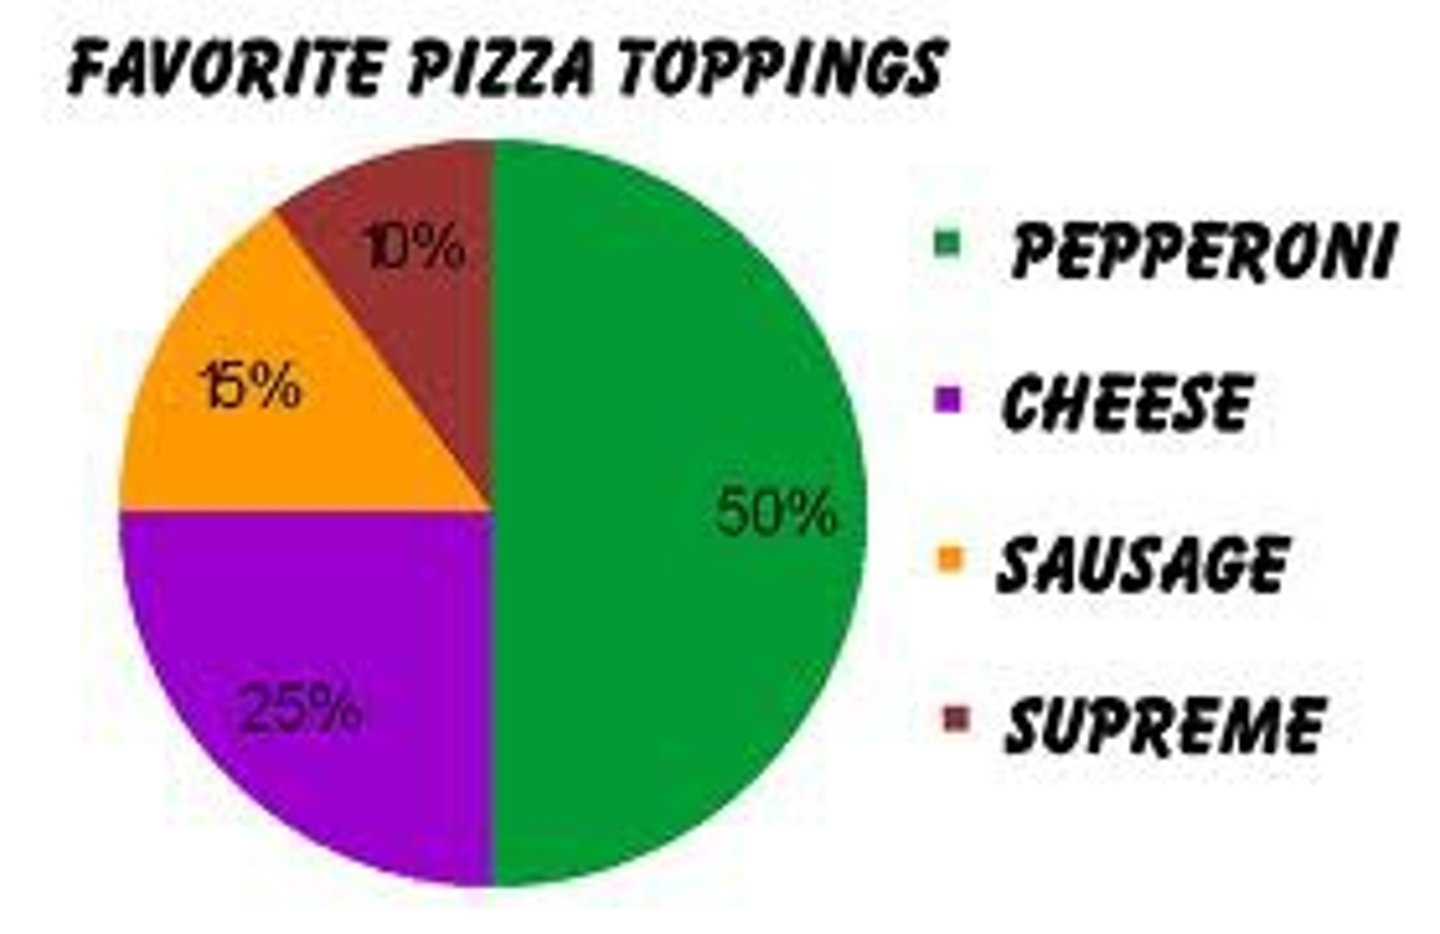
Pie Graph
Represents something in relation to the whole
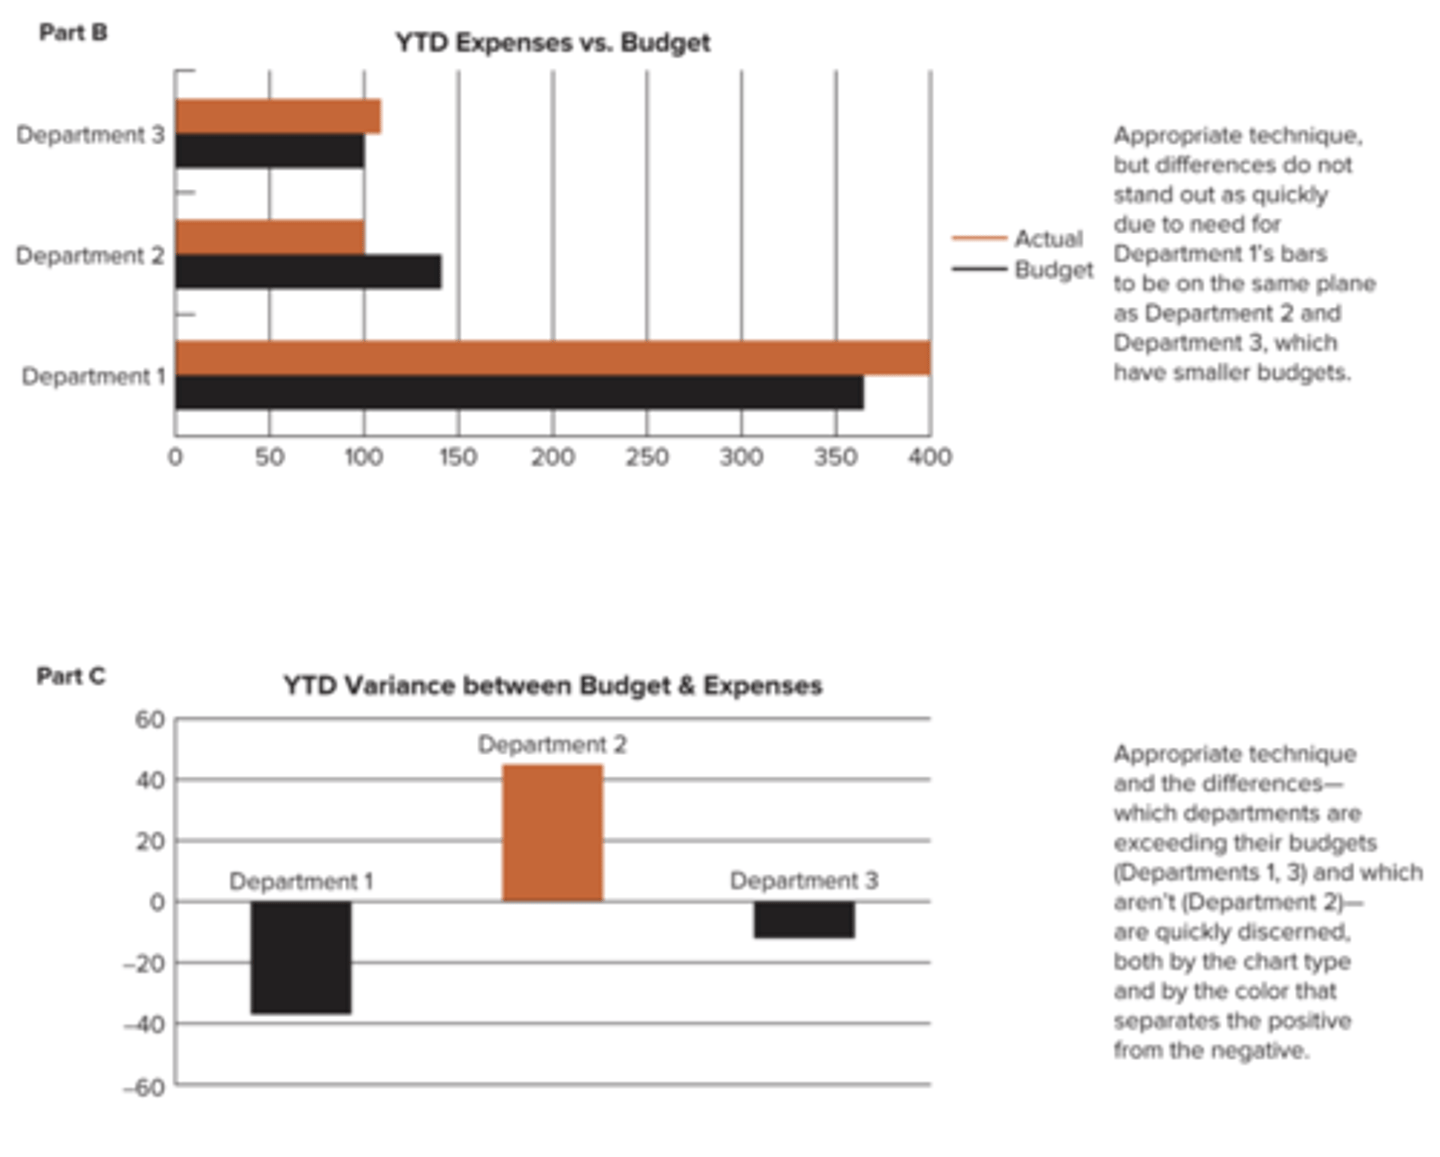
Bar Graph
a graph that uses vertical or horizontal bars to show comparisons among two or more items
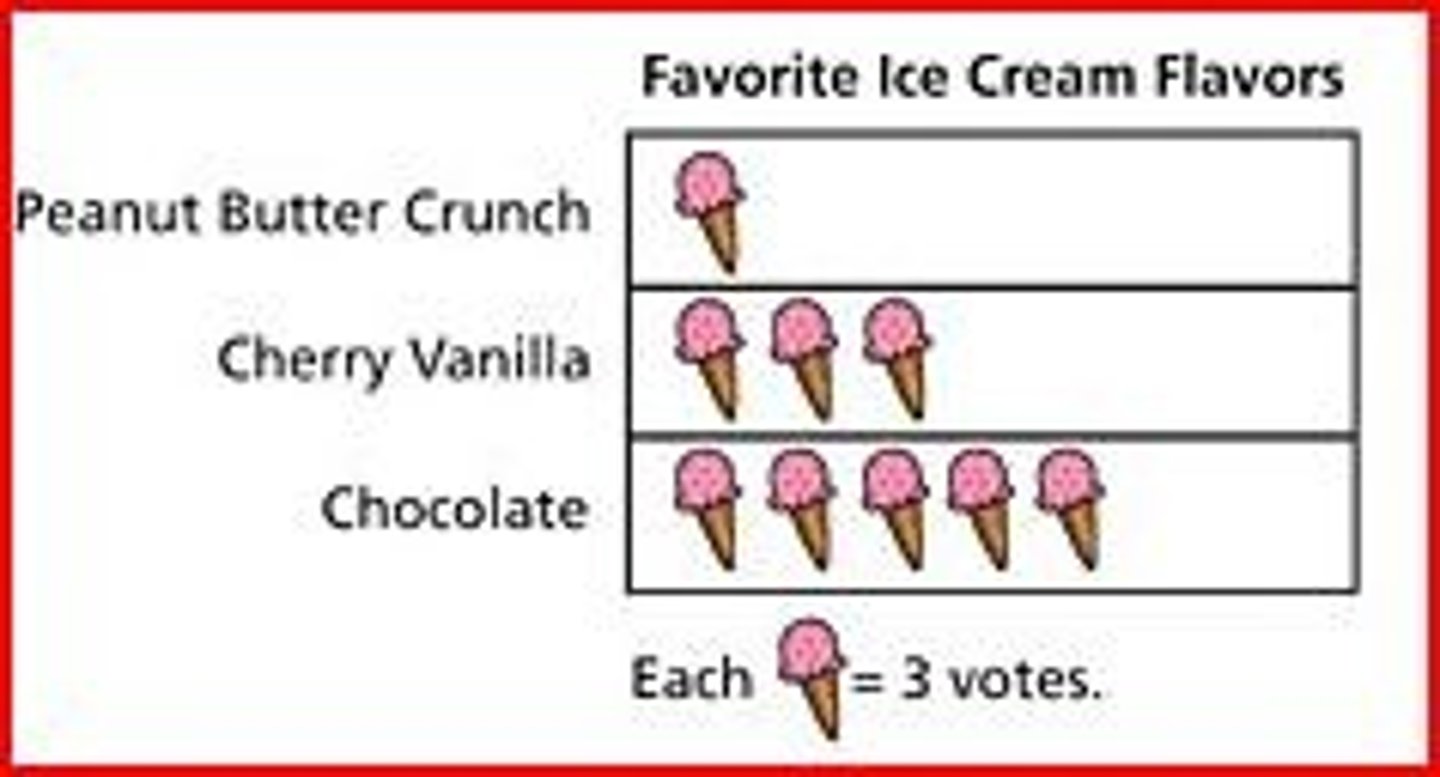
Pictograph
a bar chart that uses symbols instead of bars
Geograph
uses a map to show regional variations in data.
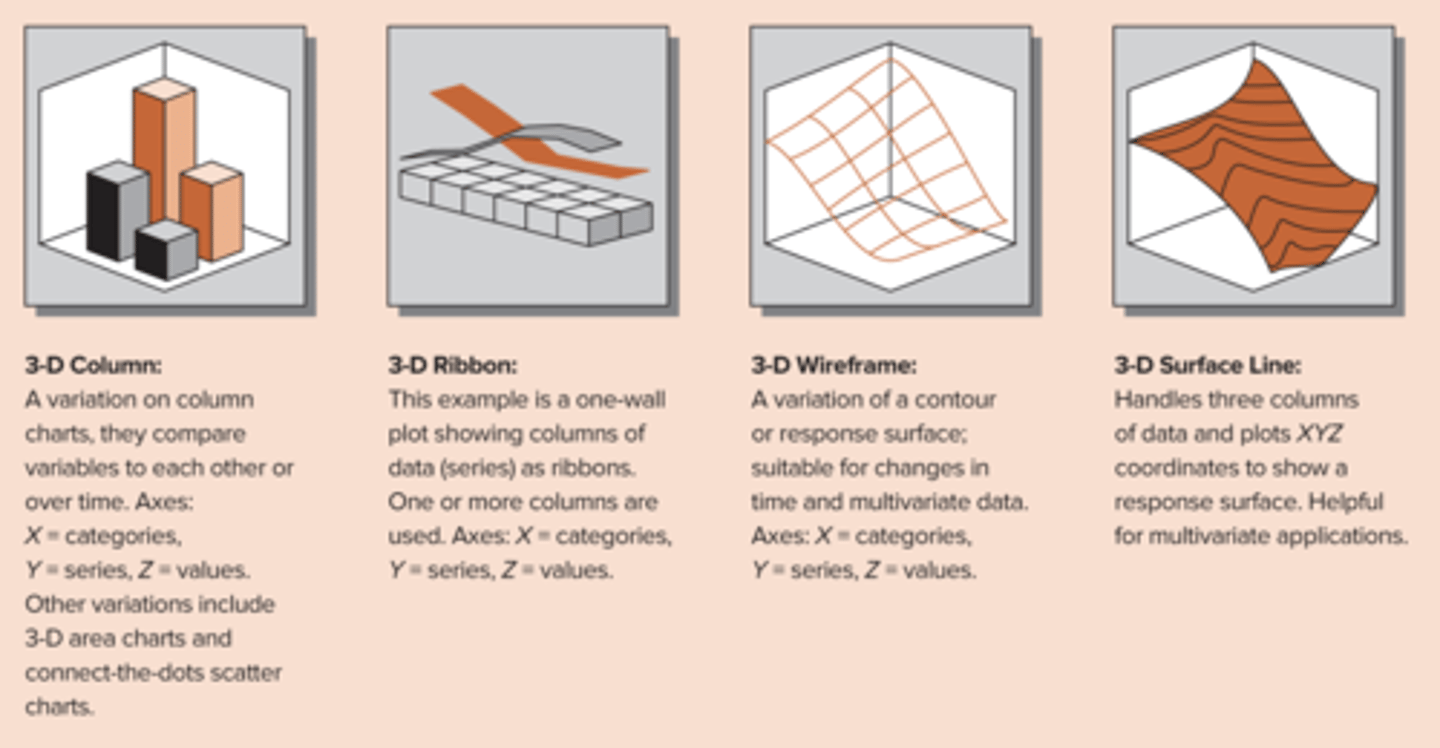
3D Graph
allows you to compare 3 or more variables in one graph
limit the number of insights on any given slide or page
How do you speed audience understanding during an oral report?