Measures of Variability
1/14
There's no tags or description
Looks like no tags are added yet.
Name | Mastery | Learn | Test | Matching | Spaced | Call with Kai |
|---|
No analytics yet
Send a link to your students to track their progress
15 Terms
variability
a measure of how “close together” or “far apart” scores are in a dataset
range
the difference between the largest and smallest values in a dataset
= max-min
very sensitive to outliers
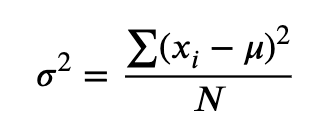
variance
a measure of spread relative to the scatter score of values about their mean
a numerical measure of how far, on average, a score in the dataset falls from the mean of all scores
narrow vs wide distribution using mean as a reference pt
population variance
sample variance
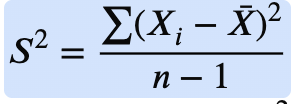
Steps for calculating the sample variance
Calculate the mean of the dataset (X̄)
Calculate the deviation of every score value from the mean Xi−X̄
Square all of the deviations (Xi−X̄)2
Add all of the squared deviations ∑(Xi−X̄)2
Divide by “n-1” (Xi−X̄)2 / n-1
standard deviation
the square root of the variance
percentiles
given a set of n observations (X1 , X2 ….Xn ), the pth percentile, P, is the value of X such that p% or less of the observations are less than P and (100-p)% or less of the observations are greater than P
25th percentile (first quartile)
its location is the n+1/4 ordered observation in the dataset
50th Percentile (second quartile)
its location is the 2(n+1)/4 ordered observation in the dataset
this is equal to the median in a dataset
75th Percentile (third quartile)
its location is the 3(n+1)/4 ordered observation in a dataset
boxplots
A 5-# summary of data consisting of the Min, Max, and all 3 Quartiles
interquartile range (IQR)
the difference between the third and first quartiles
advantage of the IQR
it is superior ti the traditional range because it only looks at the variability of the middle 50% of the observations and is therefore less sensitive to extreme scores/outliers
outlier
an observation whose value, X, either exceeds the value of the 3rd Quartile by a magnitude greater than 1.5(IQR) or is less than the value of the 1st Quartile by a magnitude greater than 1.5(IQR)
Is there a value, X, that is either <Q1 - 1.5(IQR) or >Q3 + 1.5(IQR)