Statistics Ch.1 & 2
1/23
There's no tags or description
Looks like no tags are added yet.
Name | Mastery | Learn | Test | Matching | Spaced | Call with Kai |
|---|
No analytics yet
Send a link to your students to track their progress
24 Terms
What is Statistics?
Comparing what you expect with what you observe
What is the Empirical Method?
scientists find answers by gathering facts through careful and systematic observation
uses variables - an attribute, characteristic, or dimension being measured
uses operational definitions - defining a variable in terms of the techniques used to measure it (ie. high blood pressure is >140/90)
What is a Population?
a group of objects or people that are alike on one or more dimensions as defined by the researcher
examples: humans, women over 40, or wealthy
it is difficult to study an entire population
numbers generated from populations are referred to as parameters (us Greek letters i.e. Sigma for population standard deviation)
sigma = σ
What is a Sample?
a group of cases selected from a population for the purpose of study
the objective is to gather data from the sample (subset of the original population) which can then be generalized back to the original population. this is only possible if the sample is representative of the original population
numbers generated from a sample are called statistics (use Roman letters i.e. SD for sample standard deviation)
What is a Representative Sample?
contains all the attributes of the population in about the same proportion that they occur in the population
for example, if 50% of the population of interest is male than about 50% of a representative sample is also male
Independent and Dependent Variables
variable x (independent variable) - variables that is changed
variable y (dependent variable) - variables affected by the change
the independent variable is wither what is controlled by the experimenter or observed and is the suspected “causative agent” while the dependent variable is where the outcome or effect is measured
What is Qualitative Data?
reflects the presence of a quality or attribute
do not contain quantity information-even if numbers are assigned, they have no quantitative info, rank or distance
examples:
focus groups
interviews
open-ended responses
interpreting images
What is Quantitative Data?
reflects the amount or extent of an attribute
includes numbers, a measurement of some sort, counting, describing in categories
example: a height of 54 inches means the person is taller than a height of 48 inches
Levels of Measurement
Nominal - lowest
Ordinal
Interval
Ratio - highest
dependent variables with higher LOM’s allows for a higher levels of data analysis - collect the highest level you can!!
What is Nominal Data?
simplest level of measurement - showing sameness or differentness of a particular quality/variable
categories must be:
exhaustive (all possibilities fit into a category)
exclusive (possibilities can not fit into more than one category)
example: did your state vote red or blue?
is NOT in order
measure of central tendency: mode (most frequently occurring value)
frequencies (county) and percentages
statistical test: Chi-Square
What is Ordinal Data?
categories must be:
exhaustive
exclusive
RANK ORDERED - each category is higher or lower or better or worse than another category, however you do not know the level of difference between the categories (intervals between categories are not set)
example: state if you strongly disagree/disagree/agree/strongly agree
measure of central tendency:
mode
median (middle number)
range, frequency, percentage
statistical test: Spearman’s Correlation coefficient
What is Interval Data?
categories must be:
exhaustive and exclusive
ordered with numerically equal intervals
no point at which the variable does not exist
example: temperature
creating a scale lets us analyze data that is ordinal at the interval level (if it starts at 1; like 1-10)
measure of central tendency:
mode
median (middle number)
mean (average)
range, frequency, percentage, standard deviation
statistical test: Spearman’s Correlation coefficient, T-test
What is Ratio Data?
categories must be:
exhaustive
exclusive
have equal intervals and have a point at which the variable could be absent - a true zero
generally do not have negative values
example: total # of incarcerated Americans this year
measure of central tendency:
mode
median (middle number)
mean (average)
range, frequency, percentage, standard deviation
statistical test: Spearman’s Correlation coefficient, T-test
What is a Percentage?
a proportion of the whole when the whole is 100
f/N x 100 = %
f = the frequency with which a score or an interval occurs
N = total # of cases
% = percentage
example: 77/100 × 100 = 77%
What is a Frequency Distribution?
a list of values of the dependent variable, from lowest to highest, with a count of the frequency with each value occurred
a normal distribution is a symmetrical bell-shaped curve
What is Skew and Kurtosis?
data that is outside the distribution are called outliers
a curve that is not symmetrical means the left side does not mirror the right side and the curve is skewed
kurtosis indicated how peaked or flat a distribution is
What is Relative Frequency?
# of times a particular observation occurs/Total # of observations
illustrates what proportion of the observations this particular observation is
What is Cumulative Relative Frequency?
calculated by adding together all the relative frequencies less than or equal to the selected upper limit point
for example, 21/70 patients were discharged within 3 days or less
What are Cumulative Percentages?
cumulative percentage distribution - summing of percentages from the first category of the table to the last so that the last category has a cumulative percentage of 100%
can be used to examine where certain percentiles are located (ie. what grade did the bottom 25% of the class earn)
What is a Bar Graph?
the x-axis (horizontal) usually has a categorical variable (finite)
the y-axis has the frequencies or percentages
the variable which has the highest bar is the mode
What is a Histogram?
bar graph with vertical bars that touch each other
the x-axis has continuous variables (infinite)
the y-axis has the frequencies or percentages
the variable which has the highest bar is the mode
What is a Line Graph?
a figure that is developed by joining a series of points with line to show how a variable changes over time
the x-axis shows time and the y-axis shows the quantity of the variable
What is a Scatterplot?
each dot is a subject and is placed where the score for variable x and the score for variable y are located
the # of dots is the sample size
the dots indicated the direction of the relationship (positive - upward sloping or negative - downward sloping) and the strength (weak - very scattered, moderate or strong - closely spaced dots forming a line) of the relationship
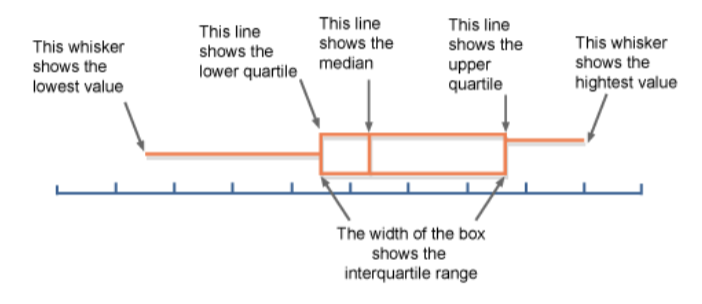
What is a Box and Whiskers Plot?
outliers may appear as separate dots after the whiskers end