PSY121 Exam 2 (self made/computer)
1/97
There's no tags or description
Looks like no tags are added yet.
Name | Mastery | Learn | Test | Matching | Spaced | Call with Kai |
|---|
No analytics yet
Send a link to your students to track their progress
98 Terms
Reliability
Consistency or stability of a measure
Example of reliability
Professor Fuentes is “reliable” because she begins class exactly at 10am each day; professor would be unreliable because she may appear anytime between 10-10:20am
Reliable measure of a psychological variable like intelligence will _______
yield the same result each time you administer the intelligence test to the same person
Test would be unreliable if ______
measured the same person as average one week, low the next, and bright the next.
Reliable measure does not _____
fluctuate from one reading to the next.
If a measure fluctuates, there is error in the ________
measurement device; it is to come extent unreliable.
Pearson product-moment Correlation Coefficient ( r )
If two things move together, how closely they move together, whether relationship is positive/negative
Range:
-1.0 —> perfect negative relationship (both inc)
0 —> no relationship (one inc; one dec)
+1.0 —> perfect positive relationship
+ / - determines the direction of the relationship
if a measure is reliable, the two scores should be v similar; pearsons correlation coefficient that describes the relationship between the scores should be a high positive correlation
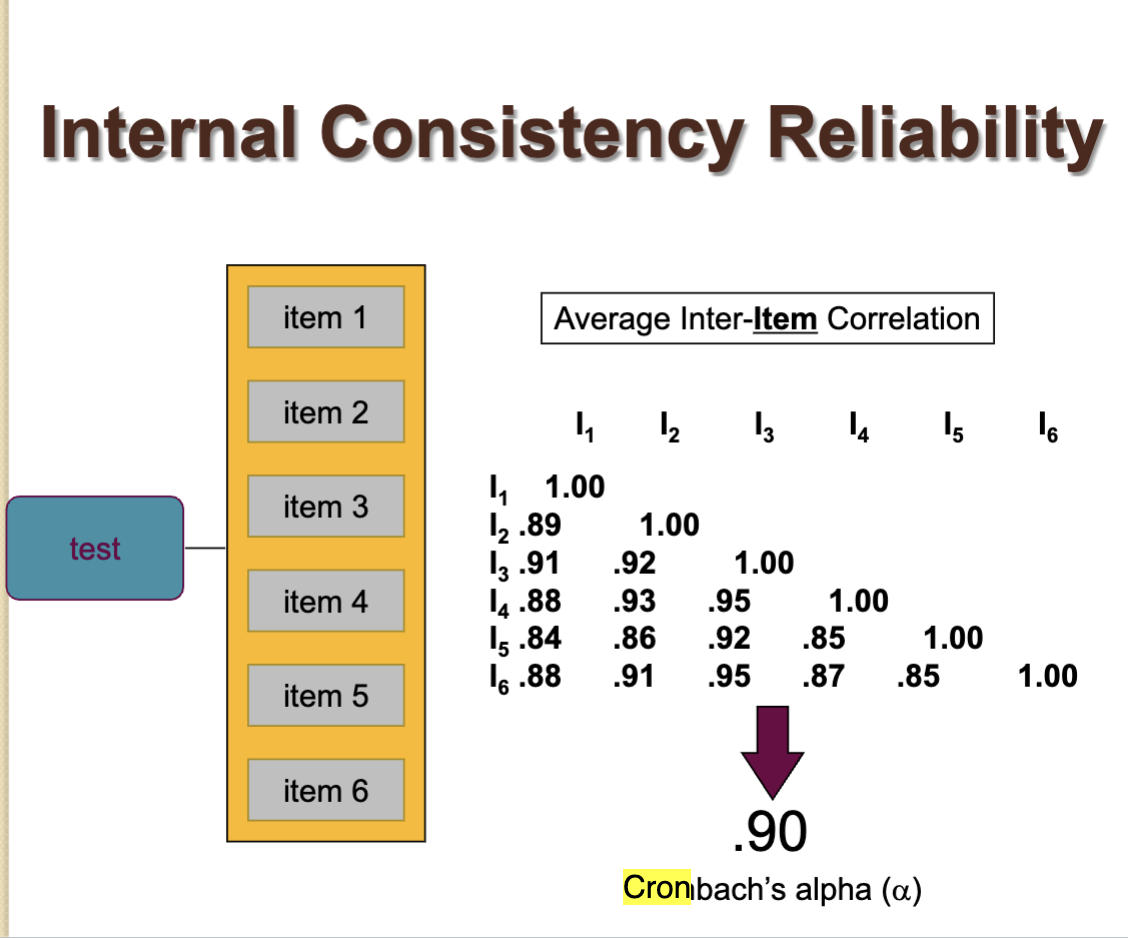
How to calculate Cronbach’s alpha
(range, target); item-total or split half
Most commonly used indicator of reliability based on internal consistency; provides us with the average of all possible split-half reliability coefficients.
How well a set of items (like a survey or test questions) all measure the same underlying thing.
To perform calculations: scores on each item are correlated with scores on every other item. A large # of correlation coefficients are produced; you would only want to do this w/ a computer.
Cronbach’s is based on the average of all the inter-item correlation coefficients and the number of items in the measure.
More items will be associated with higher reliability
(Cronbach’s alpha) Item total correlation
How well each individual question matches the overall test.
If all questions are measuring the same thing —> scores move together —> alpha is high
If questions are random/inconsistent —> alpha is low
Take one item (questions)
Correlate it with the total score of the rest of the test
High correlation = fits well with the test
Low correlation = item might be confusing, irrelevant, or measuring something else
Low alpha
Items don’t match well
Fix (cronbach’s alpha)
Remove bad items (low item-total correlation)
Item total correlation example
“Does this question belong in the test”
Individual question quality
If measuring anxiety
“I feel nervous in crowds” —> high item- total correlation
“i like pizza” —> low item correlation (doesn’t belong)
> 0.3 is acceptable
<0.3 —> consider removing or revising the item
Split half reliability
“Is the whole test consistent within itself”
Test consistency
If two halves of your test give similar results;
Split test into two halves (e.g., odd v. even questions)
Calculate scores for each half
Correlate the two halves
High correlation —> test is consistent
Low correlation —> test may be unreliable
Interrater reliability
Extent to which raters agree in their observations. If two raters are judging whether behaviors are aggressive; high interrater reliability is obtained when most of the observations result in the same judgment.
Commonly used indicator is Cohen’s Kappa
Interrater reliability example
Rating whether a child’s behavior on a playground is aggressive and how aggressive the behavior is. You could have one rater make judgments about aggression, but the single observations of one rater might be unreliable. That is, one rater’s scores may contain a lot of measurement error.
Solution = use at least two raters who observe the same behavior
Test-retest reliability
Assessed by measuring the same individuals at two points in time.
Requirements:
Assessments at multiple time points
Stable characteristic
Test statistic = r(range target)
Test retest reliability example
The reliability of a test of intelligence could be assessed by giving the measure to a group of people on one day and again a week later. We would then have two scores for each person; correlation coefficient could be calculate to determine the relationship between the first test score and the retest score.
Internal consistency
Checks whether questions on a test measure the same thing
Assessment of reliability using responses at only one point in time. Because all items measure the same variable, they should yield similar/consistent results
Requirement - multiple item scale
Test statistic:
r (correlation coefficient)
Cronbach’s alpha (range, target)
-.70 or higher = acceptable
Item total or split half
Internal consistency example
Happiness survey
“I feel happy most days”
“I enjoy life”
“I feel positive”
If responses correlate —> good internal consistency
Items
Number of different questions
Types of reliability
Test restest, interrater, internal consistency
Types of validity
Face , convergent , discirminant, conccurent, content
Face validity
The content of the measure appears to reflect the construct being measured
Evidence for validity is that the measures seems “on the face of it” to measure what it is supposed to measure.
That is, do the procedures used to measure the variable appear to be an accurate operational definition of the theoretical variable?
Face validity example
If the new measure of depression includes items like “I feel sad” or “I feel down” or “I cry a lot,” this would be evidence that the measure has face validity
Measure of a variable such as shyness will usually appear to measure that variable.
Shy Q includes “ I often feel insecure in social situations” but does not include an item such as “I learned to ride a bicycle at an early age”
Convergent validity
Scores on the measure are related to other measures of the same construct
Your measure correlates w/ similar measures
Convergent validity example
If scores from the new measure, collected at the same time as other measures of depression (e.g., Beck Depression Inventory or Duke Anxiety-Depression Scale), were related to scores from those other measures, then it could be said to have evidence for convergent validity
One measure of shyness should correlate highly with another shyness measure or a measure of a similar construct such as social anxiety
Your depression scale correlates w/ similar measures
Discriminant validity
Scores on the measure are not related to other measures that are theoretically different
Your measure does not correlate w/ unrelated things
Discriminant validity example
If the new measure, collected at the same time as other measures of anxiety (e.g., state/trait anxiety), was unrelated to those measures, then it could be said to have evidence for discriminant validity because it would indicate that what was being measured was not anxiety.
Shyness measure: found no relationship between Shy Q scores and several conceptually unrelated interpersonal values such as being forceful w/ others.
Depression scale should not correlate w/ show size
Concurrent validity
Scores on the measure are related to a criterion measure at the same time (concurrently)
Content validity
Depression is defined by a mood and by cognitive and physiological symptoms. If the new measure of depression has content validity, it will include items from each domain
The content of the measure is linked to the universe of content that defines the construct
Scales of measurement
Nominal, ratio, interval, ordinal
Nominal
Categories with no numeric scales
Nominal example
Left-handed/right-handed
Eye color
College major
Nominal distinction
Impossible to define any quantitative values and/or differences between/across categories
Ratio
Equal spacing w/out zero; zero means none of the thing
Zero indicated absence of variable measured
Ratio example
Reaction time
Age
Frequencies of behaviors
Ratio distinction
Can form ratios (one person weighs twice as much as another person)
Interval
Equal spacing but no true zero
Numeric properties are literal; assume equal interval between values
Interval example
A measure of intelligence
Aptitude score
Temperature (F or C)
Interval distinction
No true zero
Ordinal
Rank order
Rank ordering Numeric values limited
Ordinal example
Two-, three-, and four-star restaurants
Ranking tv programs by popularity
1st, 2nd, 3rd place
Ordinal distinction
Intervals between items not known
Quantitative research
Focuses on variable that can be quantified (counted)
Quantitative research example
#s, statistics
Survey results (1-10 scale)
Often have large samples, and results are expressed in numerical terms using statistical descriptions.
Quantitative researchers….
typically investigate research questions using experiments, surveys, structured interviews, and systematic observations
Quantitative research according to Creswell
Qualitative research begins with assumptions and the use of interpretive/theoretical frameworks that inform the study of research problems addressing the meaning individuals or groups ascribe to a social or human problem. To study this problem, qualitative researchers use an emerging qualitative approach to inquiry, the collection of data in a natural setting sensitive to the people and places under study, and data analysis that is both inductive and deductive and establishes patterns or themes. The final written report or presentation includes the voices of participants, the reflexivity of the researcher, a complex description and interpretation of the problem, and its contribution to the literature or a call for change. (p. 44)
Many approaches to a qualitative inquiry
Narrative Research, Phenomenological Research, Grounded Theory Research, Ethnographic Research, and Case Study Research.
a quantitative approach by developing a questionnaire that you would ask a sample of teenagers to complete…
You could ask about the number of hours they work, the type of work they do, their levels of stress, their school grades, and their involvement with various school, community, and social activities. After assigning numerical values to the responses, you could look at the answers from the entire sample: you could subject the data to quantitative, statistical analysis.
A quantitative description of the results would perhaps focus on the percentage of teenagers who work and how this percentage varies by age. There might also be an examination of whether the number of work hours is related to school grades, use of drugs and alcohol, and sleep patterns.
Qualitative research
Expressed in non-numeric, narrative terms. Words, meanings
provides a clearer representation of what happened after the HIV disclosure, thereby giving meaning and depth to the quantitative conclusions.
Qualitative research example
Interview responses
The qualitative portion of the study focused on families in which full disclosure had occurred. Goodrum et al. recruited 17 of the mothers and 16 children. The qualitative investigation aimed to obtain in-depth information about HIV disclosure and how it affected the child and the family. Mothers and children were interviewed separately. The interview content was organized with three themes: (1) Children’s reaction to the disclosure; (2) Mothers’ experiences of the disclosure; (3) Family changes after HIV disclosure.
Archival research
Using existing data (records, documents)
Archival research example
Analyzing old medical records to study disease trends
Inductive reasoning
Specific —> general
Inductive reasoning example
You observe 10 stressed students —> conclude college causes stress
Deductive reasoning
General —> specific
Deductive reasoning example
Stress lowers grades —> test it on students
Consensual Qualitative Research (CQR)
Domains
Categories/themes in data
CQR example
Interview themes like “stress”, “family”, “school”
Consensus
Researchers agree on interpretations
Consensus example
Multiple researchers agree a response shows “anxiety”
Racism-Conscious Reflexivity (RCR)
Researchers actively think about how racism and bias affect their work
RCR example
A researcher studying education considers how systemic racism impacts results
Question wording
Negatively worded v. double barreled v. loaded
Negatively worded
Confusing phrasing
Negatively worded example
“I do NOT dislike school”
Double-barreled wording
Two questions in one
Double-barreled example
Do you like your teacher AND homework?
Loaded questions
Biased wording
Loaded question example
Why is school so stressful (assumes it is)
Sample size
Number of participants
Sample size example
10 people vs. 10,000 people
Relationship between sample size and confidence interval
Larger sample —> smaller confidence interval —> more accurate
Smaller sample —> less precise
Interviews
Detailed answers. Time consuming or expensive
Surveys
Fast, cheap; less depth
Confounding variables
Third variable messing up results
Confounding variable example
Studying coffee —> test scores
BUT sleep affects both —> confound
Pretest Design- only
Measure before treatment; baseline data, may influence behavior
Posttest Design-only
Measure after treatment; no pretest bias, no baseline comparison
Attrition v. Maturation v. morality
Attrition/ Morality
Participants drop out
Attrition/Morality example
Half the group quits a study
Maturation
Natural changes over time
Maturation example
Kids improve reading just by aging
Repeated measures v. Independent groups
Repeated measures
same participants in all conditions
Repeated measure example
Same students take test with and without music
Independent groups
Different participants per group
Independent groups example
Group A v. Group B
Carryover Effect
Earlier conditions affect later ones
Carryover effect example
Taking a test twice —> better second time due to practice
Within v. between subjects
Within subjects
Same people in all conditions; fewer participants, risk of carryover
Between subjects
Different people per condition; no carryover, need more participants
The Experimenter Movie
Focuses on:
Obedience (like Milgram study)
Ethical issues
Participant stress
example concept: people obey authority even when uncomfortable