3.3 - Raw Scores
1/41
There's no tags or description
Looks like no tags are added yet.
Name | Mastery | Learn | Test | Matching | Spaced | Call with Kai |
|---|
No analytics yet
Send a link to your students to track their progress
42 Terms
meaningless
A simple raw score on a test without any type of comparative information, is a _______ number
derived
To make sense of the scores, a score will need to be converted to a ______ score or compared against some criterion
Norm-referenced
Criterion-referenced
Self-referenced
Interpretation of Scores (3)
Norm-referenced
Compares an individual’s score with scores of others
Norm-referenced
A student scores in the 80th percentile on an IQ test
Criterion-referenced
Compares an individual’s score to a fixed standard or benchmark (established by authority)
Criterion-referenced
Passing a driving test requires 80% correct answers
Self-referenced
Compares an individual’s score with their own previous scores
Self-referenced
A client improves from 50% to 70% on repeated stress assessments
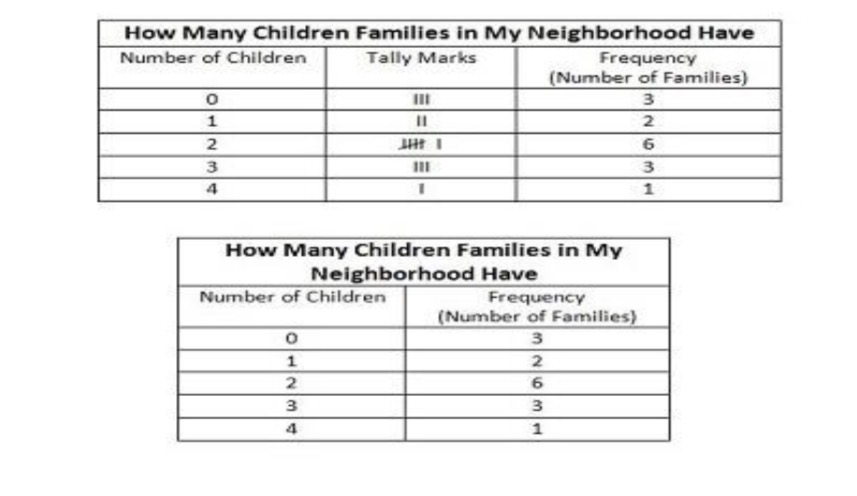
Frequency Distribution
Histogram
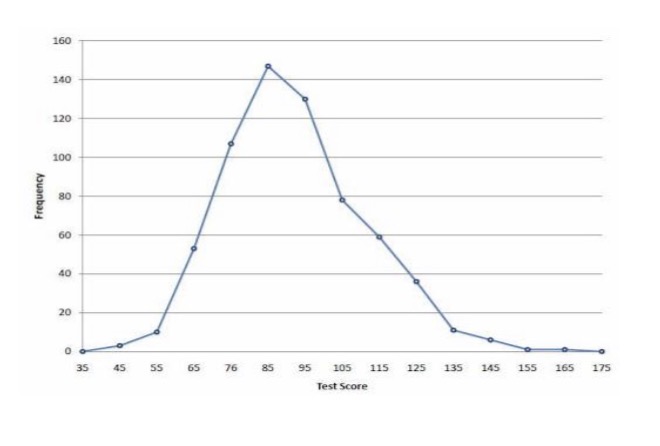
Frequency Polygon
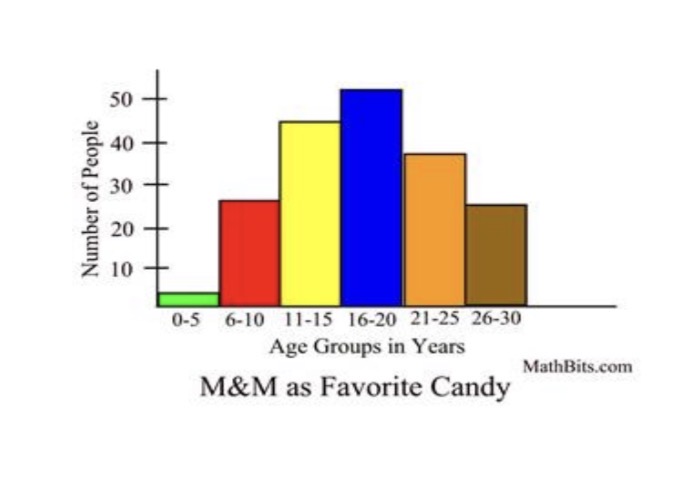
Bar Graph
Ways to ORGANIZE Raw Data (4)
Frequency Distribution
Tabulates how many times each score or response occurs
Frequency Distribution
Histogram
a graph of bars that presents the data from a frequency distribution in a more visual format
used with quantitative variable
Histogram
Frequency Polygon
A line graph of a frequency distribution
Connects points at the peak of each value
Higher peaks = greater frequency
Frequency Polygon
Bar Graph
Visual representation of nominal data
Bars represent categories, not continuous data
Bars can be in any order
Bar Graph
Measures of Central Tendency
Refers to typical score indicators, or the average score for a distribution of scores.
Measures of Central Tendency
Single value that attempts to describe a set of data by identifying the central position within that set of data
Measures of Central Tendency
Also called MEASURES OF CENTRAL LOCATION
Mean
Median
Mode
Measures of CENTRAL Tendency (3)
Mean
arithmetic average
Mean
susceptible to the influence of outliers
Arithmetic
Population
Sample
Mean: (3)
Arithmetic Mean
the sum of the scores divided by the number of scores in the collection
Population Mean
Mean computed from ALL members of the population.
Population Mean
✅ Symbol
\mu (mu)
Sample Mean
Mean computed from only a subset (sample) of the population.
👉 Used when studying part of the group only
Median
the middle score for a set of data that has been arranged in order
average
If there are 2 medians, get their ____
5
Data: 2, 4, 6, 8
Mean?
Mode
values that occur most often
Measures of Variability
indicate the extent of individual differences
around a measure of central tendency
Measures of Variability
“How far apart are the scores?”
Measure of Variability
“Describe the amount of variation”
Shows how much scores deviate from the average
Example:
Class A: 85, 86, 87
Class B: 60, 85, 100
Both have mean = 86
BUT Class B has bigger spread → more variable
variability
“Large spread = large differences”
More distance between scores = greater ____
Range
Standard Deviation
Variance
Measures of Variability (3)
Range
the difference between the highest and the lowest scores
Standard Deviation
The average distance of scores from the mean
👉 Shows how much scores go above or below the mean.
Variance
the average squared deviation around the mean
Variance
the standard deviation squared