Time-Resolved Spectroscopy for the Study of Fast Reactions
1/54
There's no tags or description
Looks like no tags are added yet.
Name | Mastery | Learn | Test | Matching | Spaced |
|---|
No study sessions yet.
55 Terms
What is time-resolved spectroscopy?
Spectroscopy is used to study the kinetics, and structure and bonding of excited states, radicals and other intermediates by making observations in real time.
Aims to understand mechanisms.
What techniques are used to study fast reactions and why?
Must use techniques such as stopped flow, temperature jump, pulses of ionising radiation (for radiolysis) or pulses from a lamp or laser (for light).
Fast and sensitive observations are needed as the species are often short lived and at a low concentration.
What is the pump-probe method?
Used for light-initiated reactions in solution. The ‘pump’ is a pulse of light is used to create excited states, then a ‘probe’ is the spectroscopy observation.
The pulse of light must occur shorter than the reaction time and of a high intensity, at a specific wavelength where the reactants absorb.
The spectroscopy observation must occur shorter than the reaction time and should be sensitive.
Why are lasers often used for pumping and probing?
They can provide the shortest pulses at high intensity light.
They can also be monochromatic at a specific wavelength of light.
They are tunable across a range of wavelengths.
Give an overview of UV-Vis spectroscopy.
Used for electronic transitions in the region of λ = 200-800 nm.
The sample must have strong emission or absorption, strong bands often involve ππ* or charge transfer excited states.
There must be a transition dipole moment.
Give an overview of absorption UV-Vis spectroscopy.
It has a relatively high sensitivity. To record a spectrum, a beam of ‘white light’ is needed (containing many wavelengths).
Has a path length of 1 cm typically.
Can observe samples of concentration > 10-6 moldm-3
Give an overview of emission UV-Vis spectroscopy.
Has a very high sensitivity as there is zero background.
Fluorescence emission is allowed, therefore has a high rate constant and short lifetime.
Phosphorescence emission is disallowed, so the rate constant is low and the lifetime is long.
What are nanosecond techniques?
Techniques which use pump lasers with pulses of around 10 ns, and detectors that respond within nanosecond times.
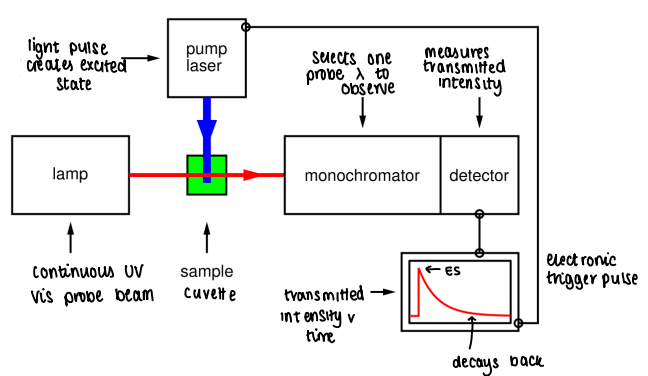
What apparatus is used for TRVIS?
A light pulse creates an excited state in the cuvette.
A lamp shines a continues UV-Vis probe beam through the cuvette.
The beam passes through the monochromator, which selects a probe wavelength to observe.
The detector measures the transmitted intensity.
A transmitted intensity v time graph is created.
The data shows when the excited state forms, and how long it takes to decay back.
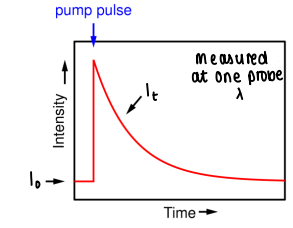
What data is gathered from TRVIS?
An intensity v time graph is created, showing the point at which the pump pulse creates the excited state and how long it takes to decay.
The graph is measured at one probe wavelength.
This data can be converted to change in absorbance
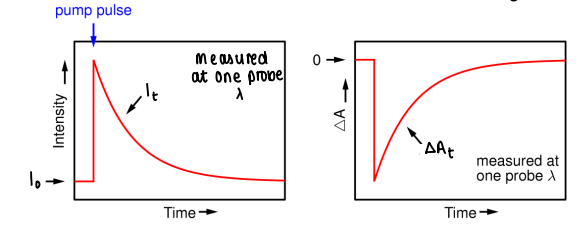
How do you convert TRVIS data into a change in absorbance graph?
Find the change in absorbance, where I0 is the initial probe intensity, and It is the probe intensity at time t.
Plot change in absorbance against time.
ΔAt is proportional to Δct
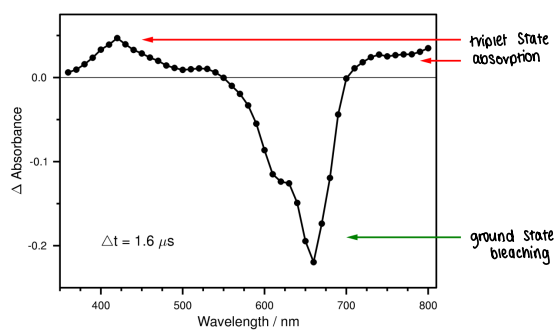
How do you create a difference spectrum from TRVIS?
Repeat the kinetics at several probe wavelengths, then choose a time (t1) and plot ΔAt v every probe wavelength used.
The difference spectrum = spectrum after excitation (red) - spectrum before excitation (green).
A negative curve means reactant is lost.
A positive curve means product is gained.
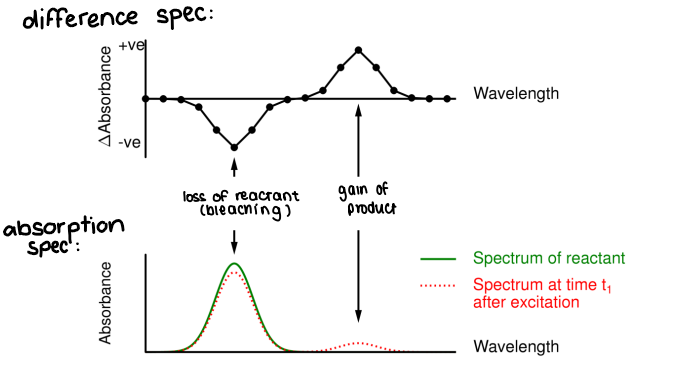
What is bleaching?
The decrease of absorbance of (usually) ground state molecules due to their depletion.
Caused by excitation to excited states.
What do conjugated organics look like in UV-Vis spectrums?
Generally, their T1 states have lifetimes higher than 10 ns. They have strong UV-Vis absorption bands as triplet → triplet transitions are spin allowed.
How do you calculate lifetime?
𝜏 = 1 / k
It is the time for concentration to fall to 1/e of the initial value.
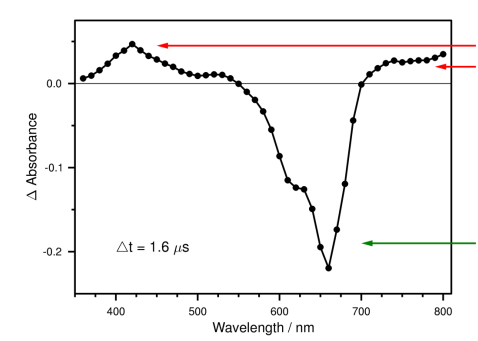
What can be determined from this TRVIS spectrum under N2?
Where the change in absorption is positive, there is triplet state absorption. These are T1 bands.
Where change in absorption is negative, there is ground state bleaching. These are the S0 bands.