Quantitative methods
1/41
There's no tags or description
Looks like no tags are added yet.
Name | Mastery | Learn | Test | Matching | Spaced | Call with Kai |
|---|
No analytics yet
Send a link to your students to track their progress
42 Terms
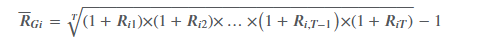
holding period return,
return earned from holding an asset for a single specified period of time
R = [(1 + R1) × (1 + R2) × (1 + R3)] − 1
![<p><span>return earned from holding an asset for a single specified period of time</span></p><p><span>R = [(1 + R</span><sub>1</sub><span>) × (1 + R</span><sub>2</sub><span>) × (1 + R</span><sub>3</sub><span>)] − 1</span></p>](https://knowt-user-attachments.s3.amazonaws.com/32c12bb9-024c-4d76-96ac-70d2059a3a35.png)
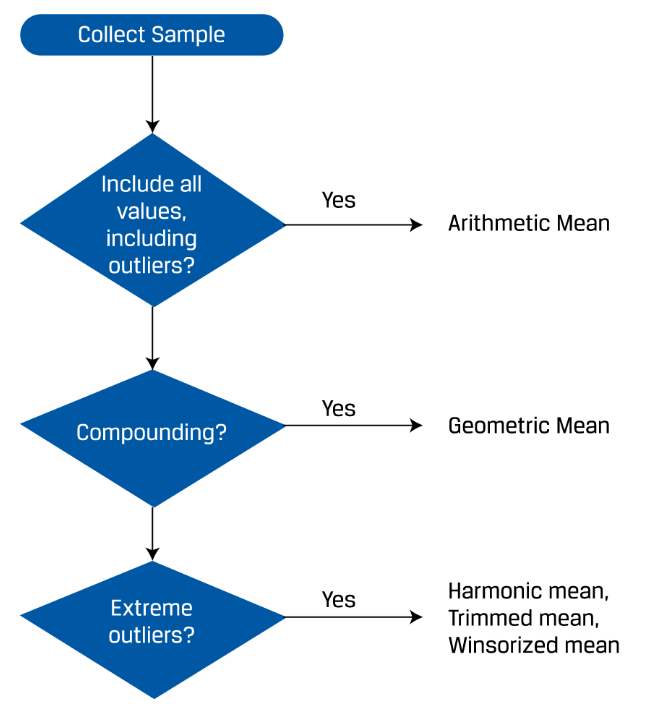
geometric mean
the geometric mean is always less than or equal to the arithmetic mean
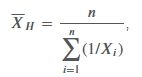
harmonic mean
Arithmetic mean × Harmonic mean = (Geometric mean)2.
trimmed mean
removes a small defined percentage of the largest and smallest values from a dataset containing our observation before calculating the mean by averaging the remaining observations
winsorized mean
replacing extreme values at both ends with the values of their nearest observations, and then calculating the mean by averaging the remaining observations.
which mean to use?
money-weighted return
IRR
time-weighted rate of return
Price the portfolio immediately prior to any significant addition or withdrawal of funds. Break the overall evaluation period into subperiods based on the dates of cash inflows and outflows.
Calculate the holding period return on the portfolio for each subperiod.
Link or compound holding period returns to obtain an annual rate of return for the year (the time-weighted rate of return for the year). If the investment is for more than one year, take the geometric mean of the annual returns to obtain the time-weighted rate of return over that measurement period.
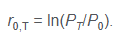
continuously compounded return
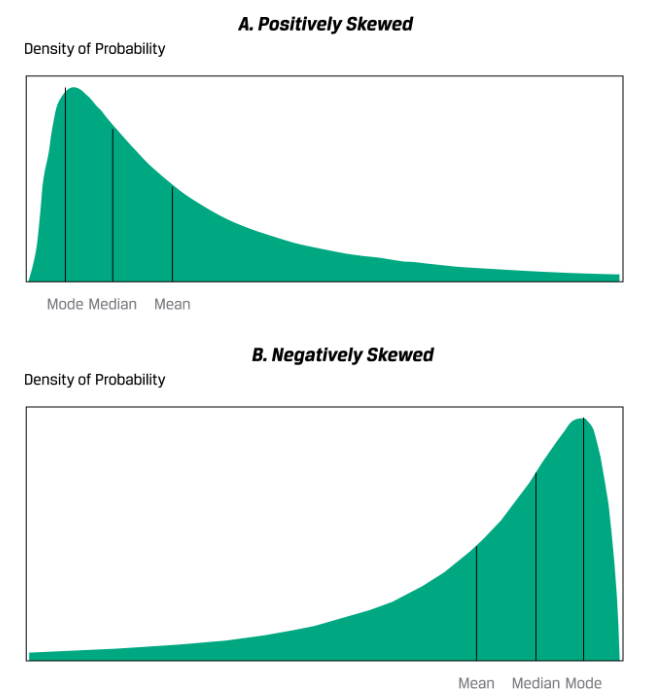
Skewness
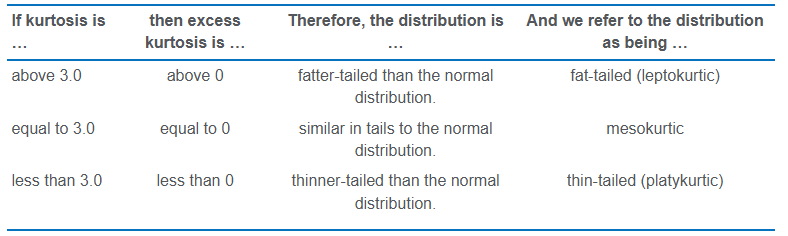
kurtosis
A distribution that has fatter tails than the normal distribution is referred to as leptokurtic or fat-tailed; a distribution that has thinner tails than the normal distribution is referred to as being platykurtic or thin-tailed; and a distribution similar to the normal distribution as it concerns relative weight in the tails is called mesokurtic.
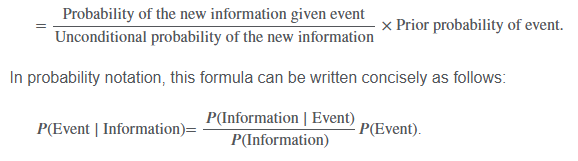
Bayes Formula
resampling
epeatedly draws samples from the original observed data sample for the statistical inference of population parameters
Bootstrap
resamples a dataset as the true population, and infers from the sampling statistical distribution parameter values (i.e., mean, variance, skewness, and kurtosis) for the population
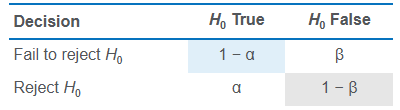
Hypothesis testing
the null hypothesis is what we want to reject
the null hypothesis needs to have the = in it
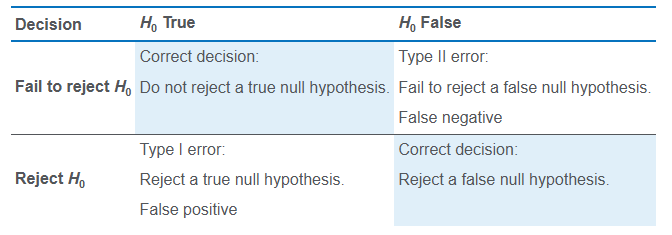
Type 1 & Type II error
The probability of a Type I error is denoted by the lowercase Greek letter alpha, α.
The probability of a Type II error is often denoted by the lowercase Greek letter beta, β.
Sampling error
the difference between the observed value of a statistic and the quantity it is intended to estimate as a result of using subsets of the population
power of a test
the probability of correctly rejecting the null—that is, the probability of rejecting the null when it is false. The power of a test is, in fact, the complement of the Type II error.
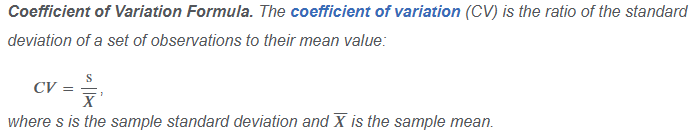
Coefficient of Variation Formula
CV measures the amount of risk (standard deviation) per unit of reward (mean return)
spurious correlation
correlation between two variables that reflects chance relationships in a particular dataset;
correlation induced by a calculation that mixes each of two variables with a third variable; and
correlation between two variables arising not from a direct relation between them but from their relation to a third variable.
Monte Carlo simulation
generation of a very large number of random samples from a specified probability distribution or distributions to obtain the likelihood of a range of results
central limit theorem
as we increase the size of a random sample, the distribution of the sample means tends towards a normal distribution and the sampling error of the sample mean is reduced
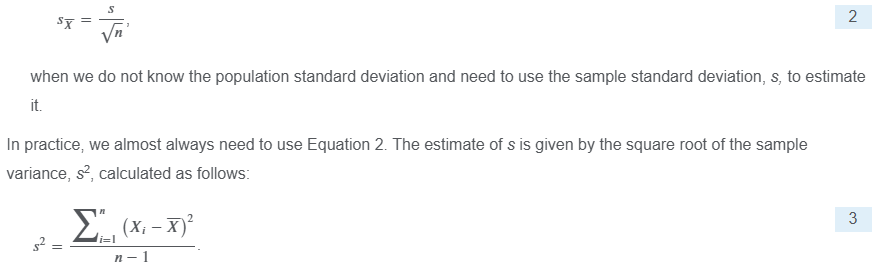
Standard Error of the Sample Mean
standard error measures how much inaccuracy of a population parameter estimate comes from sampling. If we want to draw conclusions about how spread out the data are, standard deviation is the statistic to use. If we want to find out how precise the estimate of a population parameter from sampled data is relative to its true value, standard error is the statistic to use.
Jackknife
Unlike bootstrap, which repeatedly draws samples with replacement, jackknife samples are selected by taking the original observed data sample and leaving out one observation at a time from the set (and not replacing it).
sum of squares total (SST)
dependent and independent variable
We refer to the variable whose variation is being explained as the dependent variable, or the explained variable; it is typically denoted by Y. We refer to the variable whose variation is being used to explain the variation of the dependent variable as the independent variable, or the explanatory variable
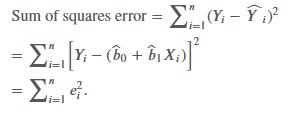
sum of squares error (SSE)
Fitting the line requires minimizing the sum of the squared residuals, the sum of squares error (SSE), also known as the residual sum of squares:
Homoskedasticity
the variance of the residuals is the same for all observations
key assumptions to be able to draw valid conclusions from a simple linear regression model
Linearity: The relationship between the dependent variable, Y, and the independent variable, X, is linear.
Homoskedasticity: The variance of the regression residuals is the same for all observations.
Independence: The observations, pairs of Ys and Xs, are independent of one another. This implies the regression residuals are uncorrelated across observations.
Normality: The regression residuals are normally distributed.
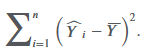
sum of squares regression (SSR)
The sum of squares regression is the sum of the squared differences between the predicted value of the dependent variable, 𝑌ˆ𝑖, based on the estimated regression line, and the mean of the dependent variable, 𝑌-:
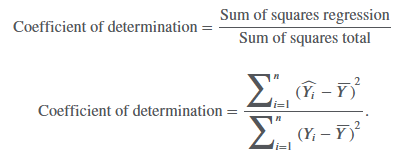
coefficient of determination (R2)
the percentage of the variation of the dependent variable that is explained by the independent variable:
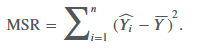
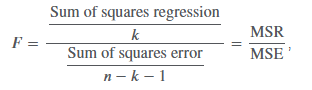
mean square regression (MSR)
the same as the sum of squares regression
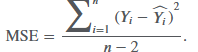
mean square error (MSE)
sum of squares error divided by the degrees of freedom
F-statistic
Whereas the coefficient of determination—the portion of the variation of the dependent variable explained by the independent variable—is descriptive, it is not a statistical test. To see if our regression model is likely to be statistically meaningful, we will need to construct an F-distributed test statistic.
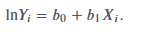
log-lin model,
the dependent variable is logarithmic but the independent variable is linear
standard error of the estimate

Safety first ratio
the risk that portfolio value (or portfolio return) will fall below some minimum acceptable level over some time horizon

SD when probability is involved
Slope coefficient
slope of a linear regression is the ratio of the covariance between Y and X to the variance of X
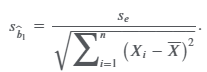
standard error of the slope coefficient
the ratio of the model’s standard error of the estimate (se), introduced later, to the square root of the variation of the independent variable
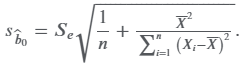
standard error of the intercept
t-statistic, z-statistic, F-statistic
t-statistic is used in tests concerning differences between population means
z-statistic may be used in tests concerning a single mean if the population has a known variance, or the variance is unknown but the sample size is large.
F-statistic is used in tests concerning differences between population variances.