Intro to digital marketing - Chapter 3: Analytics
1/38
There's no tags or description
Looks like no tags are added yet.
Name | Mastery | Learn | Test | Matching | Spaced |
|---|
No study sessions yet.
39 Terms
Web analytics
Provides info about a site’s traffic and can give insights about the best traffic sources and content changes that can increase transactions and conversions
The two objectives a web analytics package must accomplish
Gathering data
Giving summary reports of data
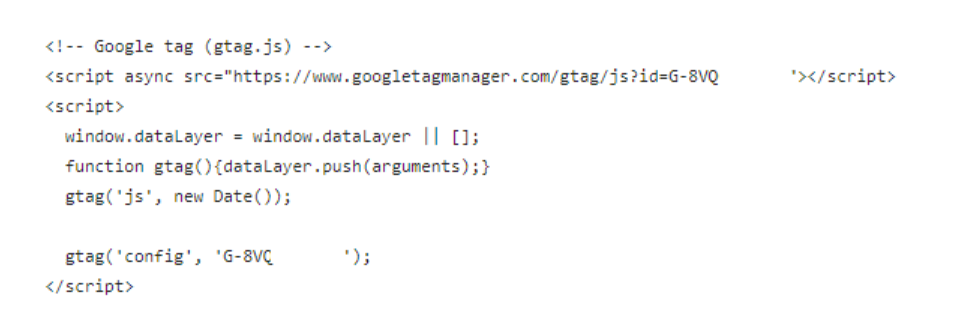
How is a web analytics package installed
It’s granted access to a site through the installation of a few lines of code on each page of the site; a small mistake in the code can cause fatal errors that can prevent sites from loading entirely
How is a web analytics package installed (con’t)
For Google analytics, the code’s written into the <HEAD> of each page of a website
How a web analytics package works
Traffic information is passed through it to the package’s server in order to make a summary report on the data
How a web analytics package works (con’t)
Info about what page and when/where it came from is included, and info that’s been aggregated and sorted will allow the owner to make inferences on the traffic to the site (e.g. total revenue, time spent, number of sessions, etc)
Timestamps
Allow the analytics package to calculate how long users are spending on each page
Navigation source
Knowing how users are getting to the site (whether through search engines, ads, URLs, etc). Sites can make this data specific by logging where the ad the user clicked on originated from
Technical information
Knowing technical info about each user, such as the browser they’re using, screen size, operating system, etc
Geography
Deciphering the general geography of the user, typically up to the zip code
Key Performance Indicators
Metrics sites consider to be the most important measures of success; sites must individually determine which KPIs are best for them
Lead generation KPIs
Users and ways of increasing their amount
Conversion rate and ways to track them
Close rate (the % of leads that convert into revenue)
Close deal value and how much they’re worth to the firm
Revenue per session
Media KPIs
Sessions and how they’re generated
Pages per Session and how much engagement there is
Average engagement time which is how long people are spending on the site
Conversions and if users are doing the desired actions (e.g. signing up for emails, making accounts, etc)
Attribution
What route the user takes to buy something from the site
Last-click attribution
When full credit for a customer’s action is given to the source that recently brought the consumer to the sight
First-click attribution
When full credit for a customer’s action is given to the source that first brought the consumer to the sight
Linear attribution
1/3 credit is given to each click
Time-decay attribution
Credit is given to the most recent clicks
Google Analytics
Allows users to run a kind of sensitivity analysis with different attribution methods
Return On Ad Spend (ROAS)
If the calculated ROAS is consistent across multiple attribution methods, then one can be confident in the results; otherwise a switch to another attribution tool may be needed
Data-driven attribution
Calculates the ROAS of multiple ad channels via counterfactual comparisons; needs a large amount of data
Counterfactual
A what-if comparison
e.g. If 1000 people clicked on an ad and made $5000, a counterfactual could be how many sales revenue could have come if the 1000 people weren’t shown the ad
Carefully controlled experiment
A firm runs ads on a group of target customers and hide those ads from a randomly chosen group of similar customers; they should then track website visits and conversions from both groups to see which group made more purchases
Google analytics 360
Is $150,000/month
Is more advanced
Meant for firms with larger site and app-capacity levels
Google tag manager
A hub that manages all tracking codes a site may need to install
WordPress
A tool which allows code to simply be pasted into the header file one time
Making decisions with analytics
If the profit per session is high, bring more traffic; if it’s low, improve conversion
Segmentation
Methods of dividing customers into groups that differ in a meaningful way
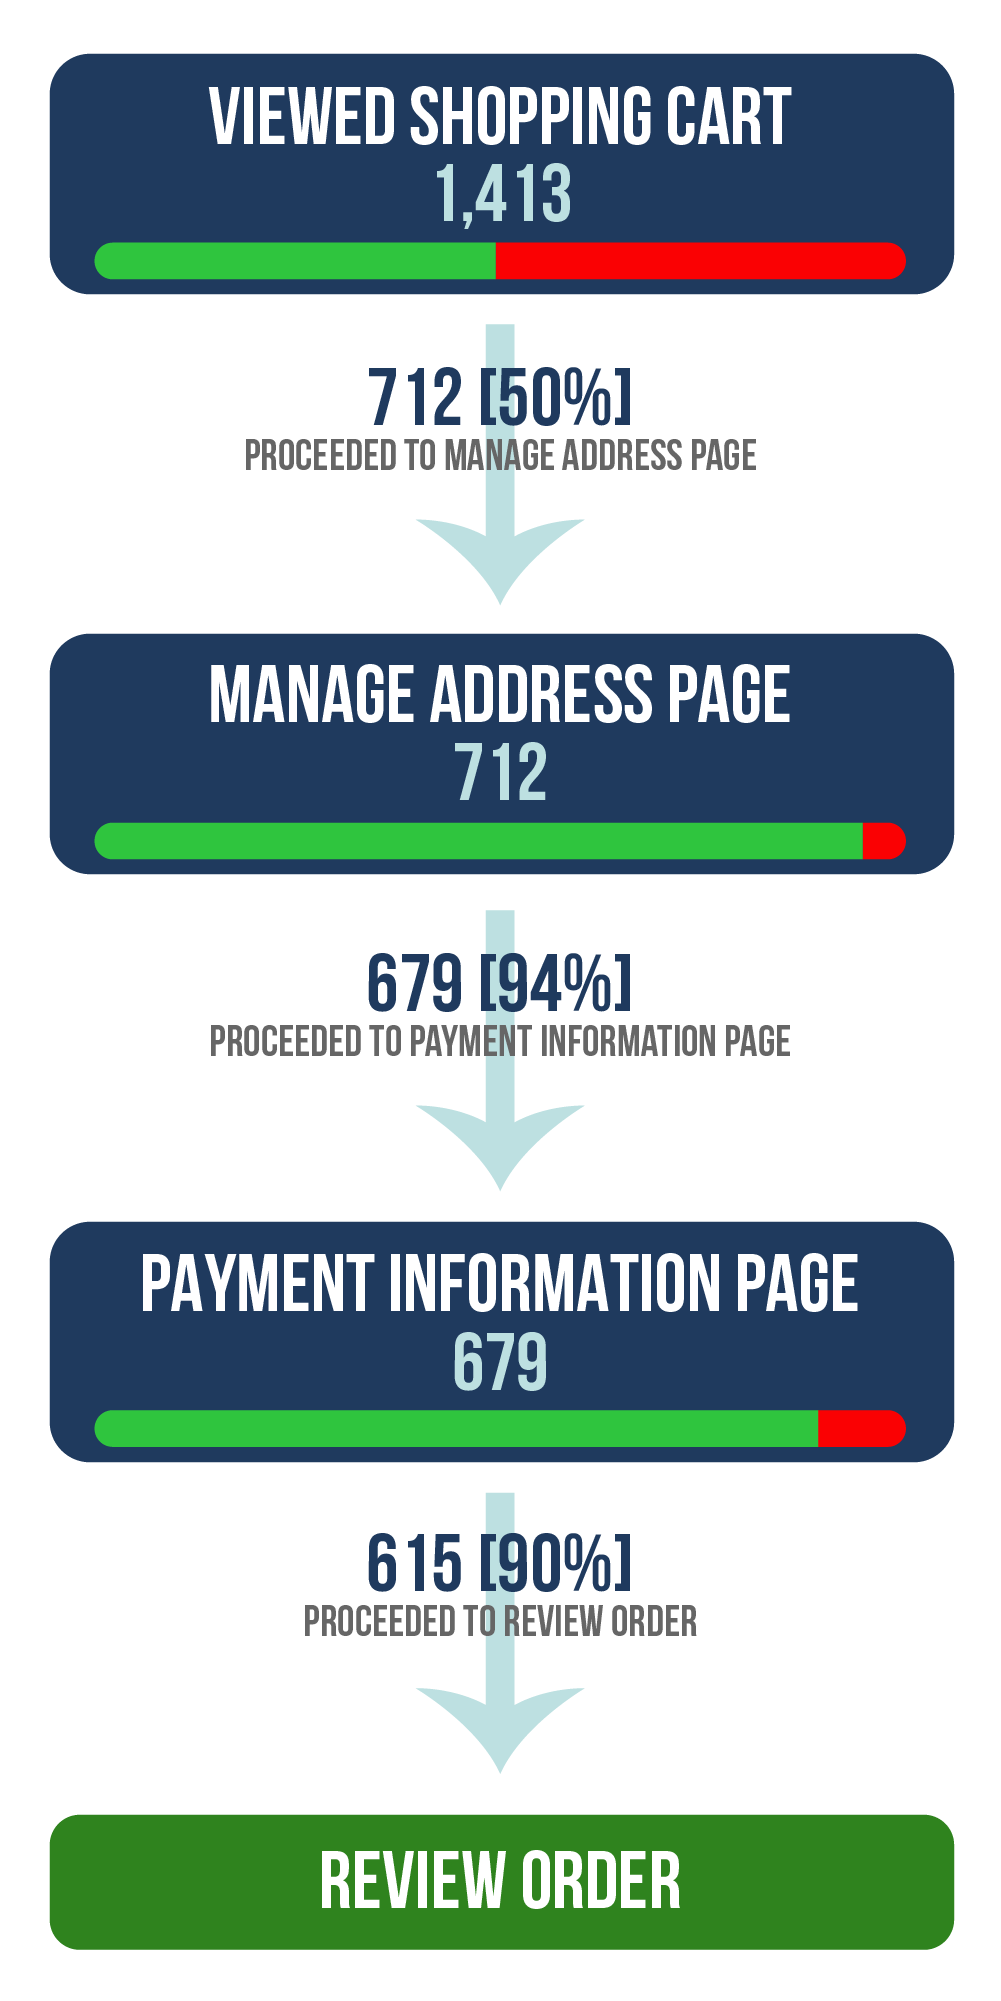
Conversion funnel
A useful way for consumers to divide the purchase procedure into steps and for a team to see where in the process consumers are having issues or giving up process (fallout points) in order to provide improvement
Analysis paralysis
The large amount of data prevents the analyst from taking meaningful action
Actionable insights
Insights into site users’ behaviour that can be used to take actions for improving site profitability
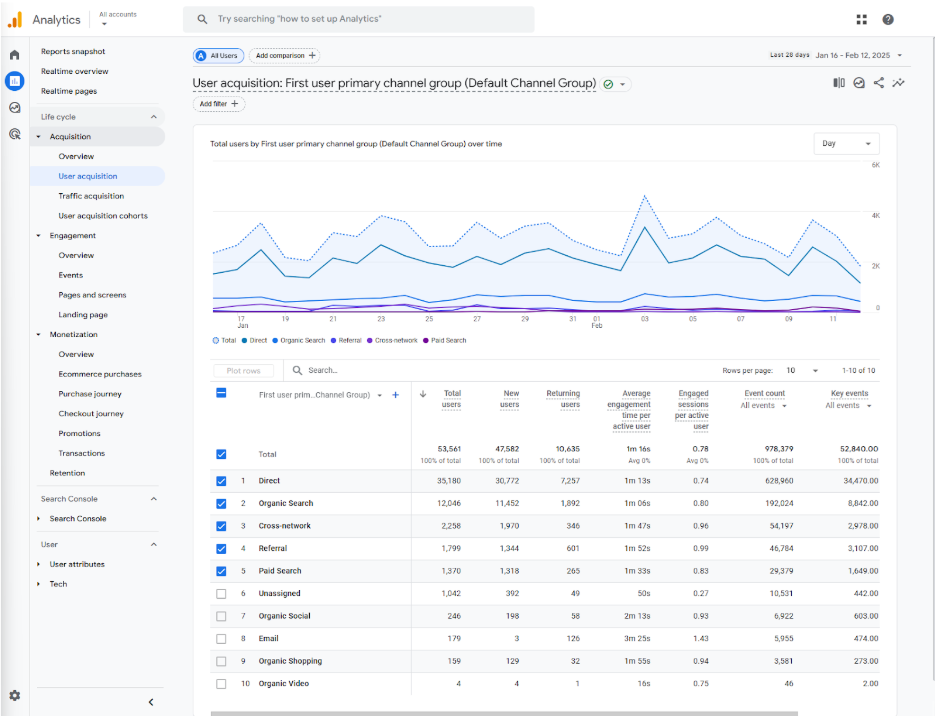
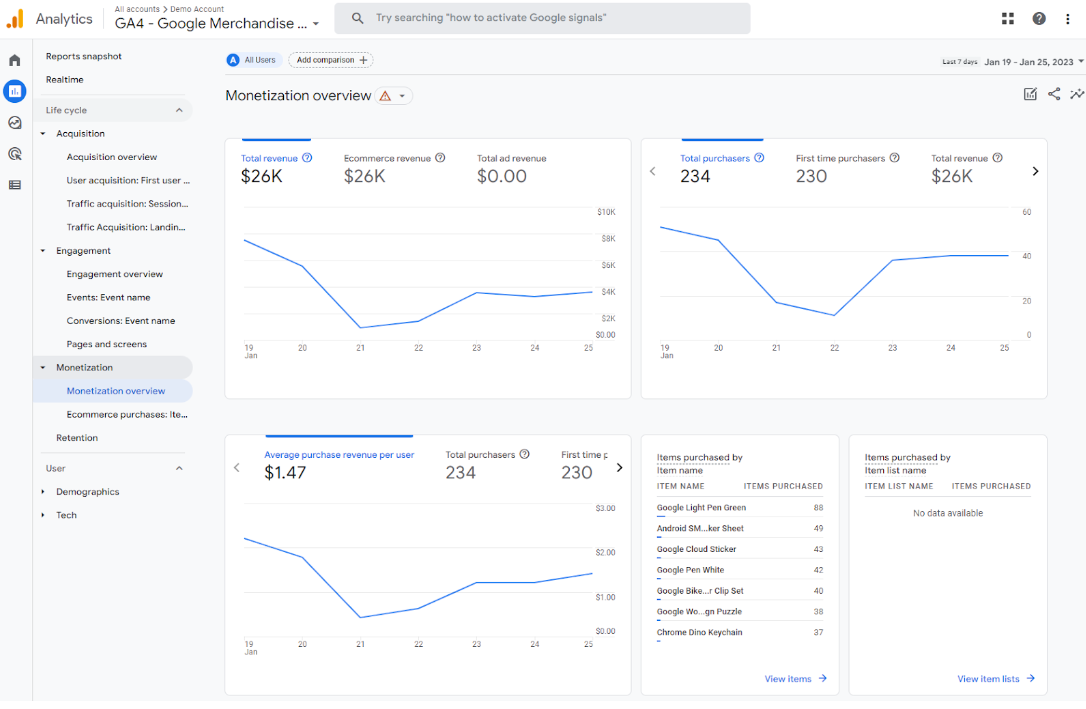
Traffic metrics
Shows user and traffic acquisition reports and divides them across the source channel
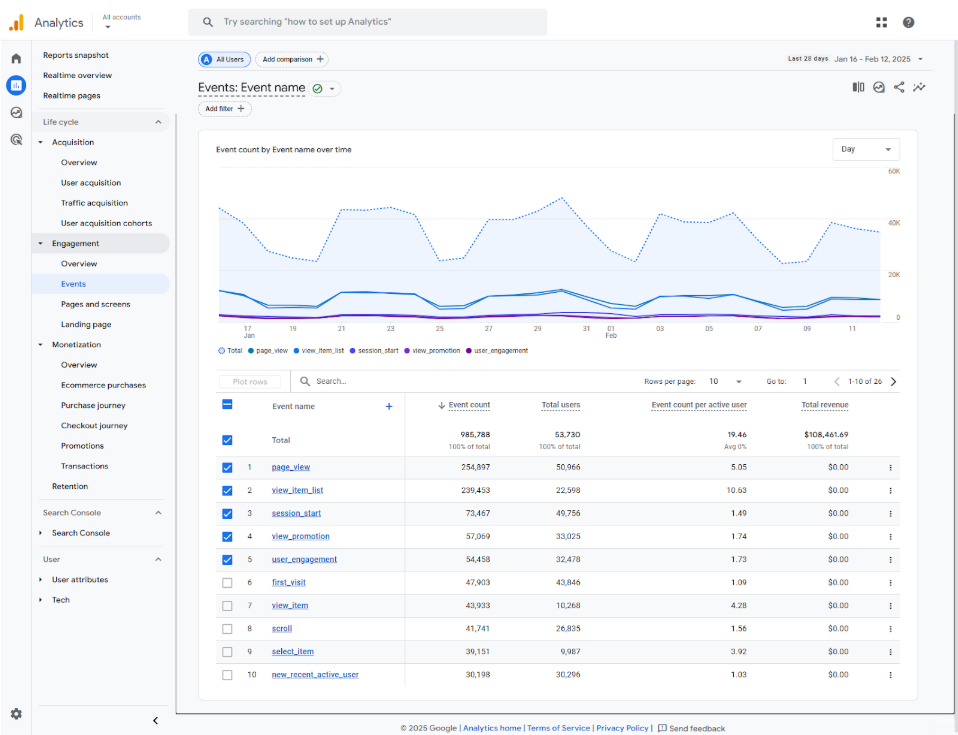
Conversion/engagement metrics
Shows the conversion rate and amount of clicks
Revenue metrics
The average purchase revenue per user is calculated as total revenue/users
What is SEOs
Search Engine operation
Sessions
The amount of times a person visits a site before they convert
Audience awareness model
Awareness
Interest
Desire
Action
Demand harvesting
Users who know about a product, but know nothing about a seller (goes through all steps of the AIDA model)
Demand generation
An unaware customer (goes through only the interest and action steps)