RBC Indices
1/38
There's no tags or description
Looks like no tags are added yet.
Name | Mastery | Learn | Test | Matching | Spaced | Call with Kai |
|---|
No analytics yet
Send a link to your students to track their progress
39 Terms
RBC indices
Using RBC count, Hb, Hct calculate:
MCV
MCH
MCHC
RDW
RBC count
TOtal erythrocyte count per mm³ or ul or per L
10^6/ul or 10^12/L (SI)
Determination of:
RBC production
OXygen transport
Identification of anemia
Response to treatment
Reference Values:
Men - 4.6 - 6.2 × 10^6 / uL
Women - 4.2 - 5.4 × 10^6 / uL
Children - 4.0 - 5.5 × 10^6 / uL
Procedure:
Electronic Impedance
Flow Cytometry
ASCP combined Reference Range - 4.0 - 6.0 × 10^6 / uL
Electronic Impedance
Cells flow through a small aperture between two
electrodes in an ionic solution
As cells pass between the electrodes resistance between
the electrodes increases
Resistance R increases, Voltage, V, increases
Producing a voltage pulse of short duration
The number of voltage pulses is proportional to the
frequency of cells passing through the aperture
The magnitude of voltage pulse is proportional to the cell
volume and size (MCV)
Flow cytometry
technique for counting, examining and sorting microscopic cells suspended in a stream of fluid
sheath fluid
simultaneous analysis of the physical and/or chemical characteristics of single cells flowing through an optical/electronic detection apparatus
Each suspended cell, passing through the beam,
scatters the light in some way both forward and side
This combination of scattered light is picked up by the
detectors in flow cytometry
By analyzing fluctuations in brightness at each detector
it is possible to deduce the size and complexity of each
individual particle.
FSC correlates with the cell volume (size)
SSC measures the inner complexity of the cell
i.e. shape of the nucleus, the amount and type of
cytoplasmic granules or the membrane roughness
Flow cytometry analysis principles
in flow cytometry analysis a beam of light (usually laser light) of a single frequency (color) is directed onto a hydrodynamically focused stream of sheath fluid
A number of detectors are aimed at the point where the stream passes through the light beam:
One in line with the light beam (forward scatter, FSC)
one in perpendicular to it (side scatter, SSC)
RBC Histograms
Macrocytosis
Shift to Right
Microcytosis
Shift to left
Decreased RBC values
Anemia
Aplastic anemia
Iron deficiency anemia
Hemolytic anemia
B12 deficiency
Folic acid deficiency anemia
Anemia of blood loss
Anemia of Chronic Diseases
RA & SLE
Leukemia
Hypothyroidism
Liver disease
Kidney disease
Increased RBC values
Polycythemia
Primary
Secondary
Heart failure, causing low blood O2
Lung disease: emphysema, COPD, pulmonary fibrosis
Hypoxia
Carbon monoxide (CO) exposure
Erythrocytosis
(increased RBC production)
Congenital heart disease
Severe dehydration
Smoking
Living in high altitude
Performance enhancing drugs
Anabolic steroids, testosterone
Erythropoietin
Hemoconcentration
Physiological variations on RBC counts
Posture:
Blood samples is obtained from a
healthy persons in a recumbent
position
RBC count is lower than normal
Exercise:
Extreme exercise and excitement
Dehydration:
Hemoconcentration
Severe burns
Severe, persistent vomiting or diarrhea
Physiological Variations
Age:
Normal RBC of a newborn is higher than
that of an adult
Drop to the lowest point in life at 2 to 4
months
Will increase to adulthood
Ultimately lead to decreases RBC count
Altitude:
The higher the altitude the greater the
increase in RBC
Decreased oxygen content of the air
stimulates the RBC to rise (erythrocytosis)
Pregnancy:
There is a normal decrease in RBC
count
Associated with body fluid increases in
pregnancy
Normal number of erythrocytes
becoming more diluted
Drugs:
Gentamicin and methyldopa
Increase RBC count
Hematocrit (HCT)
Red blood cell mass
Packed red blood cell volume
Percentage of red cells in whole blood
hematocrit means to separate blood
plasma and blood cells are separated by centrifugation
Hematocrit Reference values
Men - 40-54% or 0.40-0.54
Women - 37-47% or 0.37-0.47
Newborn - 50-62% or 0.50-0.62
ASCP combined adult range - 35-50%
Microhematocrit
Done on small amount of blood
usually drawn from finger lance
Men:
40-54% or 0.40-0.54
Women:
37-47% or 0.37-0.47
Newborns:
44-65% or 0.44-0.65
Microhematocrit Procedure
A capillary micro-hematocrit tube
Anticoagulant added
Filled two thirds with venous blood
the tube is then centrifuged
separate the cellular elements from the plasma
the height of the packed cells in the tube is measured
indicates the hematocrit
automated hematocrit
calculated by
Hct = [RBC x MCV] / 10
Decreased Hct Values
Anemia
Aplastic anemia
Iron deficiency anemia
Thalassemia
Hemolytic anemia
B12 deficiency
Folic acid anemia
Anemia of blood loss
Anemia of Chronic Diseases
RA & SLE
Leukemia
Hypothyroidism
Liver disease
Kidney disease
Reaction to chemicals or drugs
Reaction to infectious agents such as Clostridium sp.
Reaction to physical agents
Prosthetic heart valves
Severe burns
Increased Hct Values
Polycythemia
Primary and Secondary
Erythrocytosis (increased RBC production)
severe dehydration
shock
hemoconcentration
Rule of Three
The Hct should be approx. 3 x Hb +- 3% if the patients RBC are normocytic and normochromic
if it does not agree it should be repeated
may be indicative of automated error
Hemoglobin (Hb or Hgb)
Hemoglobin
The main component of erythrocytes
Transportation of oxygen and carbon dioxide
An important buffer for hydrogen ion
Procedure
Automated methods
Cyan-met-Hb principle
Hgb is converted to cyanmethemoglobin
Absorbance of the cyanmethemoglobin at
540 nm is directly proportional to the
hemoglobin concentration
Hemoglobin Reference Values
Women: 12-15 g/dl
Men: 14-18 g/dl
Newborn (both genders): 14-20 g/dl
ASCP combined adult Reference Range: 12-18 g/dl
Purpose of Hemoglobin tests
Diagnose Anemia
Oxygen Transport capacity
Follow up to treatment for anemia
Evaluate polycythemia
Decreased Hb Values
Anemia
Aplastic anemia
Iron deficiency
anemia
Thalassemia
Hemolytic anemia
B12 deficiency and
folate acid anemia
Anemia of blood loss
Anemia of Chronic
Diseases
RA & SLE
Leukemia
Hypothyroidism
Liver Disease
Renal Disease
Hemolytic reactions
Transfusion reactions of
incompatible blood
Reaction to chemicals or
drugs
Reaction to infectious agents
Clostridium sp.
Reaction to physical
agents,
severe burn
prosthetic heart valves
Increased hemoglobin levels
Polycythemia
primary and secondary
hemoconcentration of the blood
chronic obstructive pulmonary disease
congestive heart failure
variance in hemoglobin levels
post transfusion
1 unit of packed RBC
raise the Hgb by 1 gram
physiological factors:
high altitudes
excessive fluid intake
age/newborns
pregnancy
smoking
red blood cell indices
Mean corpuscular volume (MCV)
Mean corpuscular hemoglobin (MCH)
Mean corpuscular hemoglobin concentration (MCHC)
Red cell indices characterize RBC morphology
RBC indices characterize erythrocytes size as:
Normocytic
Microcytic
Macrocytic
Hemoglobin content is classified as:
Normochromic
Hypochromic
Mean corpuscular Volume (MCV)
Reference value:
80-100 fl
measures the average volume of a RBC
is the best index for classifying anemia
categorizes red blood cells by size
MCV
if the MCV is normal
the red blood cells are normocytic
look for normal size RBCs
if the MCV < 78 fl
the red cells are microcytic
look for small RBCs
if the MCV > 100 fl
the red cells are macrocytic
look for large RBCs
MCV procedure
Electronic impedance
measures pulse height of the electrical signal
as the red cells pass between two electrodes
Flow cytometry
forward scatter - cell size
manual calculation
MCV = Hxt x 10 / RBC
Clinical implications of MCV (decreased MCV < 78 fl)
decreased MCV (<78 fl)
Microcytic anemia
iron-deficiency anemia
Thalassemia
Anemia of chronic disease/inflammation
Sideroblastic anemias
lead poisoning
Porphyria
Normal MCV (80-90 fl)
The patient has no sign of BM failure
Normocytic Normochromic anemias
Acute blood loss anemia
Hemolytic anemia
Aplastic anemia
Pure red cell aplasia
Kidney disease
Decreased erythropoietin production
Malnutrition
Stem cell related anemia
Elevated MCV (>100 fl)
Megaloblastic Anemia
(MCV 100-160 fl)
Vitamin (B12 ) Deficiency
Folic Acid Deficiency
Pernicious anemia
Impaired B12 absorption:
Intrinsic factor deficiency
Gastrectomy (total and partial)
Anemia of liver disease
Increased reticulocyte production
Mean corpuscular hemoglobin (MCH)
Measures the average concentration of
hemoglobin in a red blood cell
Manual Calculation Formula
MCH = Hb (g/dl) x 10 / RBC
Reference Values
Combined Adult Range: 26-34 picograms
(pg)/cell
(Normally higher in newborns and infants)
Clinical Implications of MCH
MCH normal:
Normochromic anemia
Hemolytic anemia
Blood loss anemia
Anemia of chronic disease/inflammation
Increased MCH
Megaloblastic anemia
Anemia of liver disease
Decreased MCH (Hypochromic anemia)
Fe deficiency anemia
Thalassemia
Lead poisoning, Porphyria, Sideroblastic anemia
Mean Corpuscular Hemoglobin Concentration (MCHC)
The average concentration of hemoglobin per volume of
red blood cells (100 ml)
Categorizes red blood cells according to their
concentration of hemoglobin
Categorized RBCs as hypochromic or normochromic
MCHC relates to the color of the cells
Used to give a rough guide to what shade of red RBC will
be
Lower MCHC = Paler than normal
Cells with too little hemoglobin are lighter in color with a
larger pale central area
Procedure for MCHC
manual calculation formula
MCHC = Hgb (g/dl) x 100 / Hct (%)
Reference values: 32-36%
MCHC normal
Normal MCHC
Acute blood loss
Hemolytic anemias
Aplastic anemia
Megaloblasic anemia
Anemia of liver disease
Anemia of chronic disease/inflamation
Clinical Implications of MCHC
Decreased values
Hypochromic anemia
Iron deficiency
Thalassemia
Lead poisoning
Porphyria
Sideroblastic anemia
Increased values
An MCHC > 38%
Indicates Hereditary Spherocytosis
MCHC is not increased in pernicious anemia
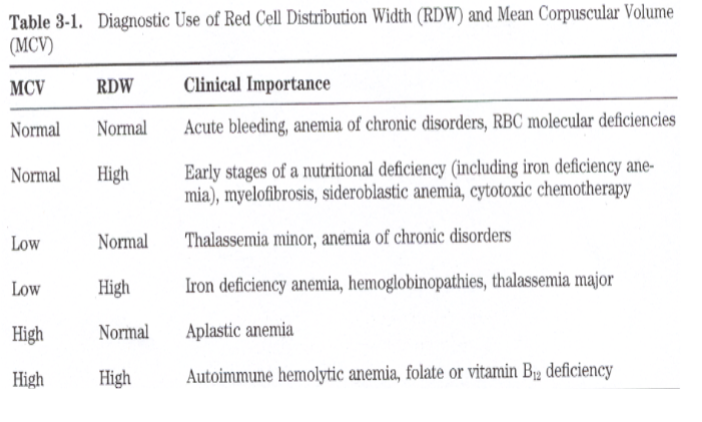
RDW-Red cell Distribution width
Reference Values: 11.5-14.5%
Numerical expression which correlates with
the degree of anisocytosis
Derived from RBC Histogram
Useful in differentiating Thalassemia from
iron deficiency anemia
Low MCV, High RDW = Iron Deficiency anemia
Low MCV, Norm RDW = Thalassemia, ACD
MCV and RDW with clinical importance Table