12. Core Practical 4
1/14
There's no tags or description
Looks like no tags are added yet.
Name | Mastery | Learn | Test | Matching | Spaced | Call with Kai |
|---|
No analytics yet
Send a link to your students to track their progress
15 Terms
What happens during this practical?
The primary protein found in milk is called casein and gives milk its characteristic white colour.
Specific enzymes break down the casein in milk and cause the milk to turn white to clear.
Describe the bond that is broken down in proteins:
Peptide bond
Predict the molecules formed when the protein is broken down:
Amino acid
Suggest the type of reaction that occurs:
Hydrolysis
Predict the name of the enzyme that digests proteins:
Protease
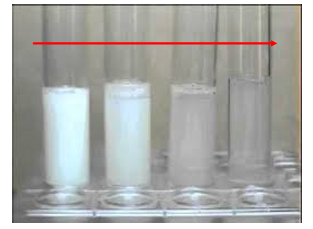
Describe what happens to the colour of the enzyme and milk solution over time:
The milk solution turns white to colourless over time.
what happens to the amount of light that would pass through the solution:
When more casein protein is broken down, it will be colour less.
This means more light will pass through when more casein is broken down.
Why do we use a colorimeter in this exp?
As the solution becomes clearer, less light is absorbed by the solution so the absorbancy reading decreases
→ This provides quantitative analysis rather than qualitative so is better than observation
Why do we need to calibrate the equipment?
Data is being compared to a standardised value so the results can then be compared in a valid manner.
What is the aim of the experiment?
Investigate the effect of enzyme concentration on the initial rate of reaction between trypsin and casein solution.
What is the independent variable?
Enzyme concentration (TRYPSIN)
e.g. 0,0.1,0.2,0.3,0.4,0.5 moldm-3
What is the dependent variable?
absorbancy = initial rate of reaction
What is the control variable?
same volume of enzyme solution
same temp volume of trypsin
How do we make the exp reliable?
Repeat each enzyme concentration 5 times and calculate an average.
What is the method?
Pipette 2cm2 of protein solution into a cuvette.
Pipette 2cm2 of the protease solution into the cuvette.
Mix thoroughly & immediately put this cuvette into the colorimeter and start the clockMeasure absorbance at suitable time intervals for 5 minutes or until there is little change in reaction
Discard the content of the cuvette & rinse with distilled water
Plot a graph of absorbance against time.
Use the graph to determine the initial rate of reaction.
This is the initial gradient of the graph and should be the steepest part.
Calculate the initial rate by dividing the change in the y-axis by the change in x-axis values and use whatever units you have plotted on you r- and x-axes.Repeat steps 1-5 of the exp using a range of different enzyme concentrations, ensuring that other conditions are unchanged.
Plot a separate absorbance against time graph for each enzyme concentration & calculate an initial rate of reaction from each onePresent your results in the most appropriate way
Identify any trends in your results
Explain any trend or patterns, supporting your statements with evidence from your data and using biological knowledge
State a clear conclusion to your work, summarising what you gave found out and comment on the validity of your conclusion