lecture 7- correlational analysis
1/6
There's no tags or description
Looks like no tags are added yet.
Name | Mastery | Learn | Test | Matching | Spaced | Call with Kai |
|---|
No analytics yet
Send a link to your students to track their progress
7 Terms
What is a scatterplot?
Describes the associations between 2 variables.
An association can be characterised by its
direction - positive/negative
Strength- strong/weak/no association
Shape- linear (most common), u-shaped, inverted u-shaped
What are correlation coefficients? Give 2 examples.
Descriptive stats that describe an association between variables.
pearson product-moment correlation
Spearman rank correlation
What is pearson’s correlation?
Denoted as r
describes linear associations between variables
Used for interval/ratio level data that is normally distributed
-1 = perfect negative linear association
0 = no linear association
+1 = perfect positive association
What is spearman’s correlation?
Denoted as r
describes linear associations between variables
Used for ordinal level data or interval/ratio data that is skewed
Uses ranks instead of raw data values
-1 = negative, 0= no correlation, +1 = positive correlation
How do you report a correlation test?
“ A spearman’s/pearson’s correlation analysis showed that was/wasn’t a significant positive/negative correlation between FOMO and the number of drinking establishments attended, rs(33)=.62, p<.001.”|
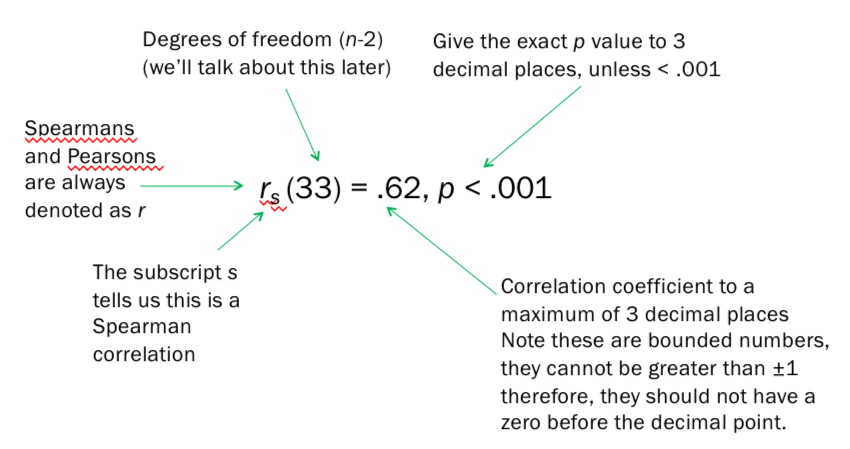
What are degrees of freedom?
A number that tells you about the sample size and the specific test conducted.
A number of pieces of info that are free to vary when computing stats.
Usually a bit smaller than number of observations. (N-2)
What do you do if you want to conduct one-tailed test but only have p value from two-tailed test?
Divide p value by 2.