Pysch Stats: NHST -> T Tests (Harnett 6)
1/30
There's no tags or description
Looks like no tags are added yet.
Name | Mastery | Learn | Test | Matching | Spaced | Call with Kai |
|---|
No analytics yet
Send a link to your students to track their progress
31 Terms
Margin of Error (MoE)
An estimate of the sampling error (the portion of the confidence interval formula to the right of the plus/ minus sign)
What does null hypothesis significance testing do?
It determines whether a difference is statistically significant and whether the observed difference is likely due to chance
Reject or fail to reject the null hypothesis
P value
The probability of observing a result that extreme just by random chance if there isn’t a real effect
Why is a p value more likely to acheive statistical significance when the sample size is large?
When a sample size is large, the likelihood of statistical signifiance is increased, since random errors are reduced and it’s easier to detect smaller differences
True Positive
When NHST rejects the null hypothesis and the null hypothesis is false
+ is when null is rejected and null is wrong
True Negative
When NHST fails to reject the null hypothesis and the null hypothesis is true
- is when the null isn’t rejected and null is true
Why does NHST have error?
NHST has error, because it uses a sample, instead of a whole population
It has error due to sampling error
Samples don’t always represent the population
Type 1 Error
When you reject the null hypothesis, even though it’s true
Data is not statisically significant
What is alpha in type 1 errors?
Alpha is the probability of commiting a Type 1 error
Rejecting a null even though it’s true
Type 2 Error
Failing to reject the null hypothesis when the null is false
Should have rejected null hypothesis
Beta
The probability of commiting a Type 2 error
Probability of failing to reject a null hypothesis, when the null is false
What happens when you decrease the likelihood of a Type 1 error?
When you decrease the likeihood of a type 1 error, you increase the likeihood of a type 2 error
When you decrease the likelihood of a Type I error, you make it harder to reject the null hypothesis. This automatically makes Type II errors more likely
What does it mean when you set the alpha to 0.05?
When you set the alpha to 0.05, you commit the Type 1 error only 5 percent of the time
Reject the null when it’s true, only 5 percent of the time
NHST Version #1
Specify a null hypothesis
Calculate a 95% CI based on the sample data (I’m 95 percent confident)
Conclusion: Reject the null if the CI doesn’t overlap with the null population mean and fail to reject the null if the CI does overlap with the null population mean
Less complicated
Gives an actual estimate (a CI) of the actual effect
NHST Version #2
Specify a null hypothesis
Calculate a test statistic (like the z test statistic)
Calculate the probability of obtaining that test statistic, assuming the null hypothesis (p value)
If p is greater than alpha, reject the null and declare significance
Only evaluates the null hypothesis
In NHST is the alternative hypothesis tested?
No, the alternative hypothesis is not tested through NHST
Need other methods other than NHST
What is the probability of making a Type 1 error when you reject your null?
If you reject your null, your probability of making a Type 1 error is equal to your p value
9 percent chance of rejecting null so more probability of rejecting when shouldn’t
What does it mean about alpha the greater the alpha and the smaller the alpha?
The greater the alpha, the more likely you’ll make a Type 1 error (reject the null when it’s true)
The smaller the alpha, the more likely you’ll make a type 2 error (fail to reject the null, when it’s false)
What is a two tail p test?
A test that calculates the probability that a sample result is significantly higher or lower than the null hypothesis, assessing both directions (tails) of a probability distribution
What is the two tailed p value?
The two tailed p value (non directional test) is twice the one tailed p value, since it adds in the possibility that the answer to your research question is the opposite of what is expected
A psychologist claims that college students sleep an average of 7 hours per night during the semester. Random sample of 64 students report an average of 6.7 hours with a population SD of 1.2 hours.
Conduct NHST with CI
Conduct NHST with p values
Null hypothesis: College students sleep 7 hours per night during the semester
95 CI= X bar ± 1.96 x (o/ square root of n)
6.7 ± 1.96 x (1.2/ square root of 64)
(6.406, 6.994)
We are 95 percent confident that the true population mean is between 6.406 and 6.994 hours, thus we reject the null hypothesis
Z test= (X bar- u)/ SE
6.7- 7/ (1.2/ squre root of 64) = -2
Z score of -2= 2%, two tailed so 4%
Assuming the null is true, there is a 4 percent chance of observing this data, so reject null
What is degrees of freedom for a t test?
For a t test, degrees of freedom are n-1
What is the formula to estimate the population SD?
We can use Gosset’s formula to estimate the population SD
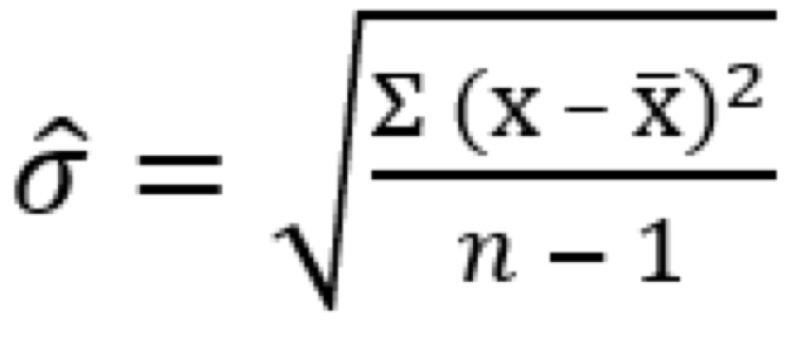
What does Gosset’s formula, dividing by n-1, rather than just n give us?
It gives us the estimated population SD based on a sample or o hat
What do you need to change if you use Gosset’s formula in your confidence interval estimate?
If you use Gosset’s formula in your confidence interval estimate, you need to compensate for the inaccuracy by increasing the confidence interval range
Increase the 1.96 number in the 95 percent confidence interval to the number on the t table
For t table, DF= n-1 and column is tail of CI (ex. for 95 percent CI, tail is 0.05)
NHST Process #1 with Gosset’s Formula
Specify a null hypothesis (an expected population mean)
Calculate a confidence interval based on your sample data (Using Gosset’s formula)
Conclude whether or not to reject the null based on whether or not the CI includes the expected mean
NHST Process #2 with Gosset’s Formula
Specify a null hypothesis
Calculate a test statistic (WITH GOSSET FORMULA)
Calculate the probability of obtaining a test statistic, under the null hypothesis
Conclude whether or not to reject the null based on whether or not that probability is small enough
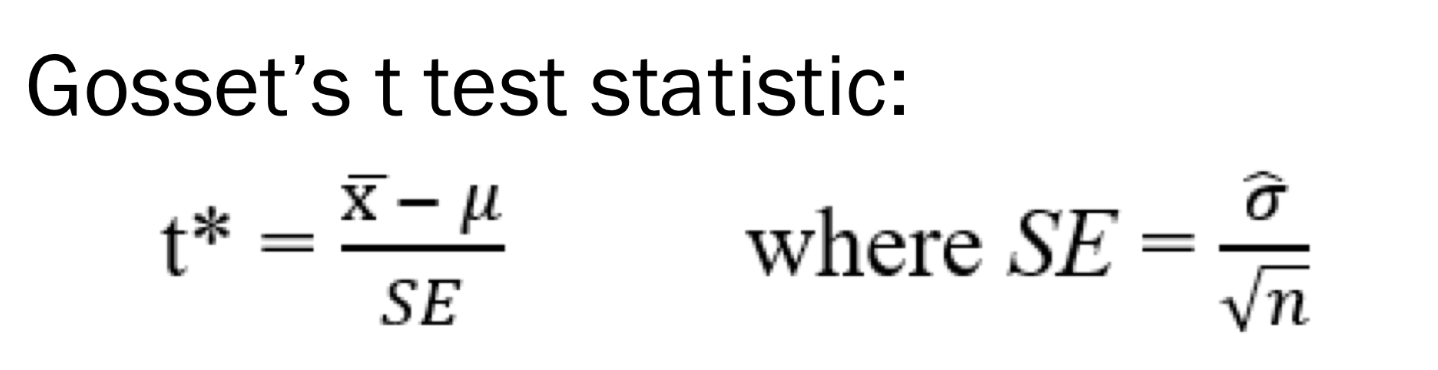
Gosset’s t test statistic
t= X bar - population mean/ SE
SE= estimated population SD/ square root of n
In NHST, what should you do, if you don’t know the population SD?
You must use Gosset’s formula to estimate the population SD and calculate a t test statistic, instead of a z test statistic
What do you convert a t testic statistic to?
You convert it to a two tailed p value to make it easier to analyze
One- sample t test
Compares a sample mean to an expected population mean
Needs the expected population mean, sample mean, estimated population SD using the sample