Psych 291 - Lecture 18 Factorial design variations
1/12
Earn XP
Description and Tags
not done
Name | Mastery | Learn | Test | Matching | Spaced | Call with Kai |
|---|
No analytics yet
Send a link to your students to track their progress
13 Terms
Review of Factorial Designs
Describe the difference between:
▪ Independent Variable
▪ Level
▪ Condition
▪ What is the minimum number of IVs in a factorial design?
▪ What do you know about a study if you are told it is a 3 x 2 x 4 factorial design?
▪ What is a main effect?
▪ How many main effects are possible in a factorial design?
▪ What is an interaction effect?
Interactions - food
A crossover interaction:
The effect of IV1 on the DV is positive at one level of IV2 but negative at another level of IV2
A spreading interaction:
The effect of IV1 on the DV is stronger at one level of IV2 than at another level of IV2
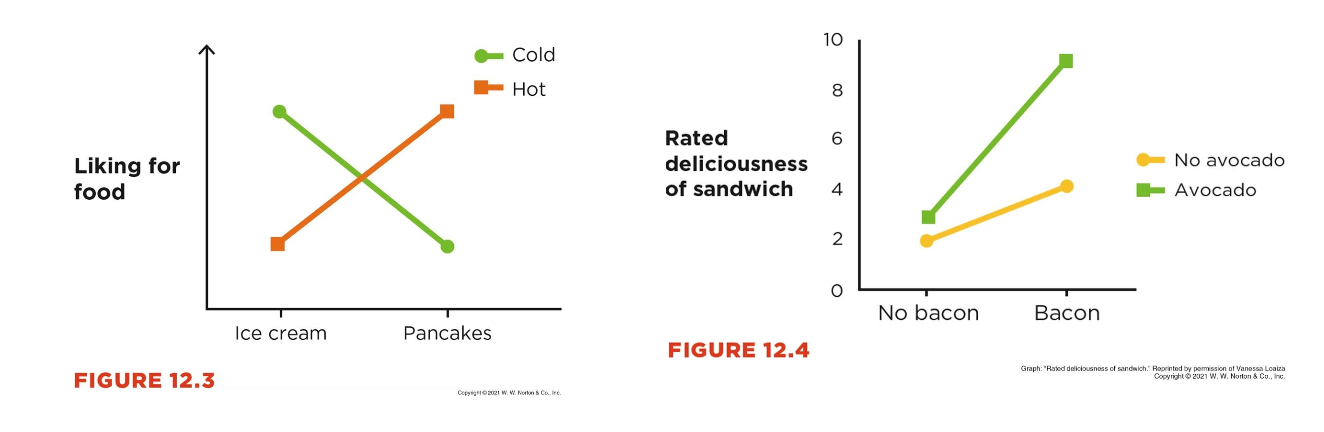
parallel lines means no interactions
Interactions - drivers
A crossover interaction:
The effect of IV1 on the DV is positive at one level
of IV2 but negative at another level of IV2
A spreading interaction:
The effect of IV1 on the DV is stronger at one
level of IV2 than at another level of IV2
Note: When the lines run parallel to each other (instead of
crossing over or spreading), this indicates there is no interaction.
Example - Are there any main effects? Is there an interaction?
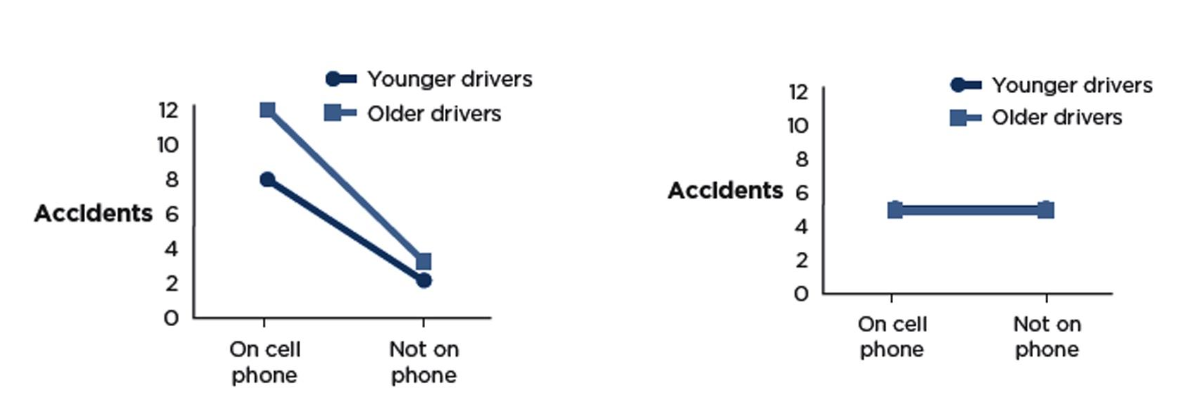
Main affects cell: (left) cell phone use makes you more likely to get into accidents
Age: (left) Older drivers get into more accidents
Interaction: (left) Spreading (effect of cell phone use is stronger for older drivers than younger)
Main affects cell: (right) no main affect of cell phone use
Age: (right) No main affect of age
Interaction: (right) no interaction - parallel lines
Example - Are there any main effects? Is there an interaction?
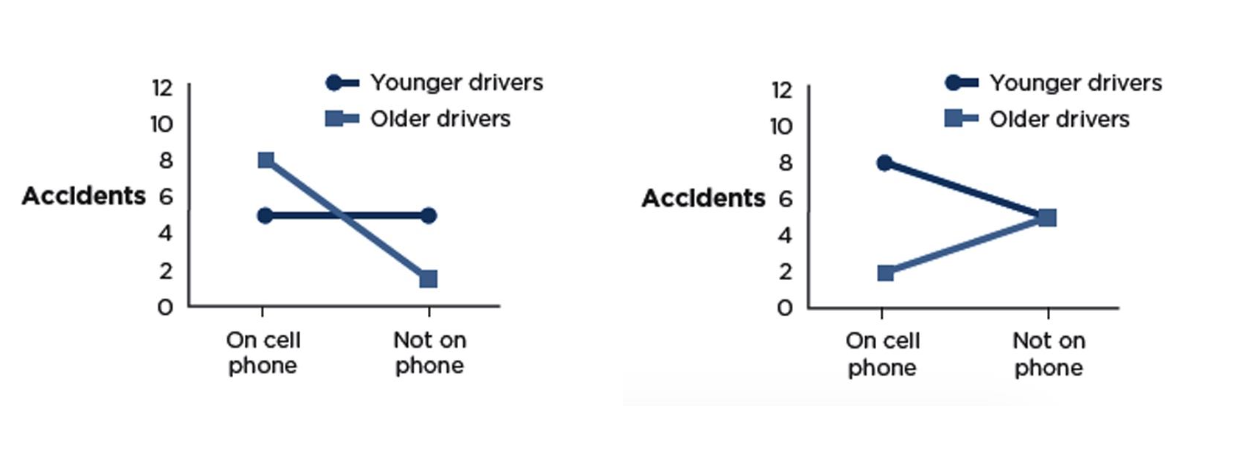
Main Effects cell : left - yes on average, ppl on cell got into more accidents (have to take average of both)
Age: left - old ppl get into more accidents
Interaction: left - for young no, but for old yes
cross over
Main Effects cell: right - on avg ppl had 5 accidents on cell, and 5 not on cell
Age: right - avg of young on cell and not on cell (7 accidents) , avg of old on cell and not on cell (4 aciidents) - so yes
Interaction: right - when ppl are on their phone it doesn’t matter
spreading
Test your knowledge
There appears to be a main effect of training on test score in this graph.
A. yes
B. no
C. I can’t tell.
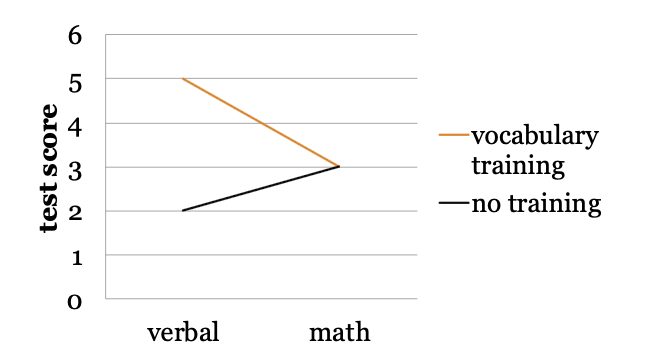
A: There is a main effect of training condition on test scores,
such that the vocabulary-training group scored higher than the
no-training group.
on avg. ppl did better with training than without
Test your knowledge
There appears to be an interaction effect between training and subject on
test score in this graph.
A. yes
B. no
C. I can’t tell.
A: There is an interaction between training type and subject, such
that on the verbal test, the vocabulary-training group did better
than the no-training group, but on the math test, the two groups
did not significantly differ
did not do better on math but yes on vocab
Factorial Variations
Independent Groups Factorial Designs
▪ or between-subjects factorial
▪ Within-Groups Factorial Designs
▪ or repeated-measures factorial
▪ Both IVs are manipulated as within groups
▪ Mixed Factorial Designs
▪ One IV is manipulated as independent groups and
one IV is manipulated as within groups
Practice Problem
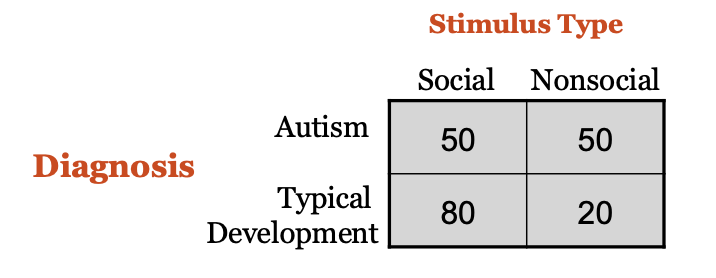
Researchers were interested in understanding how children with autism see and understand the world. Participants included children diagnosed with autism and typically developing children, who were all approximately the same age. All children were presented with several different stimuli on a large computer screen for one minute. Some of the stimuli on the screen were social (i.e., people’s faces), whereas other stimuli were nonsocial (i.e., inanimate objects). The percentage of time children spent looking at the social versus nonsocial stimuli was recorded (ranging from 0 to 100). The results are presented below: