MAT 119 Terms
1/64
There's no tags or description
Looks like no tags are added yet.
Name | Mastery | Learn | Test | Matching | Spaced | Call with Kai |
|---|
No analytics yet
Send a link to your students to track their progress
65 Terms
Rational numbers
Can be broken down; ratio of two integers expressed as fraction
Prime number
Numbers whose factors are 1 and itself
Composite number
Opposite of prime numbers; have other numbers as factors.
Is 1 a prime number?
No, because it only has itself as a factor
Getting the LCDs of prime numbers
Multiply them together
Statistics
The science of collecting, organizing, analyzing, summarizing, and presenting numerical information in order to draaw inference.
Population
Aggregate / collection / whole of all subjects a researcher wants to study
Sample
Representative of a whole
Observational study
The subject is observed in their natural habitat
You don’t do anything to alter factors, you merely observe and record.
Experimental design / study
A treatment is done onto the subject
There are difference in variables / factors
Statistic
A numerical characteristic of a sample
E.g.: sample average
X-bar (x̄)
A statistical symbol for the sample mean (average) of a set of data.
It represents the sum of all values divided by the number of observations.
It is widely used in analytics to represent the average rather than the total population
Parameter
A numerical characteristic of a population
Mu (μ)
Represents the population mean or expected value, serving as a parameter to describe the average of an entire dataset, rather than just a sample
Qualitative data
Data that cannot be counted or measured
It is usually descriptive
Quantitative data
Data that can be counted or basic arithmetic can be performed on it
Convenience sample
Sample taken without scientific method
The closest, most affordable, or readily available sample is taken
Systematic sample
The nth individual is selected until the desired number of individuals are taken
E.g.: 3rd of every sample only
N vs. n
N = population
n = sample
Stratified sample
The population is divided into groups or subgroups called strata.
Individuals are selected from each group to make up a sample.
Cluster sample
The groups naturally exist and the researcher selects a desired number from each group called clusters.
Simple random sample
individuals are randomly selected from the population (frame) to attain the desired sample size.
In this method, every individual has an equal chance to be selected.
Variable
Factors
Frequency
The count or number
The count of how often a specific value, event, or data point occurs in a dataset
Category or class
The rows in a table
Individual
The subject of the study
“p” sign
Population proportion
MEAN or Sampling distribution of Sample Proportions
It is always equals to the population proportion
^p = sample proportion from a random sample,
It represents the proportion of a specific characteristic in a sample,
It is the percentage in the problem converted to a decimal.
Empirical Rule
(95% ≈ mean ± 2 standard deviations)
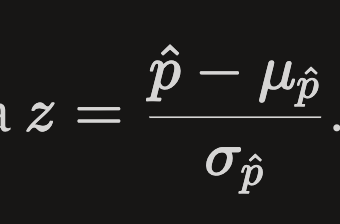
Z-Score Formula
Sample proportion - mean / standard deviation
Z-Score Rule
A common rule of thumb is that z-scores beyond about ±2 are considered unusual, because only about 5% of observations in a normal distribution fall outside that range.
Classic probability formula
P(event) = total number of possible outcomes / number of favorable outcomes
Relative Frequency
Relative frequency = Count or category / total
When asked to do a relative frequency table, place it beside the variable and frquency columns
The total should add up to 1 (can be a little more or less)
Creating a Pie Chart
Circle = 360 degrees
Multiple the relative frequency by 360
Histogram vs. Bar Chart
Histograms overlap with each other, bar charts do not.
Measure of Central Tendency
Mean, median, mode
Five Number Summary
Minimum
First Quartile (Q1)
Second Quartile (Q2)
Third Quartile (Q3)
Maximum
Mode
The most frequent value that appears in the data set
There can be no mode or multiple modes in a data set
Median
The middle value of the data set when arranged in ascending order
To find the rank of the median, use the formula: n+1 / 2
If the mean & median are not the same, go with the median
Mean
The arithmetic average of the data set
Unless stated, always assume that you’re computing for a sample (not population)
Mean = sum of data set / total number
Minimum
Lowest number from data set
First Quartile (Q1)
0.25(n + 1) tells you the rank of the number in Q1
Second Quartile (Q2)
0.50(n + 1) tells you the rank of the number in Q1
Also known as the median
Third Quartile (Q3)
0.75(n + 1) tells you the rank of the number in Q1
Maximum
The greatest number in the data set when arranged in ascending order
Box Plot
Also known as box and whiskers plot because of how it is constructed
Range of a Dataset
Max - min
Measures the spread of the dataset
Finding Outliers via the Five Number Summary
Outliers are numbers that are at or below the lower fence or at and above the upper fence.
Interquartile Range = Q3 - Q1
Lower Fence = Q1 - (1.5)(IQR)
Upper Fence = Q3 + (1.5)(IQR)
Shift of Distribution of the Dataset
Skewed to the right → use the median
Symmetric / bell shaped / normall distributed
Skewed to the left → use the median
Sample Standard Deviation
Square root of sample variance; OR
Square root of (sum of individual data)
Measure of a typical distance from each of the data points to the mean
Using Standard Deviation to Find Outliers
A data point or value below x̄ ± s2
Example:
IQ Test: If an IQ test has a mean of 100 and a standard deviation (s) of 15, then 2s
is 30 (2 × 15). Therefore, 95% of the population has an IQ between 70 (100 -30) and 130 (100 + 30).
Simple Linear Regression Formula
Prediction (y) = (slope x future time) + starting line
Every straight line on a graph follows a simple rule:
y = mx + b
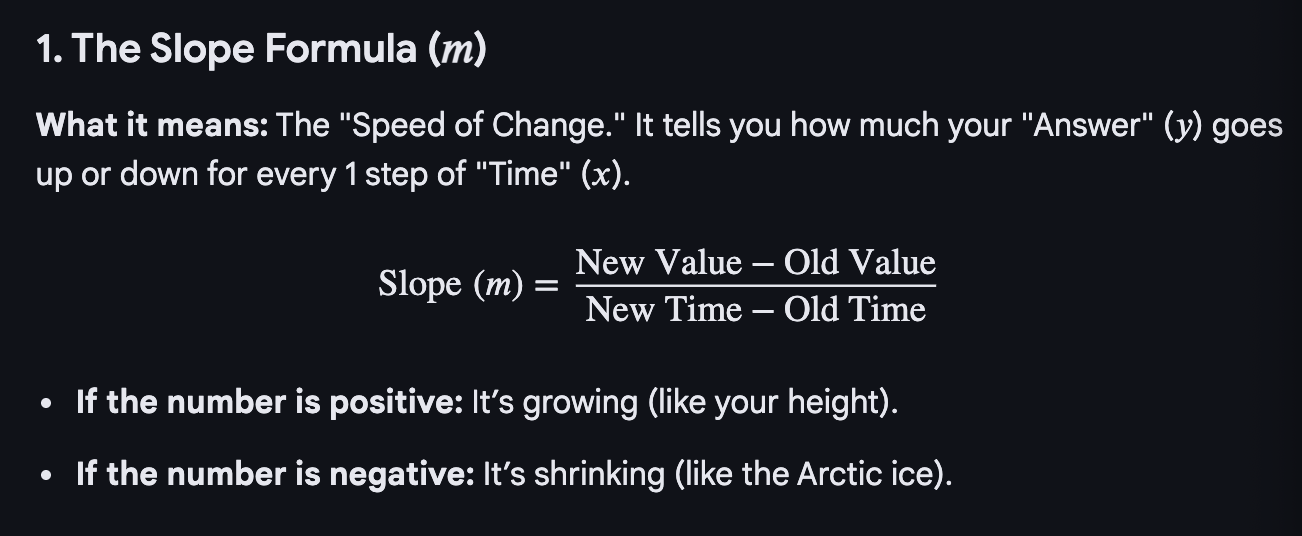
Finding the Slope
(new value- old value) / (new time- old time)
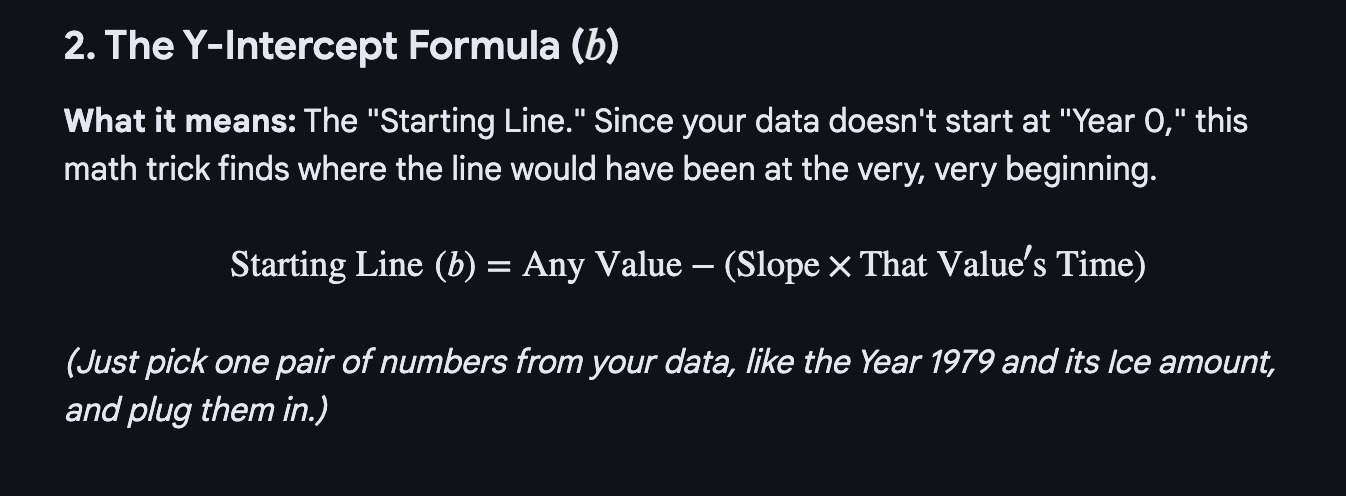
Finding the y-intercept
any value - (slope x the value’s time)
Sample Variance
s² = Σ(xi - x̄)² / (n - 1)
(individual data - sample mean)² divided by (sample - 1)
Range
Midrange
When To Choose IQR Over Standard Deviation
When there is a significant number that can skew the data set significantly, since SD relies on the mean while IQR uses percentiles (which includes median or Q2).
Measures of Spread
IQR
Standard Deviation
Explanatory Variable
Explanatory variables cause or influence changes
Manipulated or observed to explain changes in the outcome
Response Variable
The variable that is measured to assess the effect of the explanatory variable in a study. It is often the outcome of interest in an experiment. It reflects the changes that occur as a result of variations in the explanatory variable.
Variables of Interest
Tthe specific factors, characteristics, or attributes a researcher measures or manipulates to answer a research questioni n a study. They include both the explanatory and response variables.
(Algebra) Term
An individual part of an algebraic expression
Separated by addition (+) or subtraction (–) signs, and can consist of numbers, variables (letters), or the product of numbers and one or more variables
Coefficient
What the number is called when it is being multiplied by a variable (letter)
Mathematical model
Often formulas that describe relationships between variables in the real world