core practical 4: investigate teh effect of temperature,pH, enzyme concentration and substrate concentration on the initial rate of enzyme catalysed reactons
1/19
There's no tags or description
Looks like no tags are added yet.
Name | Mastery | Learn | Test | Matching | Spaced |
|---|
No study sessions yet.
20 Terms
Name the 4 factors that affect the initial rate of enzyme-catalysed reactions
1. Temperature
2. pH
3. Enzyme concentration
4. Substrate concentration
enzymes at low temp
Lower temperatures either prevent reactions from proceeding or slow them down:
Molecules move relatively slow
Lower frequency of successful collisions between substrate molecules and active site of enzyme
Less frequent enzyme-substrate complex formation
Substrate and enzyme collide with less energy, making it less likely for bonds to be formed or broken (stopping the reaction from occurring)
enzymes at hgiehr temp
Molecules move more quickly
Higher frequency successful collisions between substrate molecules and active site of enzyme
More frequent enzyme-substrate complex formation
Substrate and enzyme collide with more energy, making it more likely for bonds to be formed or broken (allowing the reaction to occur)
what does it man when an enzyme denatures
Bonds (eg. hydrogen bonds and ionic bonds) holding the enzyme molecule in its precise shape start to break
This causes the tertiary structure of the protein (ie. the enzyme) to change
This permanently damages the active site, preventing the substrate from binding
Denaturation has occurred if the substrate can no longer bind
enzymes at extremes of pH
Hydrogen and ionic bonds hold the tertiary structure of the protein (ie. the enzyme) together
Below and above the optimum pH of an enzyme, solutions with an excess of H+ ions (acidic solutions) and OH- ions (alkaline solutions) can cause these bonds to break
This alters the shape of the active site, which means enzyme-substrate complexes form less easily
Eventually, enzyme-substrate complexes can no longer form at all
At this point, complete denaturation of the enzyme has occurred
effect on enzyme concentrationon rate of reactio
Enzyme concentration affects the rate of reaction
The higher the enzyme concentration in a reaction mixture, the greater the number of active sites available and the greater the likelihood of enzyme-substrate complex formation
As long as there is sufficient substrate available, the initial rate of reaction increases linearly with enzyme concentration
If the amount of substrate is limited, at a certain point any further increase in enzyme concentration will not increase the reaction rate as the amount of substrate becomes a limiting factor
effect of susbtrate concentration on rate of reaction
The higher the substrate concentration the faster the rate of reaction
More substrate molecules means more collision between enzyme and substrate so the more likely an active site will be used by a substrate
The is only the case up until a certain concentration of substrate, at which point a saturation point is said to have been reached
At this point all active sites are occupied and increasing the substrate concentration will not affect the rate of the reaction
Substrate concentration will decrease over time (if no new substrate is added)
The rate of reaction will therefore decrease over time
This means the initial rate of reaction will be fastest throughout the reaction
describe how a suitable pH could be decided on experimentally
carry out the experiment described at constant temp/substrate/enzyme concentration
at a range of pHs controlled by buffer
choose the pH which gives a time which is not too short/too long for practicality
Name the enzyme used in investigating the effects of different factors on rate of enzyme-catalysed reaction
trypsin which breaks down milk protein (casin). The opaque white colour of milk is replaced by a clear solution.
How can colorimeter can be used to measure the absorbance of the solution?
More light passes through the transparent and lighter solutions, so a colorimeter can be used to measure the absorbance of the solution which in turn indicates the rate of reaction of the experiment.
what is buffer slution
Buffer solutions each have a specific pH
Buffer solutions maintain this specific pH, even if the reaction taking place would otherwise cause the pH of the reaction mixture to change
A measured volume of the buffer solution is added to the reaction mixture
This same volume (of each buffer solution being used) should be added for each pH value that is being investigated
The progress of enzyme-catalysed reactions can be investigated by:
Measuring the rate of formation of a product
Measuring the rate of disappearance of a substrate
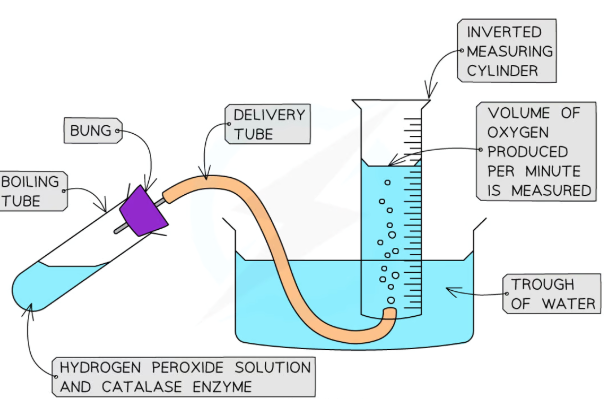
Effect of enzyme concentration on the rate of reaction method
Add a set volume of hydrogen peroxide solution to a boiling tube
Add a set volume of buffer solution to the same boiling tube
Invert a full measuring cylinder into a trough of water
Place the end of the delivery tube into the open end of the measuring cylinder and attach the other end to a bung
Add a set volume of one concentration of catalase to the boiling tube and quickly place the bung into the boiling tube
Record the volume of oxygen collected in the measuring cylinder by the water displaced every 10 seconds for 60 seconds
Repeat the experiment twice more and calculate the average volume of oxygen produced at each 10 second interval
Repeat the whole experiment for the different concentrations of catalase
Plot the average volume of gas produced against time for each concentration
Compare the initial rate of reaction of each of the concentrations
Explain how optimum temperature can be determined
find the rate of production of glucose / find the {concentration / eq} of glucose after set time at a (suitable) range of temperatures
The colorimeter will measure how the absorbance of the starch solution change over a period of time once amylase is added to it
idea that optimum temperature is the temperature at which the reaction is quickest
e.g add a known volume of a known concentration of enzyme to the cellulose / add a known mass of cellulose (to a known volume of water)idea of equilibration to the appropriate temperature / idea of sugar test / use of Benedict's / keeping pH constant
This can be repeated for a range of different starch concentrations/temps/pH and a graph of absorbance against time can be plotted
repeat at narrow range using more concentrations/temp around where optimum thought to be from graph
results of effect of concentration experiment
As the concentration of catalase increases the volume of oxygen produced would increase
This is because there would be more available active sites for hydrogen peroxide to use
The volume of oxygen would plateau out after the initial rate of reaction due to the substrate decreasing, having been converted into the product (oxygen)
Ideally, you would repeat the procedure for each factor several times. Explain why it is important to measure the initial rate of reaction rather than an average rate over a longer period of time.
substrate not limiting
As the reaction continues, substrate is used up and product accumulates, which can slow the reaction or inhibit the enzyme. Measuring the average rate over a longer period would therefore not accurately reflect the enzyme's true activity. The initial rate provides a more reliable and consistent comparison between different conditions, as it is measured before any significant changes in substrate or enzyme activity occur.
describe how to keep sucrose concentration same for all solutions
dissolve a stated mass of sucrose in stated volume of water/ use a stock solution of sucrose
use the same volume of this solution for each pH
how initial rate of reaction determined for rate at which sucrose used up
the rate slows down as {sucrose is used up / sucrose becomes limiting} (1)
so (rates / results} cannot be validly compared (1)
how to measure initial rate of reaction for sucrose beign used up
measure the mass of {sucrose broken down / products formed} at intervals over time (1)
plot a graph of mass (y) against time (x) (1)
find the gradient of the graph at its start (1)
desribe procedure to compare percentage germination of pollen collected
• credit suitable methods used (to observe germination of pollen grains) (1) eg agar plates, filter paper
• sucrose solution added (1)
• suitable time quoted before germination rate assessed (1) > or = 15 minutes < or = 5 days
• control of one relevant abiotic variable (1)
• control of one relevant biotic variable (1)
• view through microscope / count germinated & non-germinated / count germinated & total (and work out percent)
(1) • reference to relevant health and safety issue (1) eg pollen allergy and bee sting