week 13 - ANOVA
1/7
There's no tags or description
Looks like no tags are added yet.
Name | Mastery | Learn | Test | Matching | Spaced | Call with Kai |
|---|
No analytics yet
Send a link to your students to track their progress
8 Terms
ANOVA
analysis of variances
I = number of group
J = observation number in WITHIN group (2nd number in the subscript)
PART 1
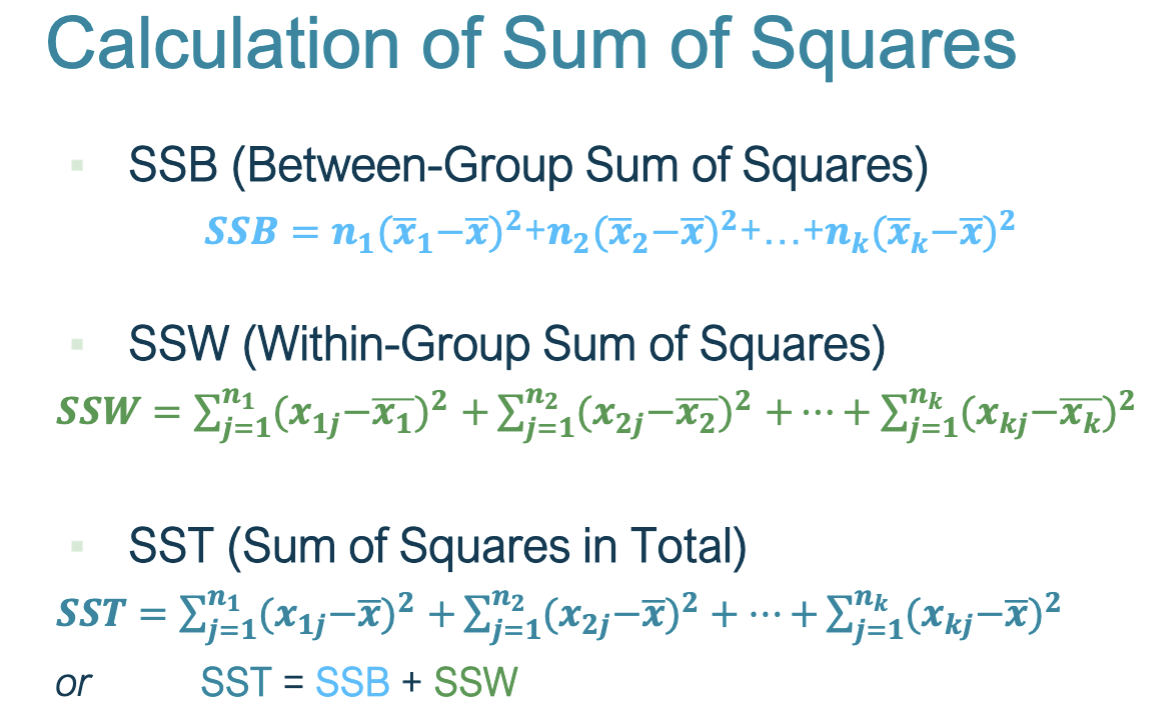
sources of VARIATION (VARIATION in and out of the groups)
sum of squares BETWEEN (ssb)
sums of squares WITHIN (ssw)
each observation is taken into account
=
→ sums of squares TOTAL (SST)
ssb + ssw = sst
with the use of grand mean
PART 2
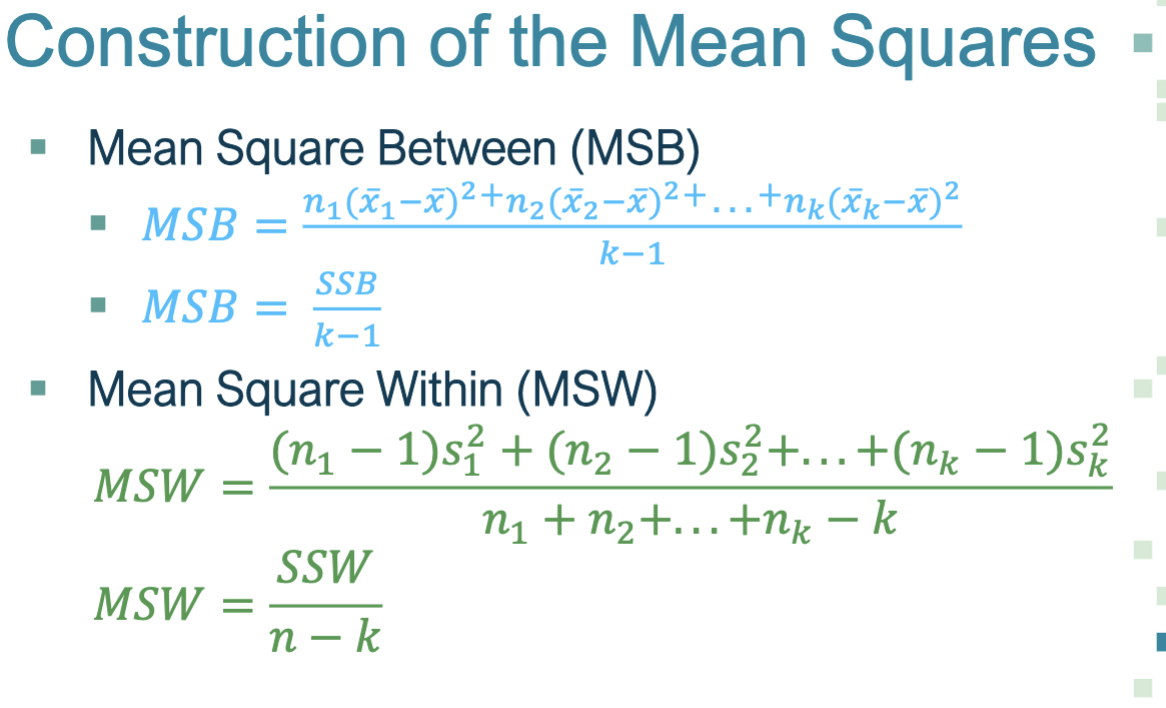
sum of squares is used for the mean of squares
SSB and/or SSW
mean square for both = MSB and MSW
PART 3
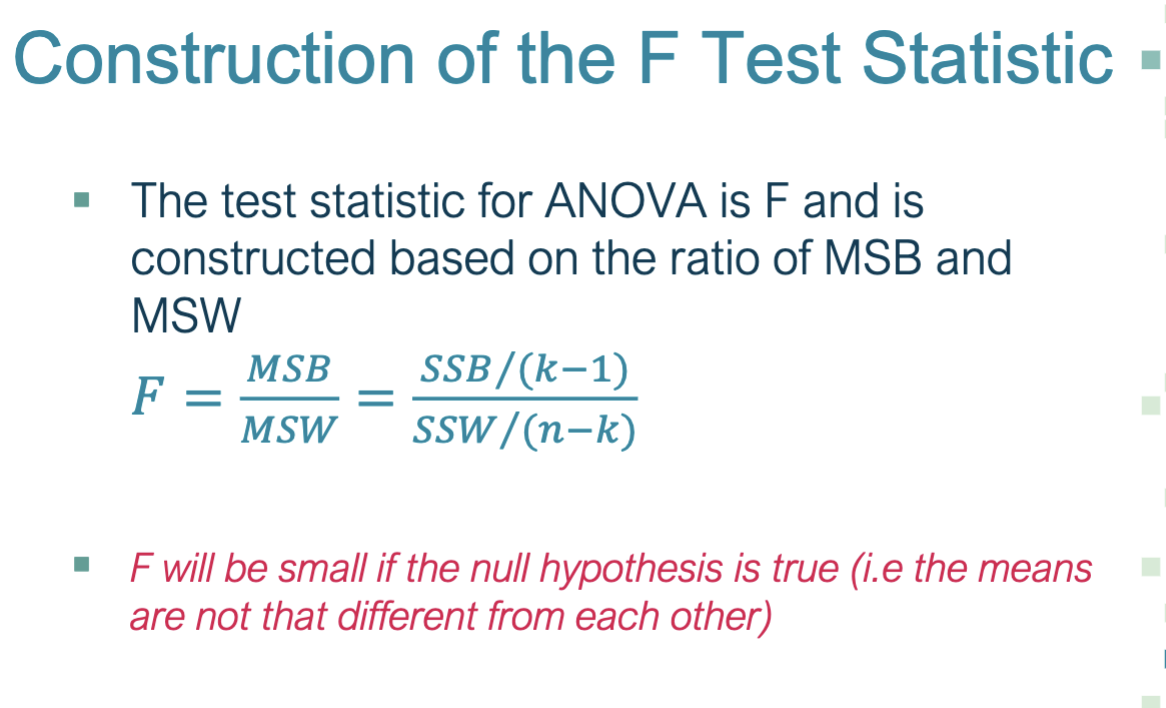
sum of squares and mean squares → F test statistic
F DISTRIBUTION
one way ANOVA table
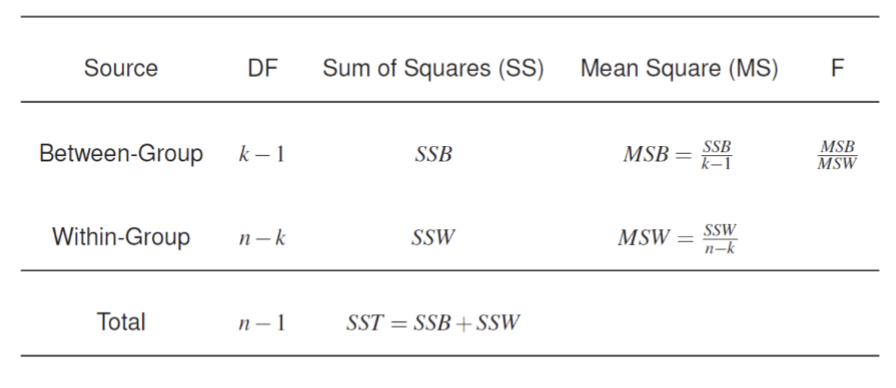
ANOVA table example
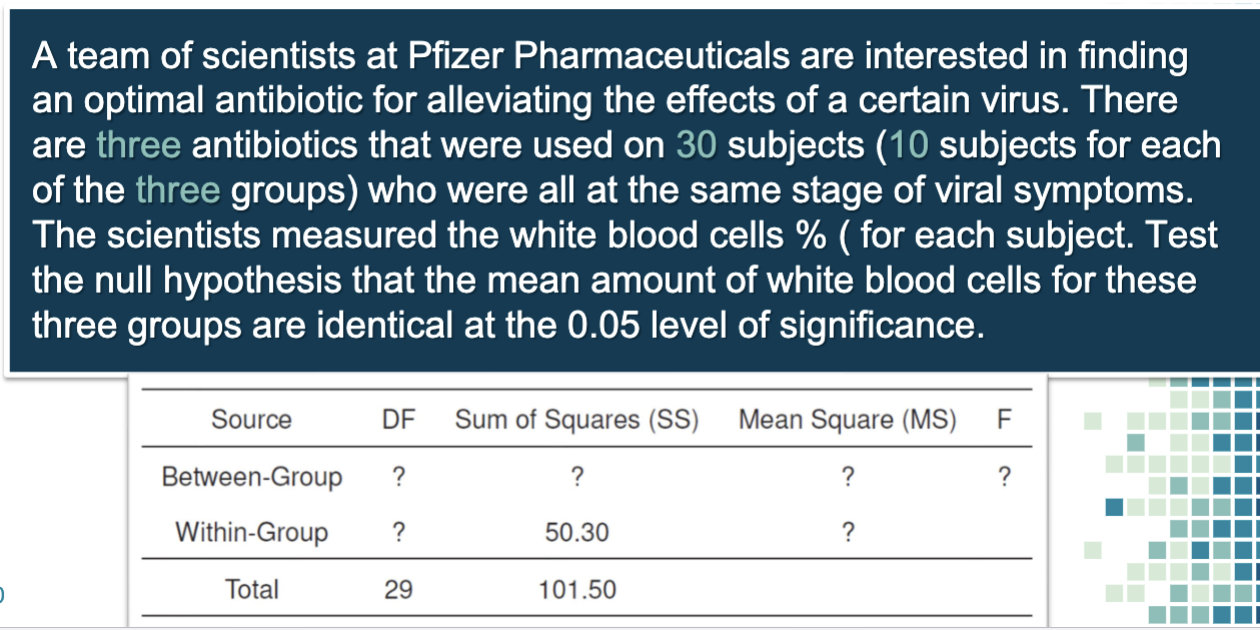
null hypothesis: mean viral load is the same for all three groups
alternative hypothesis: there is at least one inequality among the means null. At least one of the group mean viral loads is different
find the between and within groups:
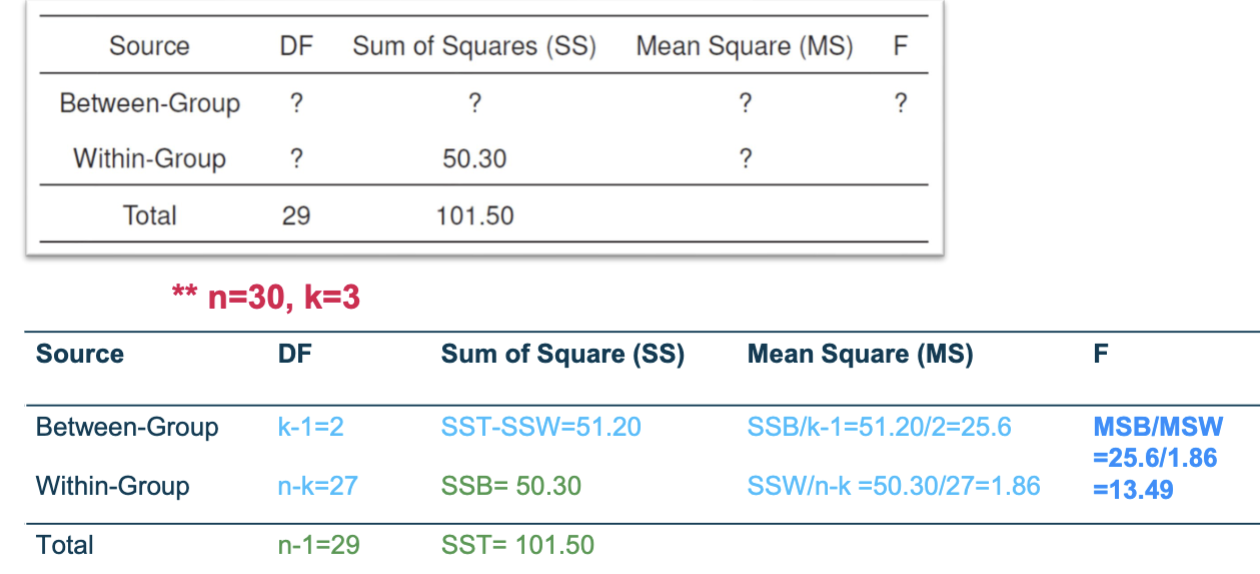
calculate the t statistic:
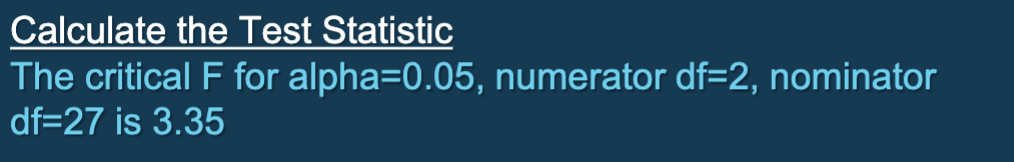
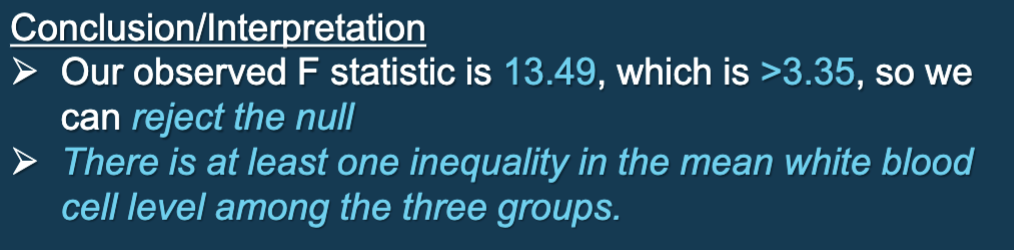
conclusion/interpretation: