Microeconomics - uncertainty
1/30
There's no tags or description
Looks like no tags are added yet.
Name | Mastery | Learn | Test | Matching | Spaced | Call with Kai |
|---|
No analytics yet
Send a link to your students to track their progress
31 Terms
Main concepts under uncertainty
Expected value formula
Expected utility
Certainty equivalent
Risk premimum
These are the main concepts you must be able to have FULL understand for to apply everywhere
Possible monetary outcome(yi)
Probabiliy of each outcome(pi)
Possible monetary outcome(yi)= monetary= related to money, means the differen money amouts that might happen where i can be anything from 1,2.., n
Probability of each outcome(pi) = tells you how likely each outcome is, where all probability must add up to 1, because something has to happen
Why does uncertainty come in
Many economic decisions involve uncertainty: outcomes are not known with certainty when choice is made.Example: a job offer may involve an uncertain future income, or an investment may have a risky return
Expected value
Is a way to summarize a risky situation by calculating the average outcome — if that situation were repeated many times.

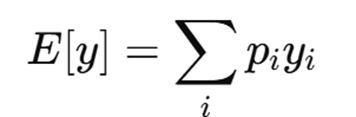
Explain this formula
For each possible outcome, yi
Multiply it by its probability, pi
Then add up all of those results.
Expected utility
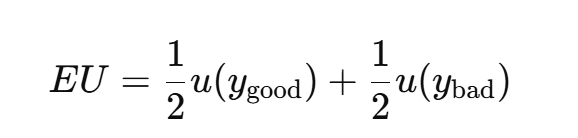
Under uncertainty, individual evaluate lotteries according to the expected utility of outcomes:
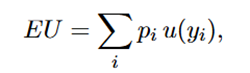
u(y): utility function representing preferences over wealth or income
Differance between expected value and expected utility
Expected Value (EV)
• EV is the average money outcome of a risky choice.
• Formula: EV = Σ pᵢ · yᵢ
→ Multiply each outcome yᵢ by its probability pᵢ, then add them up.
→ Focuses only on money, not feelings.
Expected Utility (EU)
• EU is the average satisfaction (utility) you get from a risky choice.
• Formula: EU = Σ pᵢ · u(yᵢ)
→ Multiply each outcome’s utility by its probability, then add.
→ Focuses on utility (happiness), not money.
Risk aversion
A person is risk-averse if they prefer the utility of a sure income over the expected utility of a risky income.
Condtion:u(E[y])>E[u(y)]
Basically they prefer a sure payment of 500 dollar than $1,000 with a probability 25 percent and $100 with a probability 75 percent, even if the average is both in same situations
What does this condition mean u(E[y])>E[u(y)]
First calculate the expected value of the risky option.
– Example: A lottery paying 4 million (50%) or 0 (50%)
– EV = 0.5·4 + 0.5·0 = 2 millionCompare:
– Utility of the sure amount → u(2)
– Expected utility of the lottery → 0.5·u(4) + 0.5·u(0)
A risk-averse person prefers:
u(2) over 0.5u(4)+0.5u(0)
Meaning:
They get more satisfaction from a guaranteed 2 million than from a 50/50 gamble between 4 million and 0 — even though both have the same expected value.
How does this explain a risk aversion person and there concave utility function
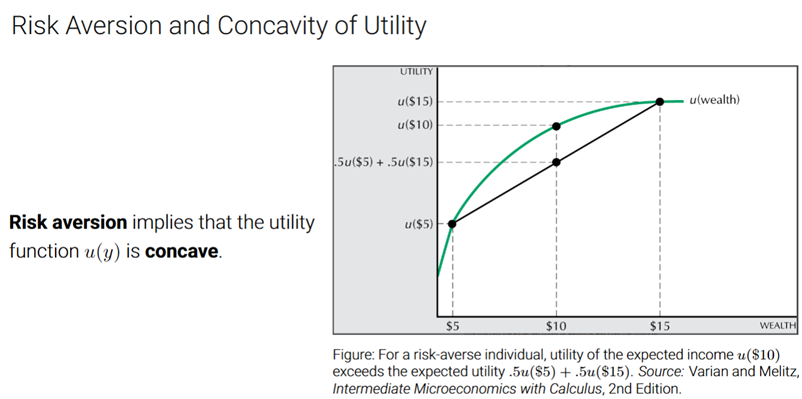
Risk aversion means the utility function u(y) is concave.
→ Each extra dollar gives less additional happiness than the previous one (diminishing marginal utility).
The graph shows:
The green curve = utility function (concave) of getting the expectd income with certainty.
The black curve = shows the risky gamble between two possible outcomes:
50% chance of $5
50% chance of $15
Expected income:E[y] = 0.5(5) + 0.5(15) = 10
Look at $10 on the x-axis.
The green dot = utility of getting $10 for sure
The black dot = utility you expect from the risky gamble
Risk aversion condition: u(10)>0.5u(5)+0.5u(15)
.A risk-averse person prefers $10 for sure over a 50/50 gamble between $5 and $15 — even though both have the same expected value.
This happens because the utility curve is concave. Meaning they prefer the green line ALWAYS. Since the straight line = expected utility of the risiky lottery. Which is the average of the two utility points. For a risky person this point is below the green curve. Since the green curve is higher than the straight line, they prefer the green curve.
Certainty equivalent(CE)
The guaranteed amount of money that gives the same utility as a risky choice. Formula: u(CE)=E[u(y)]. Defines the guaranteed amount of money (CE) that gives the same utility as the risky option. Differs from Risk aversion condition that says you prefer the utility of the expected value over the expected utility of a risky
Risk premimum
The amount of money someone is willing to give up avoiding risky situations and get a guaranteed(certain) outcome instead
o Formula: RP=E[y]−CE-
E[y]= Expected value of the risky option
CE= Certainty equivalent (what the person thinks gambling is worth)
It is bascially the extra value the risiky choice offer, but the person is to uncomfortable with risk, so they settle for less
What are the two assumed outcomes in the simplified uncertainty model?
A good state and a bad state, each occurring with 50% probability.
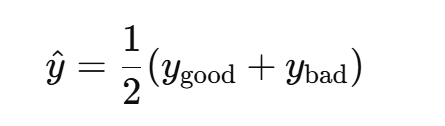
What is the expected income y^ in the two-state model?
The average of the good and bad outcomes.
What is Δ?
Measures the risk. Shows the difference between good and bad outcomes. Higher differance→ more risk
Why is (ŷ, Δ) enough to describe risk?
ŷ tells us the average outcome
Δ tells us how risky it is (how far good and bad outcomes are from the average)
And since:
only two outcomes
with 50/50 probability
and symmetric around the average → the goods outcome is the same distance above the average as the bad outcome is below it.
→ We don’t need anything else.
These two numbers fully describe the risky situation.
What is expected utility before simplification
Why do we use reduced-form utility u(y^,Δ)
It simplifies expected utility when probabilities are 50/50 and outcomes are symmetric.
Utility becomes a function of:
expected income y^
risk Δ
Under what conditions can we reduce to u(y^,Δ)
Two outcomes
Equal probability
Symmetric around mean
Known concave utility function
Risk is representated by Δ
What affects utility in the (ŷ, Δ) model?
uy^>0 → higher expected income makes people happier
uΔ<0→ more risk makes people less happy
So:
People want high average returns (ŷ ↑) but dislike big ups-and-downs (Δ ↑).
This simplified model is just a shorter way of expressing the same idea as a full concave expected-utility function
Formula for reduced form of utility

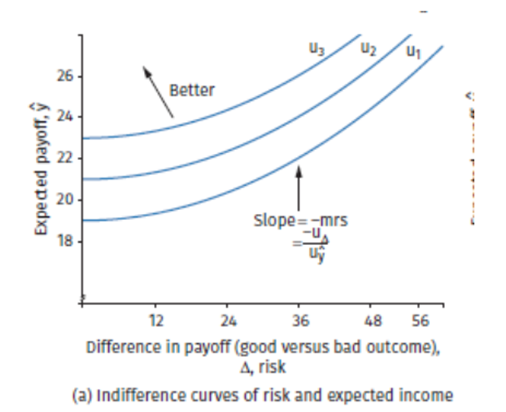
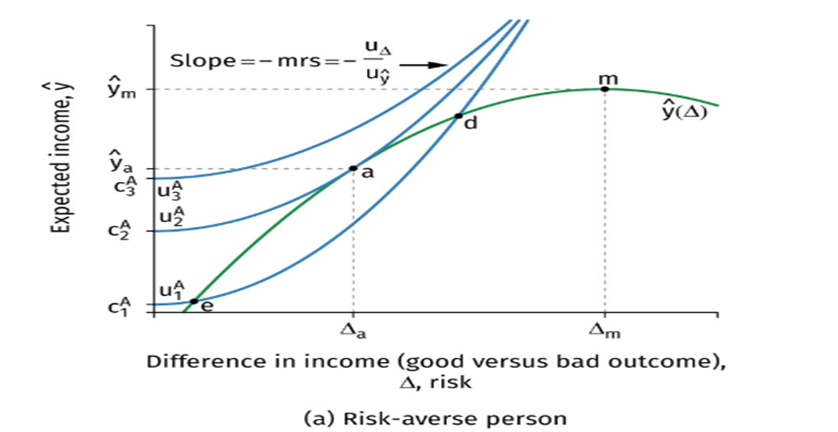
What does the indifferance curve under context of risk and expected income show
To understand how people make risiky choice we descrive their evalutions of different outcomes using utility function in which:
Expected income is a good: something the decision maker prefers and wants more of.
Risk is not a good: something the decision maker would like to avoid or is possibly indifferent to, but does not prefer
An indifference curve shows all combinations of risk (Δ) and expected income (ŷ) that give the same utility, so the person is equally happy at every point on the curve.
Slope - downward sloping
More risk (Δ ↑) makes you worse off
To keep utility the same, you must get more income (ŷ ↑)
So the curve slopes upward:
more risk → more income needed to compensate.
Formula: Slope=−MRS=uΔ/ uŷ
vΔ<0: increasing risk reduces utility(bad)
vy^>0 increasing income increases utility(good)
So:
−(−/+)=+ slope is positive - upward sloping
Curves higher up represent more overall utility - you are better off, lower curves represent less utility
Remeber!
Utility curve concave dimishing marginal utilitity is upward sloping but flattening,
In this graph we have different x-axis and y-axis, therefor different curves but both are upward sloping. Utility is just concave upward sloping and indiffferance curve upward slopiung
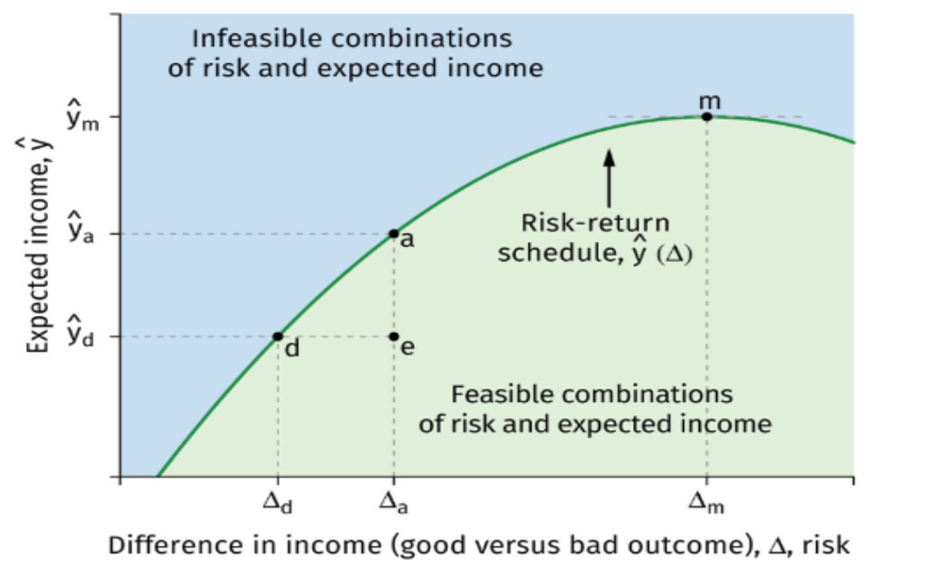
What is the risk-return schedule?
Shows how expected income changes when risk changes. Formula:
Think of it as:
“If I choose more risk (Δ), what expected income (ŷ) can I get?”
Differance between risk-return schudle and dimishing marginal utility curve
Diminshing marginal utility - how a person feel about wealth, thehuman psychology aspect of it. Concave utility curve
Risk-retun schedule - tradeoff between risk and income. Concave utility - similar in shape not meaning
Slope of risk-return schedule
MRT bascially
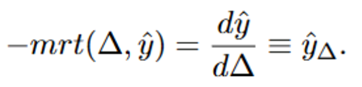
It tells you:
“If I change risk a tiny bit, how much does expected income change?”
What does a risk-averse person choose?
They use indifference curves, which slope upward because:
More risk makes them worse off
So they need more income to stay equally happy
The best choice is where an indifference curve is tangent to the frontier. This is point a in the graph, where MRS=MRT →

For a risk-averse person explain this pointers:
Risk-return schedule
MRT
Indifference curves
Optimal choice
Risk-return schudule: Shows the highest expected income possible for each level of risk.
MRT: Shows how expected income changes when risk changes.
Indifference curve: Show combinations of risk and income that give the same utility.
Optimal choice: tancency point where MRS=MRT
Is expected wealth the same as expected value
Yes expected value and expected wealth mean the same thing
What is a risk neutral person
A person that does not care about risk, they only care about expected return. They only want to maximize expected return and completely ignore risk.
Why CE < Expected return for a risk-averse person
Because of the concave utility: a risky outcome gives less utility than a sure outcome with the same mean. So the person is willing to accept a lower guanteed amount(CE)