AP STATS Chapters 1-3
1/70
There's no tags or description
Looks like no tags are added yet.
Name | Mastery | Learn | Test | Matching | Spaced |
|---|
No study sessions yet.
71 Terms
stem & leaf plot
a graph of a distribution of quantitative data in which all but the final digits of data values (written in numerical order) form a column called a stem and the final digit of each data value is written in increasing order outward from the column to form leaves
back-to-back stem & leaf plot
a stem-and-leaf plot or stemplot that is used to compare distributions of quantitative variables for two data sets
dot plot
a graph of a distribution of quantitative data in which each data value is shown as a dot above its location on a number line
histogram
a graph of a distribution of quantitative data in which nearby values are grouped together in what are often called "bins" or "classes"
sample mean
the average of a subset of the population, denoted by x-bar: x̄
population mean
the average of a population, denoted by the Greek letter mu: μ
resistant
a statistic that is not influenced (or influenced very little) by extreme observations
unimodal
describes the shape of a distribution whose graph has one major peak
bimodal
describes the shape of a distribution whose graph has two major peaks
symmetric
describes the shape of a distribution whose graph has roughly mirror images on the left and right sides
skewed
describes the shape of a distribution whose graph has one side that is much longer than the other (name the direction of this based upon where the longer end/tail is located)
quartiles
One quarter of the data values are smaller than the first quartile (Q1) and three quarters of the data values are smaller than the third quartile (Q3)
interquartile range (IQR)
The range for the middle 50% of the data values-- the range between the quartiles (Q3-Q1)
1.5 IQR Rule
used for identifying outliers: any values that are more than 1.5 times the IQR lower than the first quartile or higher than the third quartile are called outliers
Q1 - (1.5 x IQR)
Q3 + (1.5 x IQR)
5 number summary
for a given data set: the minimum value, the first quartile, the median, the third quartile, and the maximum value (identified in this particular order)
standard deviation
measures the typical distance of values in a distribution from the mean, usually denoted s for a sample or lower case Greek sigma, σ, for a population
variance
the square of the standard deviation (σ^2)
categorical variable
places individuals into one of several categories
quantitative variable
takes numerical values for which it makes sense to find an average
distribution
tells all the possible values of a variable and how often they each occur
two-way table
array that displays counts of two categorical variables with columns indicating the distribution for one variable and rows indicating the distribution for the other variable
marginal distribution
in a two-way table, this counts the distribution of values of one of the categorical variables among all individuals described by the table
conditional distribution
in a two-way table, this describes the values of a variable among individuals who have a specific value of another variable (there's a separate conditional distribution for each value of the other variable)
association
two variables have this quality if knowing the value of one variable helps predict the value of the other
center
a typical value-- could be the median or the mean
spread
how much a data set varies-- could be the range, the IQR, or the standard deviation
shape
a description of the symmetry or asymmetry and the number of modes/peaks
outlier
any data value that is unusually low or unusually high
segmented bar chart
a bar graph that is used to compare distributions of a categorical variable for two or more data sets (each bar is divided in proportion to the distribution of the categorical variable)
bar graph
a graph of a distribution of categorical data in which bars extend to display the frequency of various categories that are placed on an axis
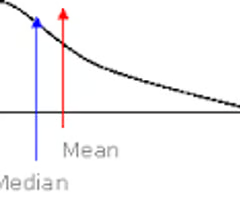
median
a graph of a distribution of categorical data in which bars extend to display the frequency of various categories that are placed on an axis
range
the distance (a single number) between the minimum and maximum values in a data set (max - min)
boxplot
a graph of a distribution of quantitative data in which a central box extends between the quartiles with a central line marking the the median, lines extend to the largest and smallest values that are not outliers, while outliers are marked with individual points/dots
pth percentile
the value with p percent of the observations less than it
cumulative relative frequency graph
for quantitative data, displays the cumulative relative frequency of each class of a frequency distribution
z-score
tells us how many standard deviations from the mean an observation falls, and in what direction

Effect of Adding (or Subtracting) a Constant c
adds c to (or subtracts c from) measures of center and location (mean, median, quartiles, percentiles)
does not change the shape of the distribution or measures of spread (range, IQR, standard deviation).
Effect of Multiplying (or Dividing) by a Constant b
multiplies (or divides) measures of center and location (mean, median, quartiles, percentiles) by b
multiplies (or divides) measures of spread (range, IQR, standard deviation) by |b|, but does not change the shape of the distribution
density curve
describes the overall pattern of a distribution
is always on or above the horizontal axis, and
has area exactly 1 underneath it
median of a density curve
the equal-areas point, the point that divides the area under the curve in half
mean of a density curve
the balance point, at which the curve would balance if made of solid material
normal distributions
The mean of a Normal distribution is the center of the symmetric Normal curve.
The standard deviation is the distance from the center to the inflection points (steepest locations) on either side.
We abbreviate the Normal distribution with mean µ and standard deviation σ as N(µ,σ).
68-95-99.7 Rule (also called the Empirical Rule)
In the Normal distribution with mean µ and standard deviation σ:
Approximately 68% of the observations fall within σ of µ.
Approximately 95% of the observations fall within 2σ of µ.
Approximately 99.7% of the observations fall within 3σ of µ.
standard Normal distribution
the Normal distribution with mean 0 and standard deviation 1
We abbreviate this as N(0,1).
Normal probability plot
provides a good assessment of whether a data set follows an approximately Normal distribution
If the points lie close to a straight line, the plot indicates that the data are close to Normal.
x-axis: data, y-axis: expected z-scores
uniform distribution
A symmetric distribution closely resembling a rectangle; each value of the quantitative variable occurs with roughly the same frequency
InvNorm
Input: area or probability (to the LEFT)
Output: z-score or variable value
normalcdf
Input: Z-score or variable value
Output: area or probability
Explanatory variable
Independent variable that may help explain or predict changes in a response variable (usually X)
response variable
Dependent variable that measures an outcome of a study (usually Y)
Scatterplot
Graph that shows relationships between 2 quantitative variables measured on the same individuals with each individual represented by an ordered pair
Interpreting scatterplots
DOTS- Direction, Outliers/High-Leverage Points (if any), Trend, and Strength
Strength
weak/moderate/strong
Trend
linear/nonlinear
direction
positive/negative
Correlation doesn't change
x and y are switched or we change units
Correlation (r) is not resistant
Correlation is strongly affected by outliers and high-leverage points, so we say that...
Correlation (r)
Strength and direction of linear relationship (close to 1 or -1 indicates a STRONG linear relationship)
Least Squares Regression Line (LSRL)
The linear equation that describes the relationship between x and y
Extrapolation
Trying to use a regression equation to predict y for values of x that are larger or smaller than those in the original data set (AVOID!)
Residual
observed - predicted
(y - ŷ)
(x̅ , y̅)
This point is always on LSRL
Moving one standard deviation from the x̅ moves...
r standard deviations from the y̅
The linear model is a good fit
The residual plot has no apparent pattern and appears scattered randomly, so we know...
Coefficient of determination
(r^2)
The percent (or proportion) of variation in the y variable that is explained by the linear relationship between the x and y variables.
interpreting slope of a least squares regression line
For each 1 (unit) increase in (x), we predict a (b) (unit) increase/decrease in (y).
interpreting the y-intercept of a least squares regression line
For a (x) of 0 (unit), we predict a (y) of (a) (unit).
residual plot
a graph with the explanatory variable on the horizontal axis and residuals on the vertical axis
standard deviation of residuals, s
the typical error when making predictions with the LSRL
outlier
point with large residual
high-leverage point
a data point with a much larger or smaller x-value than the rest of the data set