Biology Midterm Review: Natural Selection, Biomolecules, Diffusion, Enzymes
1/72
There's no tags or description
Looks like no tags are added yet.
Name | Mastery | Learn | Test | Matching | Spaced |
|---|
No study sessions yet.
73 Terms
Natural Selection
Natural selection is the primary mechanism of evolution, leading to changes in the heritable traits of a population over successive generations.
Allele Frequency
Natural selection does not change individuals; it shifts the allele frequency of the entire population.
Selective Pressure
The environment is the selective pressure that drives natural selection.
Favorable Traits
The environment dictates which traits are favorable or detrimental at any given time.
Example of Favorable Trait
In a cold environment, thick fur is a favorable trait for survival, while in a warm environment, it might be detrimental.
Gene Pool
Organisms with unfavorable traits are less likely to reproduce, and their traits are gradually removed from the gene pool.
Variation Filtering
The environment doesn't create the variation; it filters it.
Population Trait Fate
If large, brightly colored beans are the easiest for a predator to see (unfavorable trait) and small, brown beans are the hardest to find (favorable trait), the predator will consume more of the brightly colored beans.
Survival and Reproduction
The small, brown beans will survive to reproduce.
Scientific Method Steps
1. Observation / Ask a Question: Notice a phenomenon and formulate a question about it. 2. Formulate a Hypothesis: Propose a tentative, testable explanation or prediction. 3. Experiment / Test: Design and perform an experiment with controlled variables. 4. Analyze & Conclude: Interpret the data collected.
Independent Variable
The factor that is intentionally manipulated or changed by the experimenter.
Dependent Variable
The factor that is measured or observed in response to the changes in the Independent Variable.
Bar Graph
Used when the Independent Variable is categorical (e.g., different types of fertilizer, colors, genders).
Scatter Plot / Line Graph
Used when the Independent Variable is continuous (e.g., time, temperature, concentration, dosage).
Positive Control
A control that is expected to give a positive result, confirming that the experimental setup is capable of producing results.
Negative Control
A control that is expected to give a negative result, ensuring that no effect is observed when it should not be.
Purpose of Controls
The purpose of each control is to validate the experimental results by providing a baseline for comparison.
Graph Axis
x-axis (horizontal) for Independent Variable and y-axis (vertical) for Dependent Variable.
Experiment Design
Be able to design a control for an experiment.
Lab Practical Question
5 points will be a lab practical question in the midterm.
Midterm Points
The midterm is 50 points.
Free Response Questions
Most questions will be free response.
Control
A standard for comparison in an experiment.
Constants
Things unchanged throughout an experiment.
Example of a Constant
Keeping the Biuret reagent constant (same concentration and volume) in all tubes during the protein standard curve.
Carbohydrates
A class of biomolecules characterized by the presence of carbon, hydrogen, and oxygen, typically in a ratio of 1:2:1.
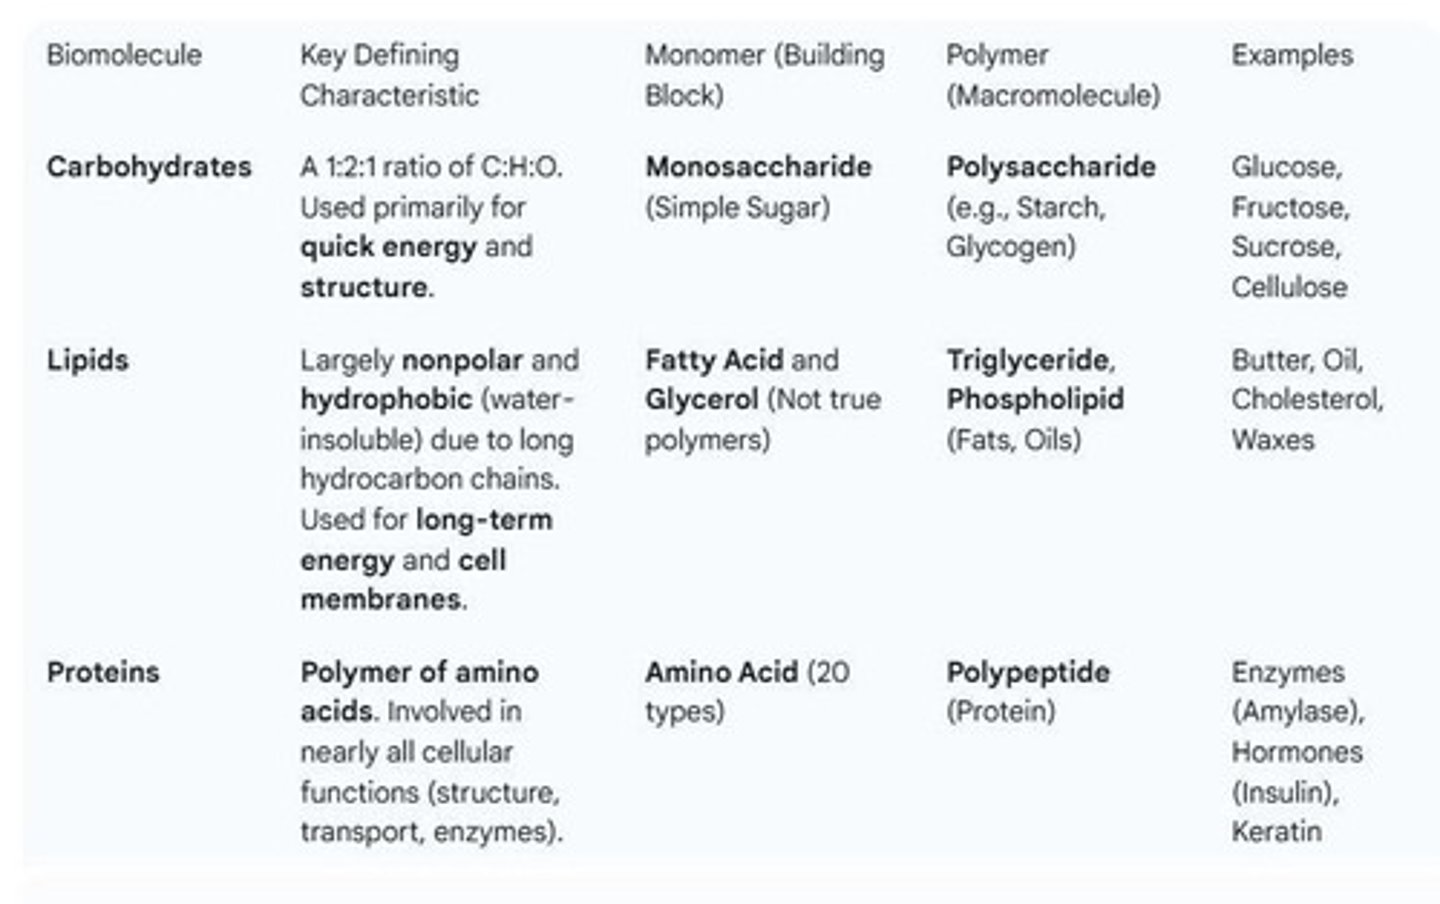
Lipids
A class of biomolecules that are hydrophobic and include fats, oils, and waxes.
Proteins
Biomolecules made from combinations of 20 different amino acids, which dictate their unique functions.
Monomers of Proteins
Amino acids.
Polymers of Proteins
Polypeptides.
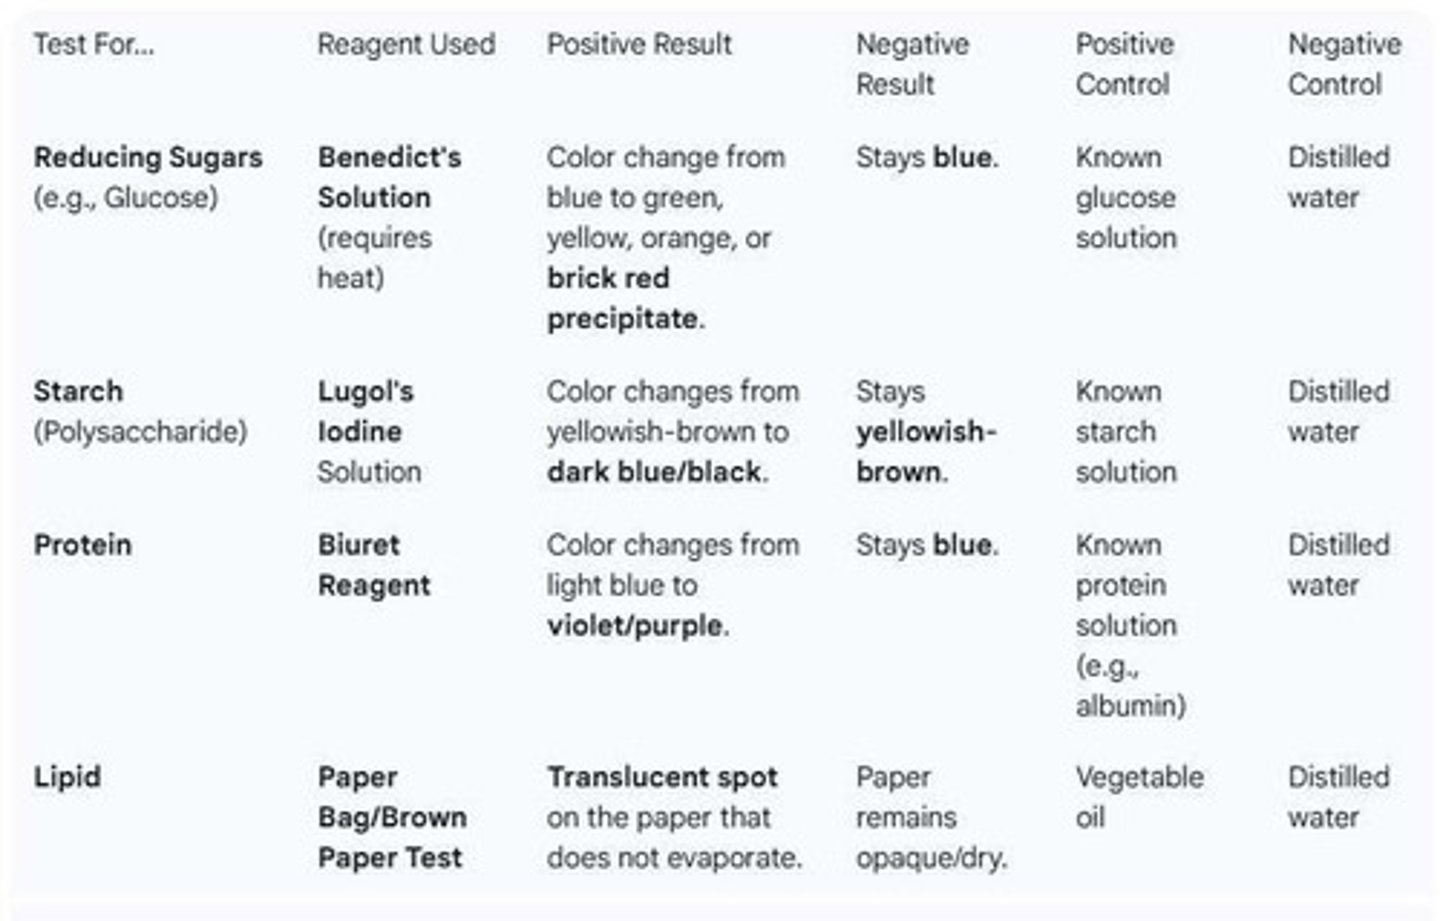
Qualitative Test for Biomolecules
A test to determine the presence of biomolecules using specific reagents.
Positive Control Purpose
To ensure the reagents and procedures are working correctly and are capable of producing a positive result.
Negative Control Purpose
To show what a lack of reaction looks like and to confirm that the observed positive result is due only to the target substance, not the reagents or contaminants.
Diversity of Proteins
Proteins are highly diverse because they are built from combinations of 20 different amino acids.
Three-Dimensional Shape of Proteins
Determined by the primary structure (the linear sequence of amino acids) which dictates how the polypeptide chain folds.
Spectrophotometer
An instrument that measures absorbance of light by a sample.
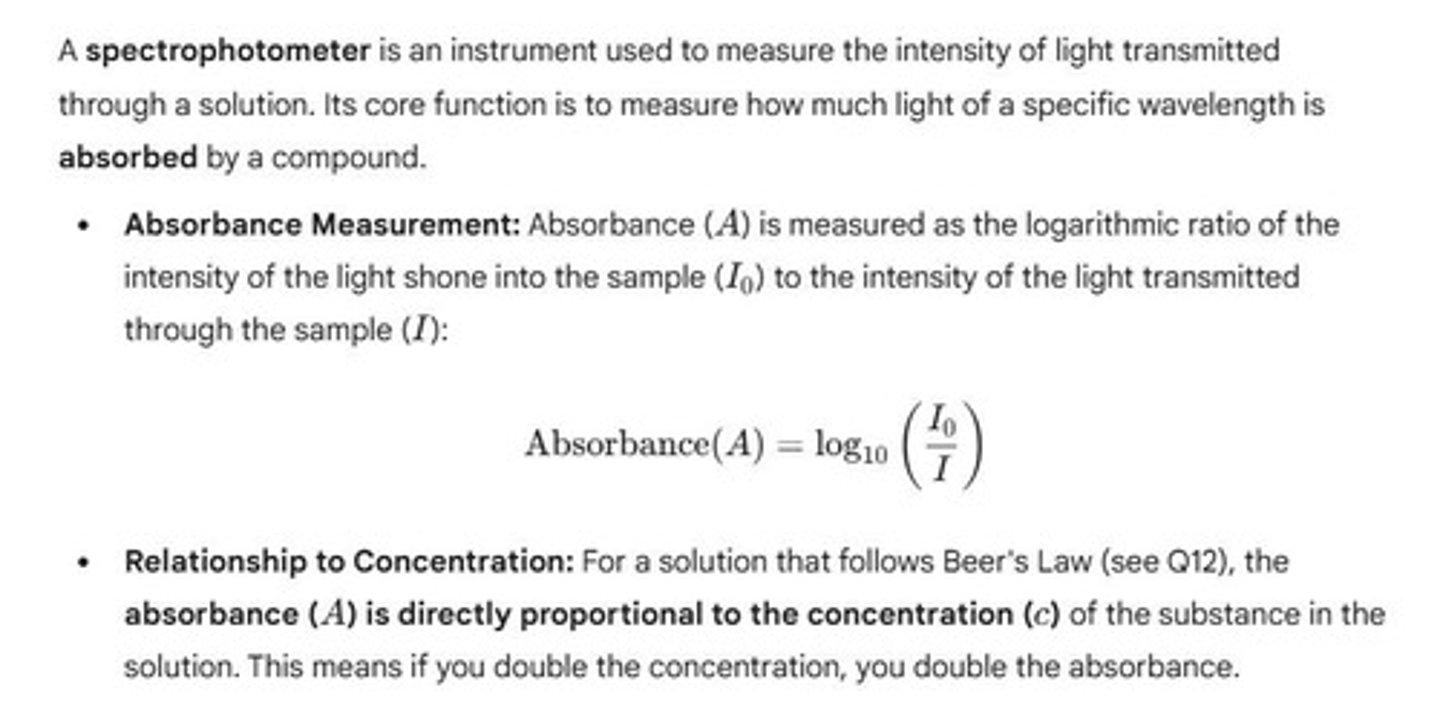
Absorbance Measurement
A measure of the amount of light absorbed by a sample, which relates to the concentration of a substance.
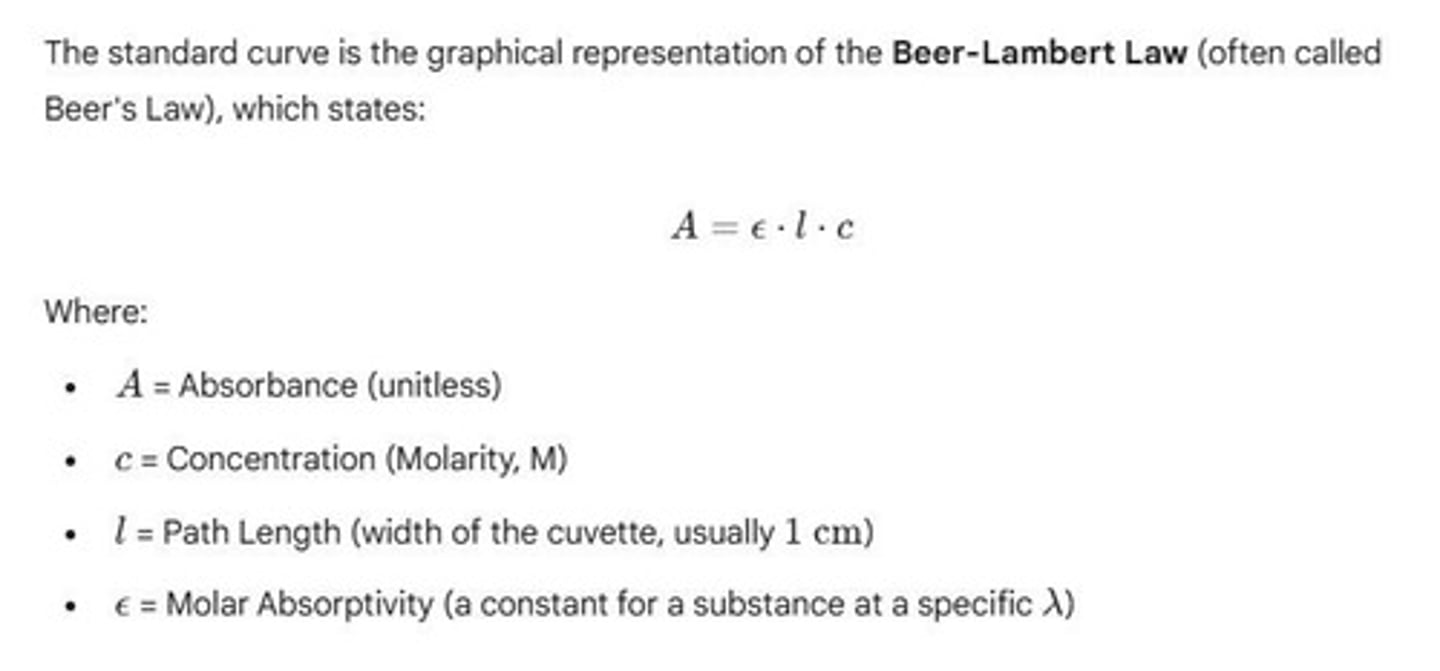
Standard Curve
A graph used to establish the quantitative relationship between a measurable property (like absorbance) and the concentration of a substance.
Standard in Context
A solution containing a known, exact concentration of the molecule being tested (e.g., protein, glucose).
Beer's Law equation
Used to find concentrations of specific molecules in an unknown sample.
Brownian motion
Random movement of particles suspended in a fluid.
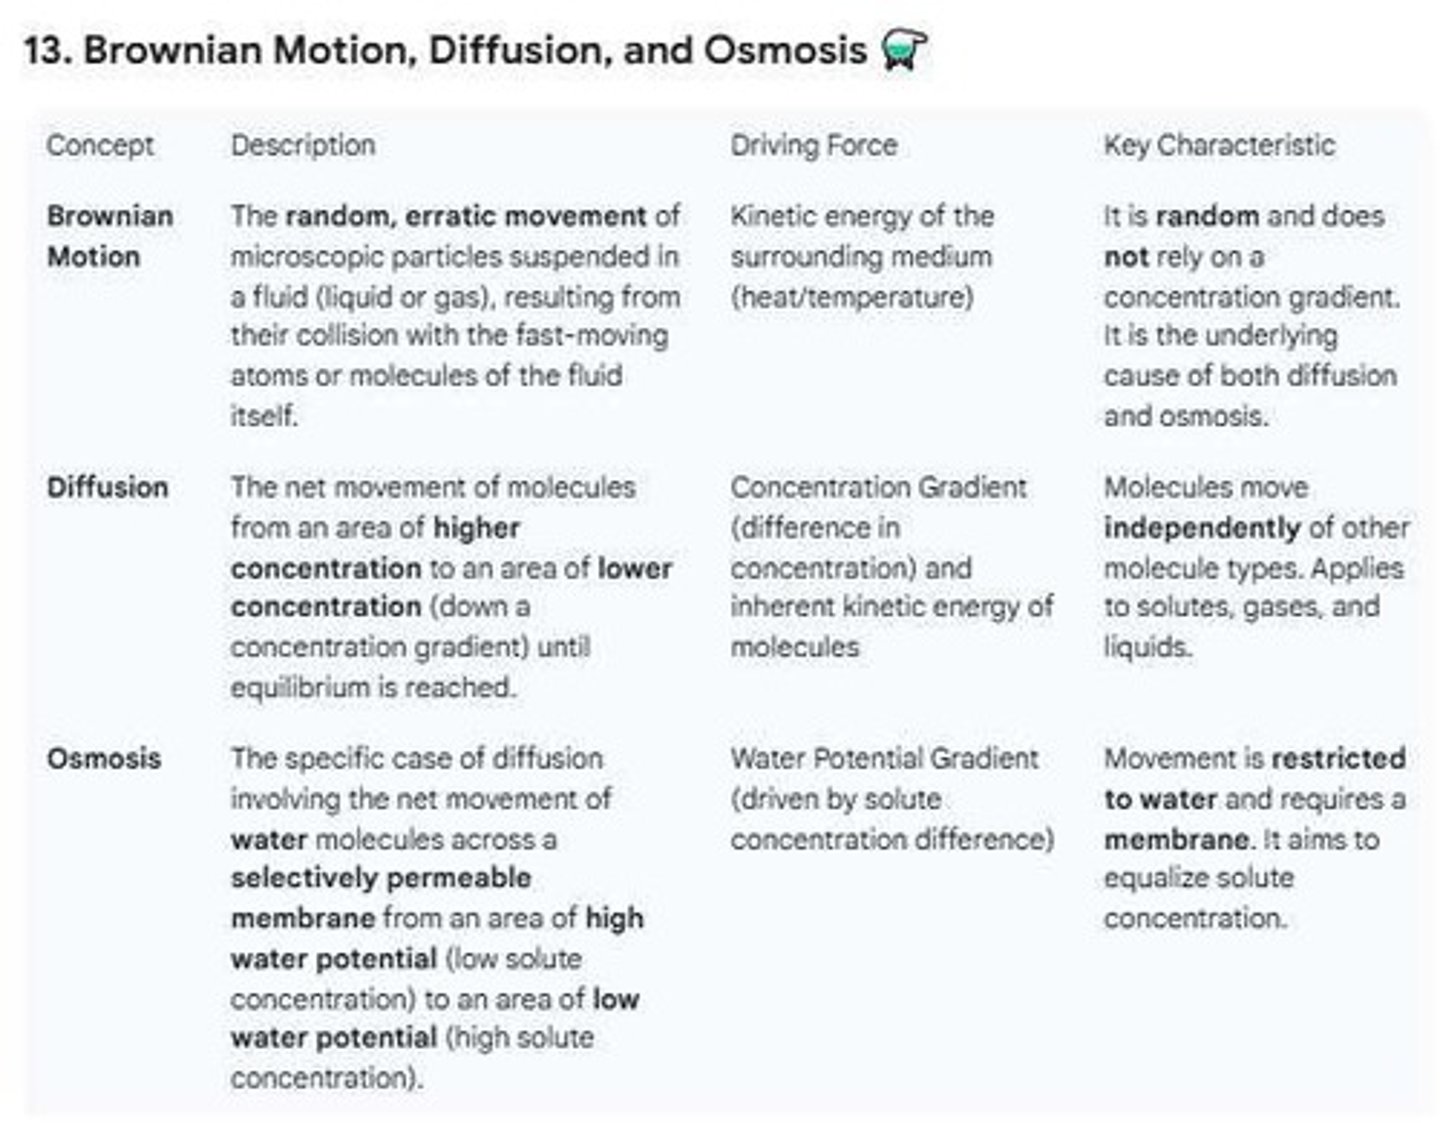
Diffusion
The process by which molecules spread from areas of high concentration to areas of low concentration.
Osmosis
The movement of water across a selectively permeable membrane from an area of low solute concentration to an area of high solute concentration.
Molarity
The concentration of a solution expressed as moles of solute per liter of solution (mol/L).
Osmolarity
The concentration of osmotically active particles in solution (i.e., solute particles that affect water movement).
Tonicity
The relative osmotic effect of a solution on cells (whether water moves into, out of, or neither).
Factors influencing diffusion across cell membranes
1. Size of the solute 2. Polarity / Hydrophobicity 3. Charge 4. Concentration gradient 5. Membrane proteins 6. Membrane fluidity and composition.
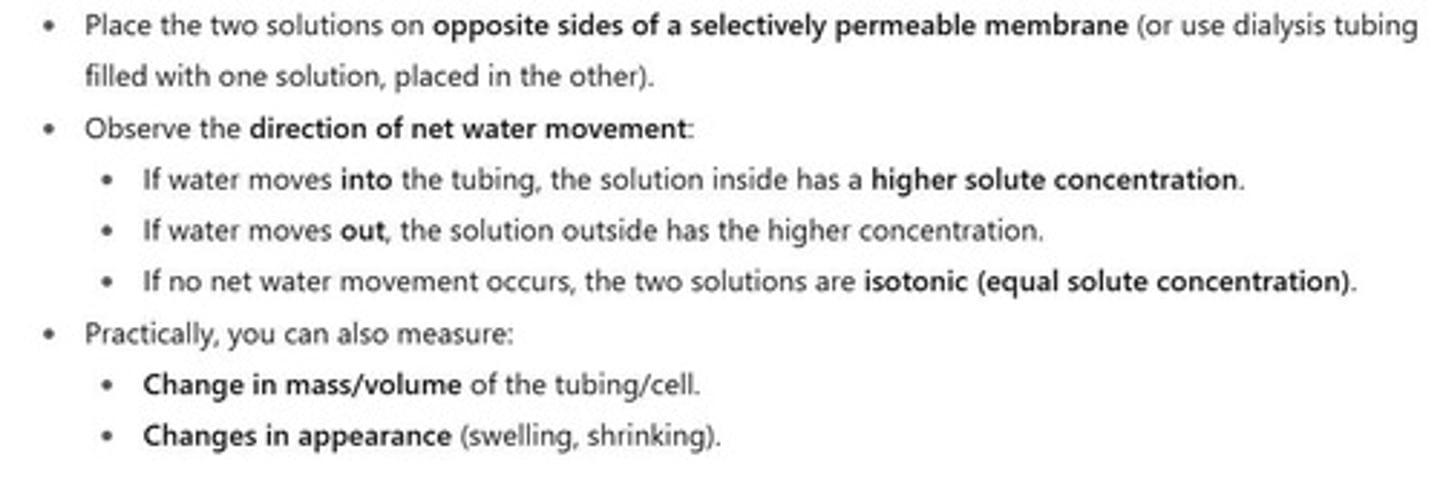
Dialysis tubing
Only molecules small enough to fit through the pores can pass (e.g., water, salts, glucose).
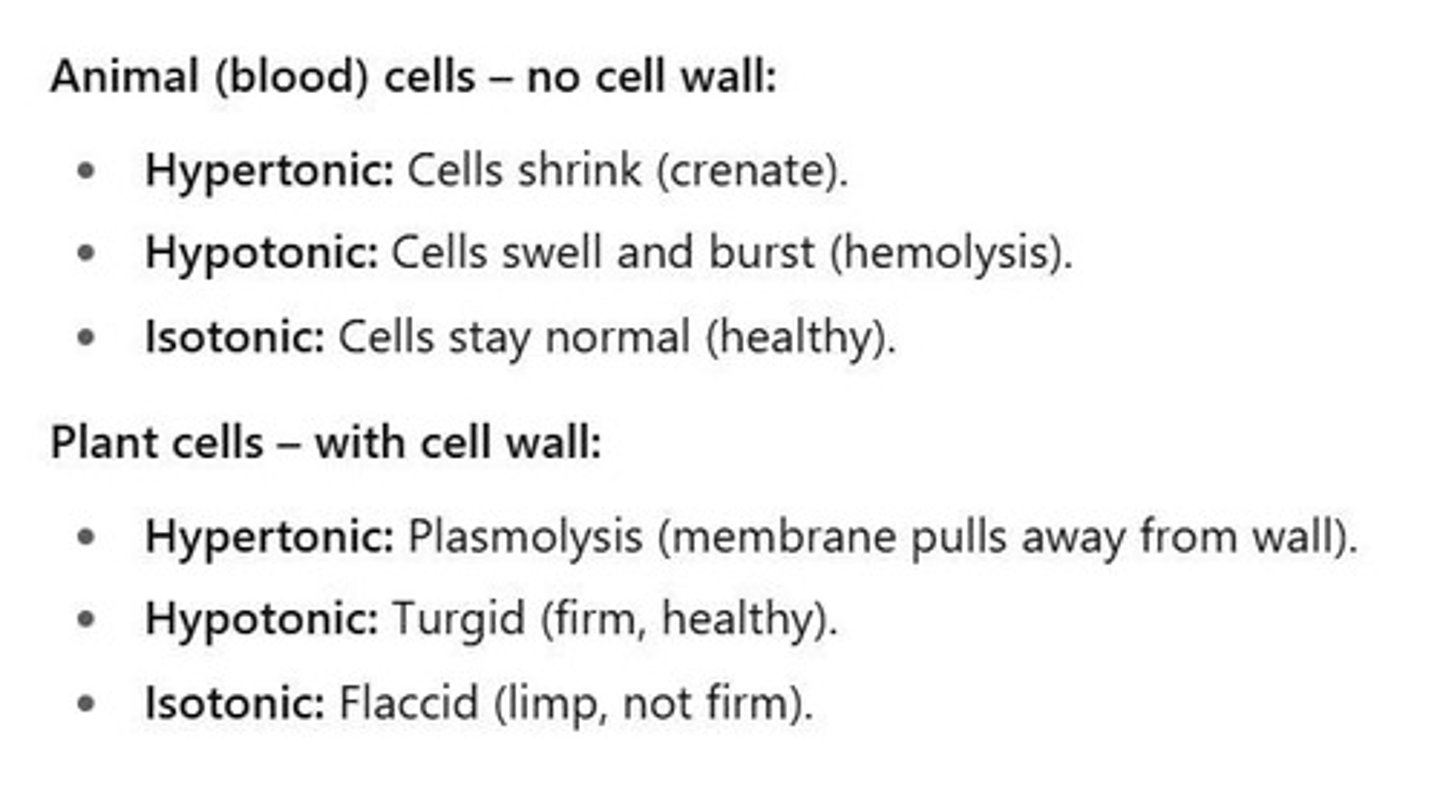
Hypertonic solution
Higher solute concentration outside the cell → water moves out of the cell.
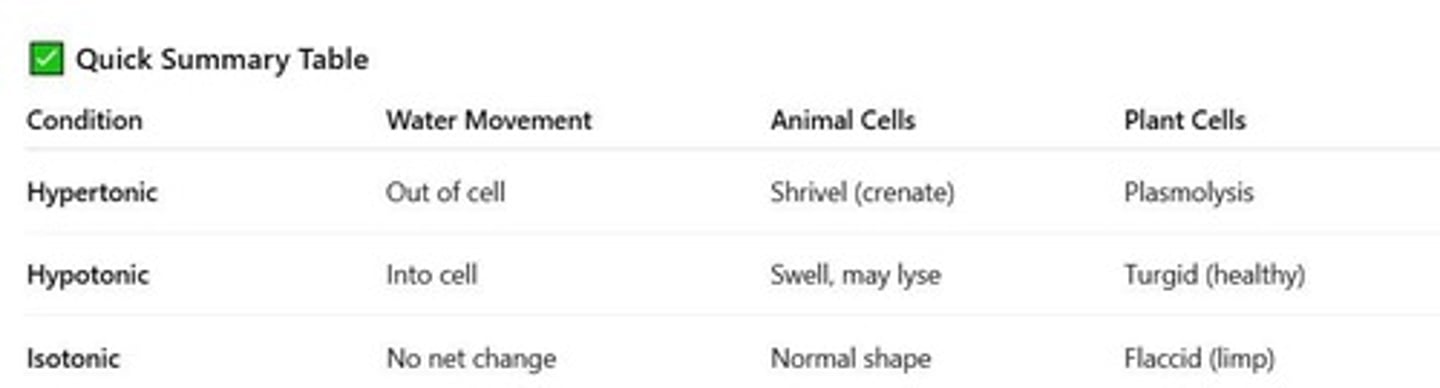
Hypotonic solution
Lower solute concentration outside the cell → water moves into the cell.
Isotonic solution
Solute concentration equal inside and outside → no net water movement.
Turgor pressure
The pressure exerted by fluid in a cell that impacts osmosis.
Enzyme
A biological catalyst, usually a protein, that speeds up chemical reactions by lowering activation energy without being consumed.
Conformation importance
The 3D shape (especially the active site) determines substrate binding and reaction specificity.
Rate of enzymatic reaction
Measured product formation (or substrate disappearance) over time, often using a color change or absorbance (spectrophotometer).
V₀
The initial velocity (V₀) reflects the rate when substrate concentration is highest and product inhibition or enzyme denaturation hasn't yet affected the reaction.
Calculating V₀
Plot product concentration vs. time and determine the slope of the initial linear portion of the curve.
Factors affecting V₀
Substrate concentration, enzyme concentration, temperature, pH, presence of inhibitors/activators.
Denaturation
The loss of an enzyme's native 3D conformation (caused by extreme heat, pH, or chemicals), disrupting the active site and making the enzyme nonfunctional.
Substrate concentration effect
Low → reaction rate increases as more enzyme-substrate complexes form; High → enzyme becomes saturated; rate plateaus at Vmax.
pH effect
Each enzyme has an optimal pH; too low/high alters ionization of active site or substrate, reducing binding/denaturing enzyme.
Temperature effect
Increasing temp → faster molecular collisions → higher rate; beyond optimal → enzyme denatures → activity drops sharply.
Optimal pH for acid phosphatase
Around 4.5-5.0 (acidic environment, consistent with lysosomal activity).
Optimal temperature for acid phosphatase
Around 37 °C (human body temperature).
pH graph shape
Bell-shaped curve → peak at optimal pH, drops on both acidic and basic sides.
Temperature graph shape
Rises with increasing temp (up to optimum) and sharp decline past optimum (denaturation).
KOH function in enzyme lab
Stops the enzyme reaction by denaturing the enzyme and changing pH; changes the product p-nitrophenol into its yellow ionized form for easy absorbance measurement.
Graph production
Be able to produce a graph by hand or Excel, adding correct labels and units for axes.
Volume measurements
Be able to take volume measurements using correct pipetting technique.
Spectrophotometer calibration
Be able to set calibrate a spectrophotometer and collect absorbance reading for a sample.
Diffusion of solutes
Observed diffusion of solutes across a membrane in the dialysis tubing membrane experiment.
Factor affecting diffusion
The factor that affected diffusion of solute across a membrane in the experiment.
Determining solute passage
How we determined whether or not the solute had passed through the membrane (be specific!).