Lecture 9: Factorial Repeated Measures ANOVA & Split-Plot (Mixed) ANOVA
1/34
There's no tags or description
Looks like no tags are added yet.
Name | Mastery | Learn | Test | Matching | Spaced | Call with Kai |
|---|
No analytics yet
Send a link to your students to track their progress
35 Terms
limitations of Cuevas & Dawson
-all statements were read aloud to participants
-so participants who were visual learners, or those who were in the visualisation condition, still had to process the information aurally
-means there was still some mis-match between the way the information was delivered and the learning stye
factorial repeated measures ANOVA - decision tree
-differences between participants or conditions
-continuous DV
-categorical IV
-within-participants design
-more than 1 factors with at least 2 levels
Aslaksen & Loras (example of factorial repeated measures ANOVA)
-matched condition → auditory learners in the spoken presentation condition
-mismatched condition → auditory learners in the written presentation condition
-no sig differences were found between auditory learners who had learned information through spoken or written presentations
-matching presentation style to learning style had no effect on recall
SPSS output (two-way factorial repeated measures ANOVA)
-output provides a table that indicates the factors and levels that have been included in the analysis
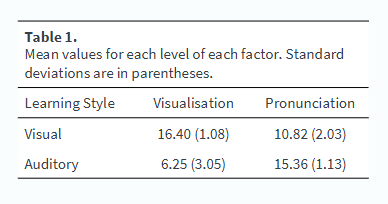
-includes a table of descriptive statistics for each condition → raw means that describe the interaction
-can ignore table of multivariate tests, table of within-subjects contrasts and the tests of between-subjects effects
-also has table for Mauchly’s test of sphericity (without p-value)
test of within-subjects effects (SPSS output)
-needed for report → ANOVA results
-contains the information for the main effect
-also has the error for the levels/conditions
-marginal means are used when describing the results of the main effects
reporting results - two-way factorial repeated measures ANOVA
F (effect, error df) = [f value], p = [p value], np2 = [np2 value]
interaction effect (reporting results - two-way factorial repeated measures ANOVA)
-know it is the interaction effect in the table as it is both of the factor names separated by a star or asterisk
-needs to be reported
marginal means (reporting results - two-way factorial repeated measures ANOVA)
-tell us which level of each factor resulted in better performance (regardless of the other factor)
write-up for a factorial ANOVA
report the type of ANOVA conducted
report the results of the main effects
report the results of the interaction
if there is a significant interaction, report the results of Bonferroni-corrected simple effects tests
if the interaction is not significant, there is no need to conduct simple effects tests
summary statement
assumptions of a repeated measures ANOVA
continuous (scale) DV
normal distribution
no outliers
equal sphericity → no differences in the differences between conditions
test of equal sphericity (assumptions of a repeated measures ANOVA)
-if p-value is significant (p < .05) then the assumption of equal sphericity has been violated
-so, sphericity differs significantly between conditions
-have significant differences in the variances of the differences
-if has been violated should use the Greenhouse-Geisser correction when reporting results
sphericity in a factors with 3 levels (Mauchly’s test of sphericity for 2×2 repeated measures ANOVA)
-the test compares the variance of the differences between conditions →
subtracts the scores from one condition from another condition to calculate the difference in scores between those two conditions
test then calculates the variance or spread of those differences
repeats this for all 3 conditions
then calculates if there are significant differences between each of the three variances
sphericity in a factor with 2 levels (Mauchly’s test of sphericity for 2×2 repeated measures ANOVA)
-if there are only two conditions in a factor it is not possible to compare the variances of the differences
-it is only possible to calculate one set of differences scores → therefore, have noting to compare this to (cannot compare if difference between A and B is different from any other variances because there are no other variances to calculate)
-so when we only have 2 levels, Mauchly’s yest does not produce an output because there’s only one variance score
equal sphericity assumption in a factorial repeated measures ANOVA
-factorial designs with within-participants factors that have two levels
-have no output (p value) for Mauchly’s test of sphericity
-so equal sphericity is assumed
-when reporting ANOVA results, use the “sphericity assumed” row
factorial split-plot (mixed) ANOVA - decision tree
-differences between participants or groups
-continuous DV
-categorical IV
-between-participants and within-participants design
-at least 1 between-participants factor and at least 1 within-participants factor
type-2 error
-false negative → could be due to sampling error
removing type-2 error
-remove type-2 error from a between-participants design by introducing a within-participants element into the design
-reduces the potential impacts of individual differences in the samples by reducing the amount of between-participants factors that we have within our analysis
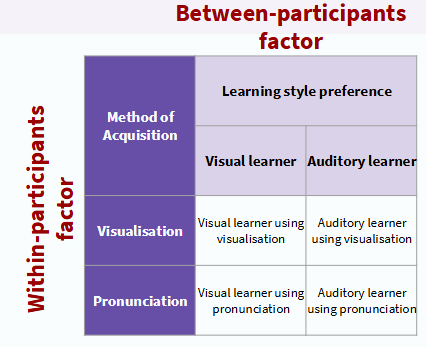
split-plot factorial ANOVA
-combines between-participants factors with within-participants factors
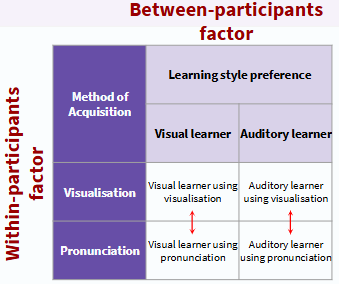
example of split-plot factorial ANOVA
-all participants in left column are visual learners - asked to listen to two sets of statements:
first set are asked to use visualisation
second set asked to focus on pronunciation
-all participants in the right column are auditory learners - asked to listen to two sets of statements:
first set are asked to use visualisation
second set are asked to focus on pronunciation
setting up between-participants factor in SPSS - Cuevas & Dawson example (split-plot factorial ANOVA)
-participants are either categorised as visual learners or auditory learners (one or the other not both)
-data is entered into SPSS as a grouping variable → same way as for an independent samples t-test
setting up within-participants factor in SPSS - Cuevas & Dawson example (split-plot factorial ANOVA)
-all participants were asked to process statements using both visualisation and pronunciation
-all participants are taking part in all levels of this factor → so is a between-participants design
-each participants therefore has two scores (one for visualisation and one for pronunciation) and these are entered in the next two columns
split-plot factorial ANOVA output
-SPSS output will include 2 main effects and 1 interaction effect
main effect of learning style (SPSS output of split-plot factorial ANOVA example)
-will compare the overall performance of the visual learners (group 1) with auditory learners (group 2)
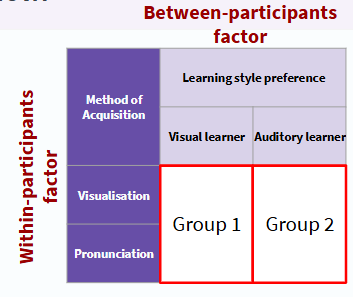
main effect of method of acquisition (SPSS output of split-plot factorial ANOVA example)
-will compare the overall performance of participants when visualisation is used (condition 1) and when pronunciation is used (condition 2)
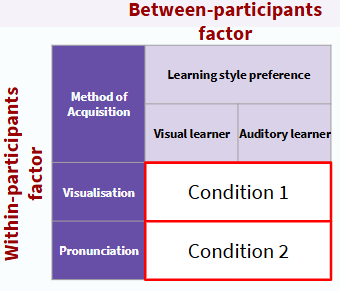
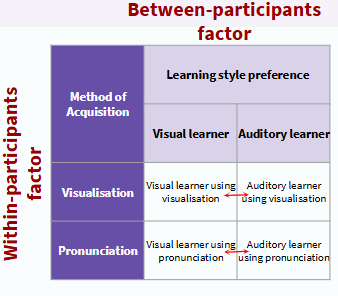
interaction effects (SPSS output of split-plot factorial ANOVA example)
compares visualisation with pronunciation for learners who are visual or auditory
→ outcomes would tell us whether there is a difference between participants in group 1 when they were using visualisation compared to pronunciation and whether there was a difference between participants in group 2 when they were using visualisation compared to pronunciation
can see if there is a difference in learning styles depending on whether participants used visualisation or pronunciation → if there is there would be a significant interaction
SPSS output: split-plot ANOVA
-provides a table that indicates the factors and levels that have been included in the analysis
-separates these into within- and between-subjects factors
-includes a table of descriptive statistics for all combinations of groups and conditions → these are the raw means that are used to describe the interaction
tables that should be ignored (SPSS output: split-plot ANOVA)
-box’s test of equality of covariance matrices
-multivariate tests
-within-subjects contrasts
Mauchly’s test (SPSS output: split-plot ANOVA)
-check this table to see if you have violated the assumption of equal sphericity
tests of within-subjects effects (SPSS output: split-plot ANOVA)
-check this table for the main effect of your within-participants factor and for the interaction effect
-use the error row to report df
-because Mauchly’s test produced no p-value for within-subjects factors that only have 2 levels → read the “sphericity assumed” rows
Levene’s test of equality of error variances (SPSS output: split-plot ANOVA)
-compares the variances for the groups in the between-participants factor in each level of the within-participants factor
-e.g., are there significant differences between the variances for visual and auditory learners in the visualisation condition?
-has the assumption of equal variances been met for the between-subjects factor?
tests of between-subjects effects (SPSS output: split-plot ANOVA)
-gives the main effect for your between-subjects factor
estimated marginal means (SPSS output: split-plot ANOVA)
-used when reporting the results of main effects
significant main effect (example results write-up)
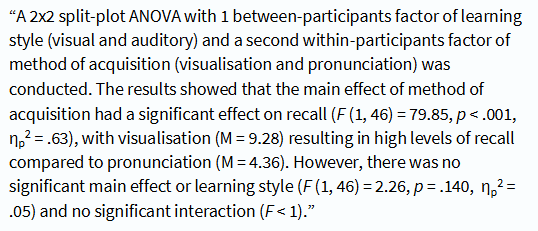
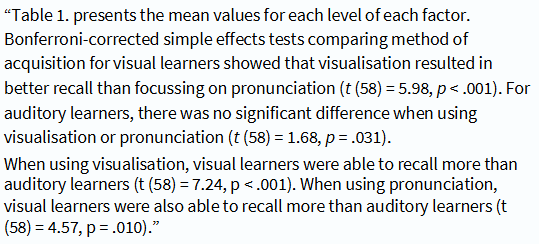
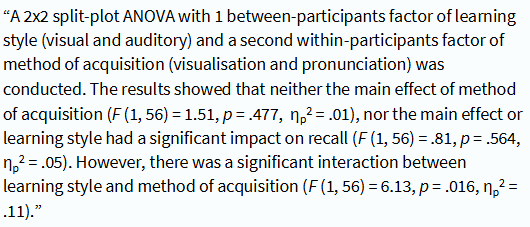
significant interaction (example results write-up)
significant interaction table (example results write-up)