NRES 287 — Week 2: Population Growth & Scarcity
1/19
There's no tags or description
Looks like no tags are added yet.
Name | Mastery | Learn | Test | Matching | Spaced | Call with Kai |
|---|
No analytics yet
Send a link to your students to track their progress
20 Terms
Population Growth Rate (current trends)
An increase in population by 2 billion went from taking 200,000 yrs to now about 25 yrs
The rate of population growth has slowed since 1960 (but the number of people is still growing)
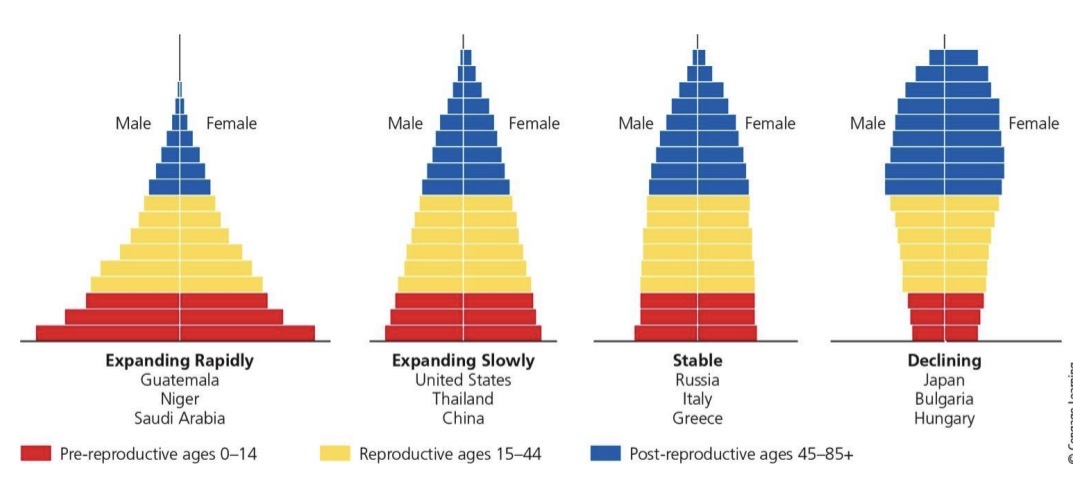
Countries with large percentage of people under 15 are growing rapidly
Slow decline is usually manageable whereas rapid declines lead to economic problems
Ex. Countries with rapidly declining populations: Japan, Germany, Italy, Bulgaria, Hungary, Romania, Portugal
Age Structure
Proportion of males vs females in young, middle, or older age groups within a population.
countries with large percentage of people under 15 are growing rapidly
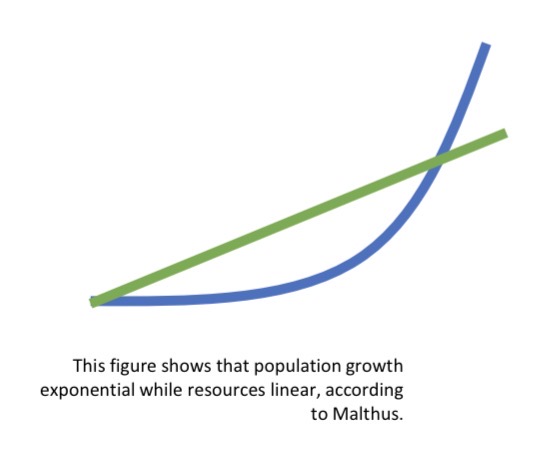
Malthusian
A population perspective
population growth is the main driver of environmental degradation because it creates resource scarcity
Population grows exponentially — 2, 4, 8, 16, 32
Resources grow linearly — 2, 4, 6, 8, 10
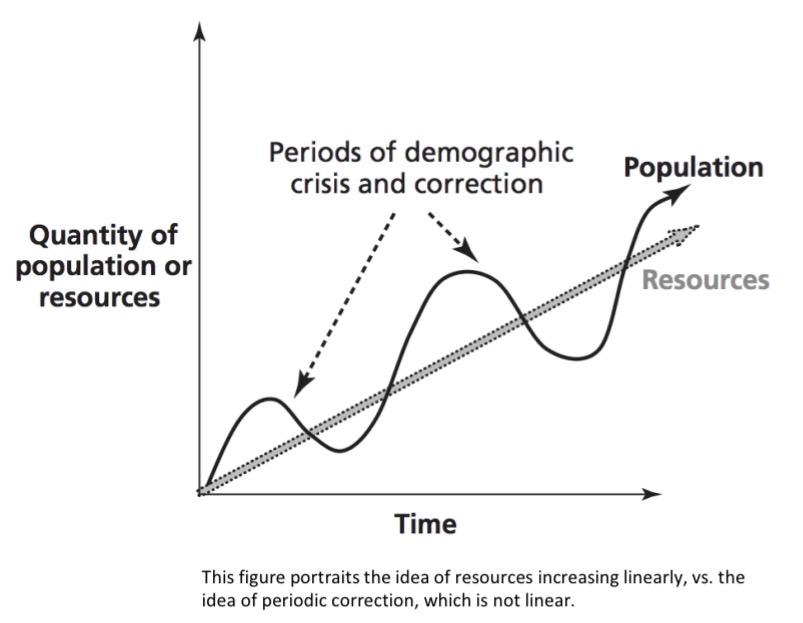
Hypothesized demographic trends: oscillations will occur due to scarcity & resource conflict — preventative checks will lower birth rate & positive checks will occur to increase death rate
Policy suggestions: solutions are with the control of individuals & helping the poor is counter productive — welfare programs just facilitate population growth
Implications: past & present attempts to affect fertility rates — Uzbekistan 2000s & China’s former one-child policy
Neo-Malthusian
a population perspective
Population growth is important in environmental impacts, but affluence & technology mediate these effects
Similar views to Malthusian about overpopulation
Shifted more towards concern about environmental impacts
Greater emphasis on limiting population growth through birth control
Ehrlich (1968) tried to account for different factors with the publication of a controversial book — The Population Bomb
The I=PAT equation
More people more mouths; food production will not keep up with demand
The I=PAT Equation
neo-Malthusian
Population growth is an important factor in environmental degradation, but affluence & technology mediate these effects
I = impact on the environment
P = population (density)
A = affluence — measured by produced goods & services (e.g., GDP); wealthier people tend to consume more resources
T = technology (energy consumption per capita) — technology can either reduce environmental impacts (Ehrlich, 1974) or increase them (Commoner, 1988)
Critiques: overly simplistic but useful starting point for estimations, overlooks political context & governance, what is the role of development? — Kuznets curve
Missing: development
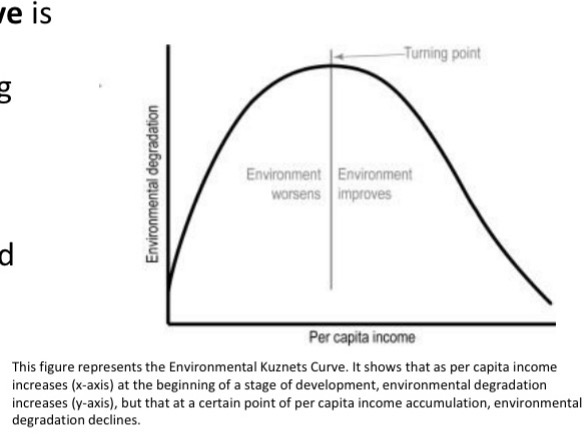
Environmental Kuznets Curve
neo-Malthusian
Critique of I=PAT
The environmental Kuznets curve is based on the assumption that development will have increasing impact on the environment
Once a threshold of affluence is reached, economic transition & regulations lead to a decrease in environmental impacts
Fits some issues: air pollution & deforestation
Does not solve others: energy use & biodiversity loss
Access & Capability
a population perspective
Amartya Sen
Population growth is not the main problem for resource scarcity
Resource scarcity -related problems are caused by access & capability, not availability
Analyzed historical famines (1981) & showed limited associations with food shortages
Problem was not lack of resources, but lack of access to resources
Still possible that we could face scarcity of resources in the future
Critiques: even with fair access, Earth has finite resources (land, water, minerals); access-based solutions may not prevent absolute shortages when ecological carrying capacity is exceeded — ex. Groundwater depletion in parts of sub-Saharan Africa cannot be solved by redistribution alone
Summary pt.1
multiple theories around population growth
Mediating factors can help to explain growth patterns — roles of technology, affluence & other factors, as well as access; the planet’s carrying capacity can potentially shift through innovation & intensification; Kuznet’s curve; access more than population control
Carry capacity & ecological footprints can be used to think about the impacts of individuals & populations
More developed countries
Industrialized nations with high average income per person
17% of the world’s population
Use 70% of the world’s resources
Less developed countries
have higher growth rates but fewer emissions
LDCs in Africa, Asia, & Latin America account for 80% of the world’s population
Use about 30% of world’s natural resources
Cornucopian
A population perspective
Ester Boserup
Population growth provides a resource for innovation to deal with resource scarcity
“Cornucopian” population theorists see population as a resource rather than a problem
There are sufficient resources to sustain populations
When resources are scarce, people will innovate
More people means more brains & hands working to solve problems
Farmers will change practices if population increases & more food is needed — food depends on innovation, not the reverse
Population & innovation: Green Revolution provides evidence; induced intensification of agricultural techniques invented during this time led to greater crop yields
Critiques: informed scale of processes such as food production; some innovations increase agricultural food supply but damage other ecosystems — irrigation = soil degradation; more food may be produced than is needed, but it is not evenly distributed — food waste
More people more ideas; food production is sufficient
Equal Growth Rate
Equal number of births & deaths, therefore no net change in population
growth trends are moving towards zero growth rate in some countries
Population decline
recent population projections indicate that 23 countries will see their population halve by 2100
Nearly all (183/195) countries will have a fertility rate below the replacement level
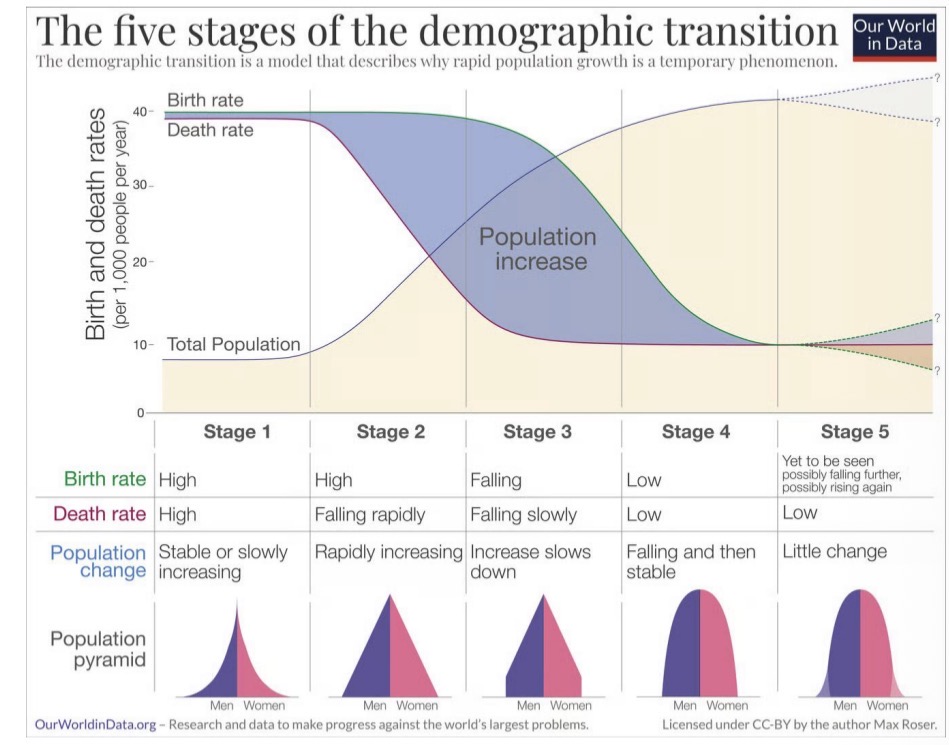
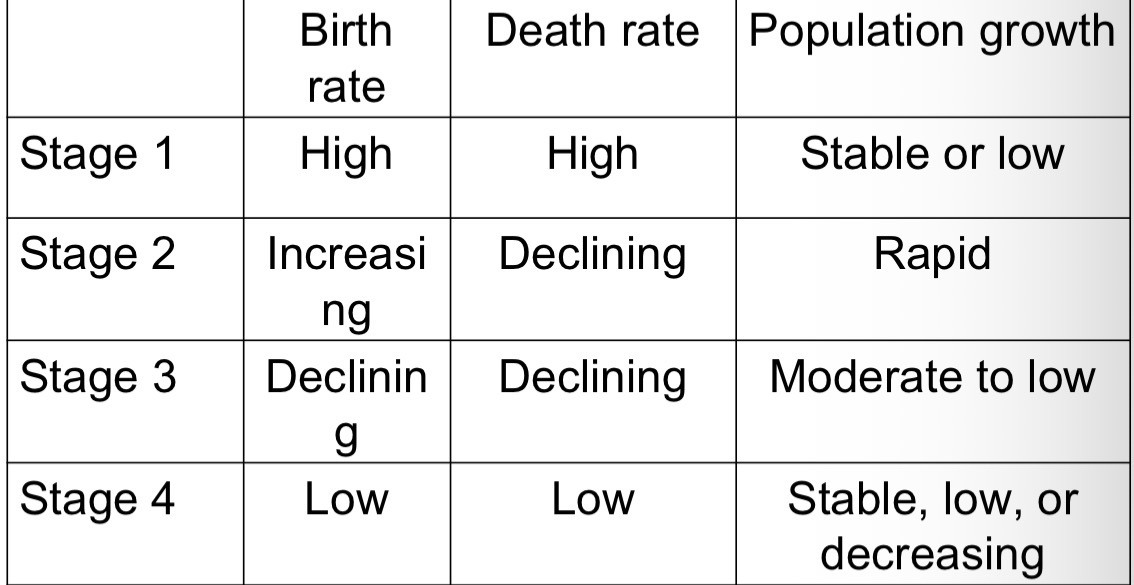
The Demographic Transition Model
a population perspective
Population growth is the result of underdevelopment
Suggests that “development” is the cause of declining population growth rates
In other words, population growth is not the cause of underdevelopment, but the result
Stages:
Stage 1: high death rate, high brith rate to compensate, stable population, “pre-industrial” stage; no countries are currently classified as stage 1
Stage 2: rapid decrease in death rate — due to improvements in overall health, pediatric care, lower infant mortality; birth rates remain stable, rapid population growth
Stage 3: rapid decrease in death rate; death rates continue falling; birth rates decrease, generally due to increase in women’s status & education, & access to contraception; Population growth continues but slows
Stage 4: both birth & death rates are low & stable; population remains stable, brighter increasing nor decreasing; USA is considered stage 4
Stage 5: birth rates continue to decline, death rates may begin to rise due to aging populations, population decline
Critiques:
assumes a linear trajectory of development based on a particular context
Does not account for non-economic factors that may affect population growth
What influences population change?
population change = (births + immigration) — (deaths + emigration)
Replacement-level fertility rate
Total fertility rate
Replacement-level Fertility Rate
Average number of children a couple must bear to replace themselves
about 2.1
Higher than 2 because some children die before reaching reproductive years
Total Fertility Rate
The average number of children born to the women of childbearing age in a population.
Factors that affect fertility
Lack of importance of children as a part of the labor force
Cost of raising & education children
Availability of social support infrastructure (e.g., healthcare, pension systems)
Education + employment for women
Average age at marriage
Availability of birth control
Religious beliefs, traditions, & cultural norms
Women’s rights & fertility
around the world, women’s rights, education, & literacy rates are linked to lower fertility rates
Lower fertility rates are also associated with women’s access to reproductive health care & ability to make reproductive decisions
Should environmental concerns be addressed via population control?
there is potential violence of population-centered thinking
Targets the poor & women rather than systemic causes of degradation