Bioinformatics Exam 2 Review
1/82
There's no tags or description
Looks like no tags are added yet.
Name | Mastery | Learn | Test | Matching | Spaced |
|---|
No study sessions yet.
83 Terms
Hidden Markov Model (HMM)
Statistical model used for sequence analysis; can build protein domain models from multiple sequence alignments.
Position Weight Matrix (PWM)
Matrix showing frequencies of each base or amino acid at every position in a motif; used in motif discovery.
Inferential Statistics (Gene Expression)
Statistical tests (e.g., t-test, FDR correction) used to find significantly differentially expressed genes between conditions.
Normalization (RNA-seq)
Process of adjusting read counts for sequencing depth and gene length; necessary for accurate expression comparison.
Clustering Analysis
Used to group genes/samples with similar expression patterns; helps detect patterns, not causality or significance.
Differentially Expressed Genes (DEGs)
Genes with statistically significant expression differences across conditions; identified via hypothesis testing.
RNA-Seq
Sequencing-based method for transcriptomics; can detect novel genes and isoforms, unlike microarrays.
DNA Microarray
Chip-based gene expression method; limited to known sequences; less sensitive than RNA-seq.
DAVID
Tool for enrichment analysis; finds overrepresented GO terms or pathways in a gene list.
GEO2R
Tool for identifying differentially expressed genes in NCBI GEO datasets; not for functional annotation.
MEME
Tool for motif discovery; identifies sequence patterns like transcription factor binding sites.
Cufflinks
Tool for assembling and quantifying transcripts from RNA-seq data; not used for GO enrichment.
Domain
Structurally and functionally independent part of a protein.
Fold
Core 3D structural framework of a protein domain.
Secondary Structure
Local 3D structure of the polypeptide backbone (alpha helices, beta sheets) stabilized by hydrogen bonds.
Tertiary Structure
Complete 3D structure of a single polypeptide including folding of helices/sheets.
Quaternary Structure
Structure formed by multiple protein subunits interacting together.
Intrinsically Disordered Proteins (IDPs)
Proteins or regions without a fixed structure that still have important cellular functions.
RCSB Protein Data Bank (PDB)
Database of 3D structures for proteins and nucleic acids; allows search, visualization, and download.
VAST (Vector Alignment Search Tool)
Compares 3D protein structures to identify similar structures in MMDB.
CATH Database
Classifies protein domains by structure in four levels: Class, Architecture, Topology, Homologous superfamily.
CATH Class (C)
Describes overall protein secondary structure content (mainly alpha, beta, or mixed).
DALI (Distance Matrix Alignment)
Compares 3D protein structures using inter-residue distance similarity.
AlphaFold
AI developed by DeepMind that predicts protein 3D structure from sequence with high accuracy.
Molecular Docking
Simulates and predicts binding between molecules (ligand-protein or protein-protein).
Homology Modeling
Predicts protein structure by aligning target sequence to a known structural template.
Ab initio Structure Prediction
Predicts protein structure from sequence without a template; typically less accurate than homology modeling.
Artificial Neural Network
Machine learning method commonly used to predict protein secondary structures from sequences.
Phylogenetic Tree
Branching diagram showing evolutionary relationships based on genetic or structural data.
Neighbor-Joining
Method for creating phylogenetic trees using distance metrics.
Maximum Likelihood
Constructs phylogenetic tree that is most likely to produce the observed data under a model of evolution.
Maximum Parsimony
Constructs tree with the fewest evolutionary changes.
k-means Clustering
Unsupervised machine learning algorithm that groups data into k clusters based on similarity; not used for phylogenetics.
Scale-Free Network
Network with a few highly connected nodes (hubs); follows power-law distribution; common in biology.
Small-World Property
Most nodes are connected by a short path; feature of many biological networks.
Random Network
Network with randomly distributed edges; lacks small-world and scale-free properties; unlike biological networks.
Major Applications of MSA
Conserved residues are likely to be part of an active site or functional motif
Patterns in the sequences are useful in classifying families or subfamilies within a set of homologues
Conservation patterns facilitate the identification of distantly related homologues
Molecular phylogeny starts with MSA (the most critical part of making a tree)
Protein structure predictions are more reliable if based on an MSA than on a single sequence
Which of the following statements is NOT true about the major applications of MSA?
A)MSA is often the most critical part of making a tree in molecular phylogeny.
B)MSA is widely used by the intrinsic methods to predict eukaryotic genes from genomic DNA.
C)Conservation patterns revealed by MSA are useful for protein family classification.
D)Protein structure predictions are more reliable if based on MSA than a single sequence.

B) MSA is widely used by the intrinsic methods to predict eukaryotic genes from genomic DNA.
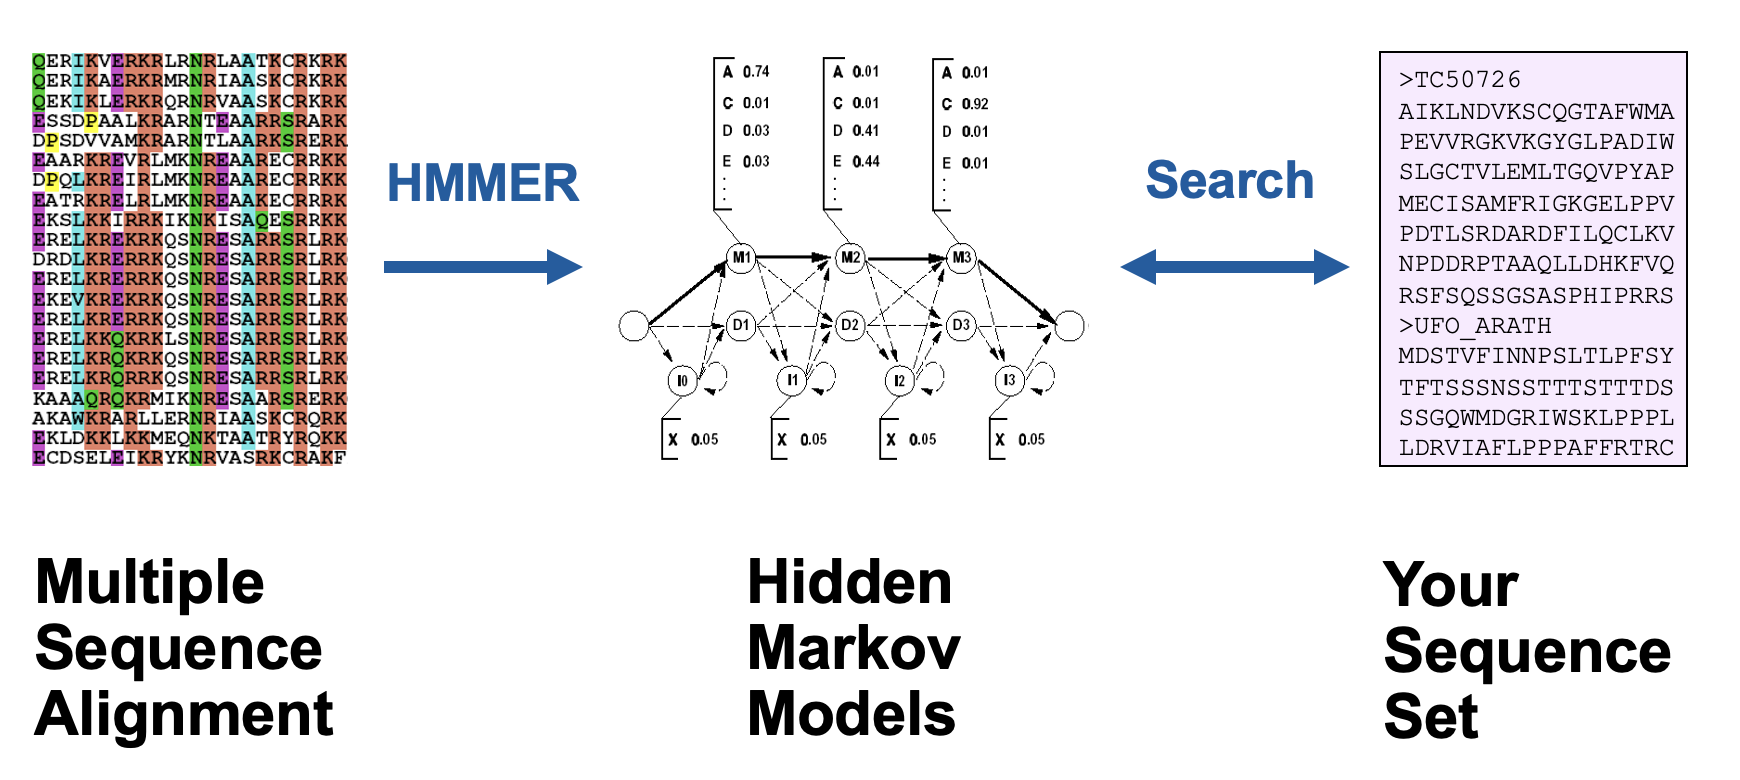
Protein Domain Analysis Using HMM

A method for identifying and classifying protein domains by modeling their sequences and structures through Hidden Markov Models (HMMs). This approach leverages statistical properties of domain sequences to improve predictions of domain boundaries and functions.
True or False:
Hidden Markov model (HMM) is commonly used to construct a protein domain model from a multiple sequence alignment.
True. HMMs leverage MSA data to accurately model protein domains.
Which of the following is commonly used to construct a protein domain model from a multiple sequence alignment?
A)Artificial neural network
B)Hidden Markov model
C)Neighbor-joining
D)Maximum likelihood

B) Hidden Markov model is frequently used to model protein domains by utilizing sequence data from MSA.
Five Stages of Phylogenetic Analysis
Selection of sequences: BLAST search results, protein families from Pfam, NCBI HomoloGene, etc.
Multiple sequence alignment of homologous protein or nucleic acid sequences
Specifying models of nucleotide or amino acid substitution
Tree building: Distance-based methods, maximum parsimony, maximum likelihood and Bayesian inference
Tree evaluation
All the following methods are commonly used to construct a phylogenetic tree EXCEPT:
A) k-means clustering
B) Neighbor-joining
C) Maximum likelihood
D) Maximum parsimony
A) k-means clustering is not typically used for phylogenetic tree construction, as it is a clustering method rather than a method for inferring evolutionary relationships.
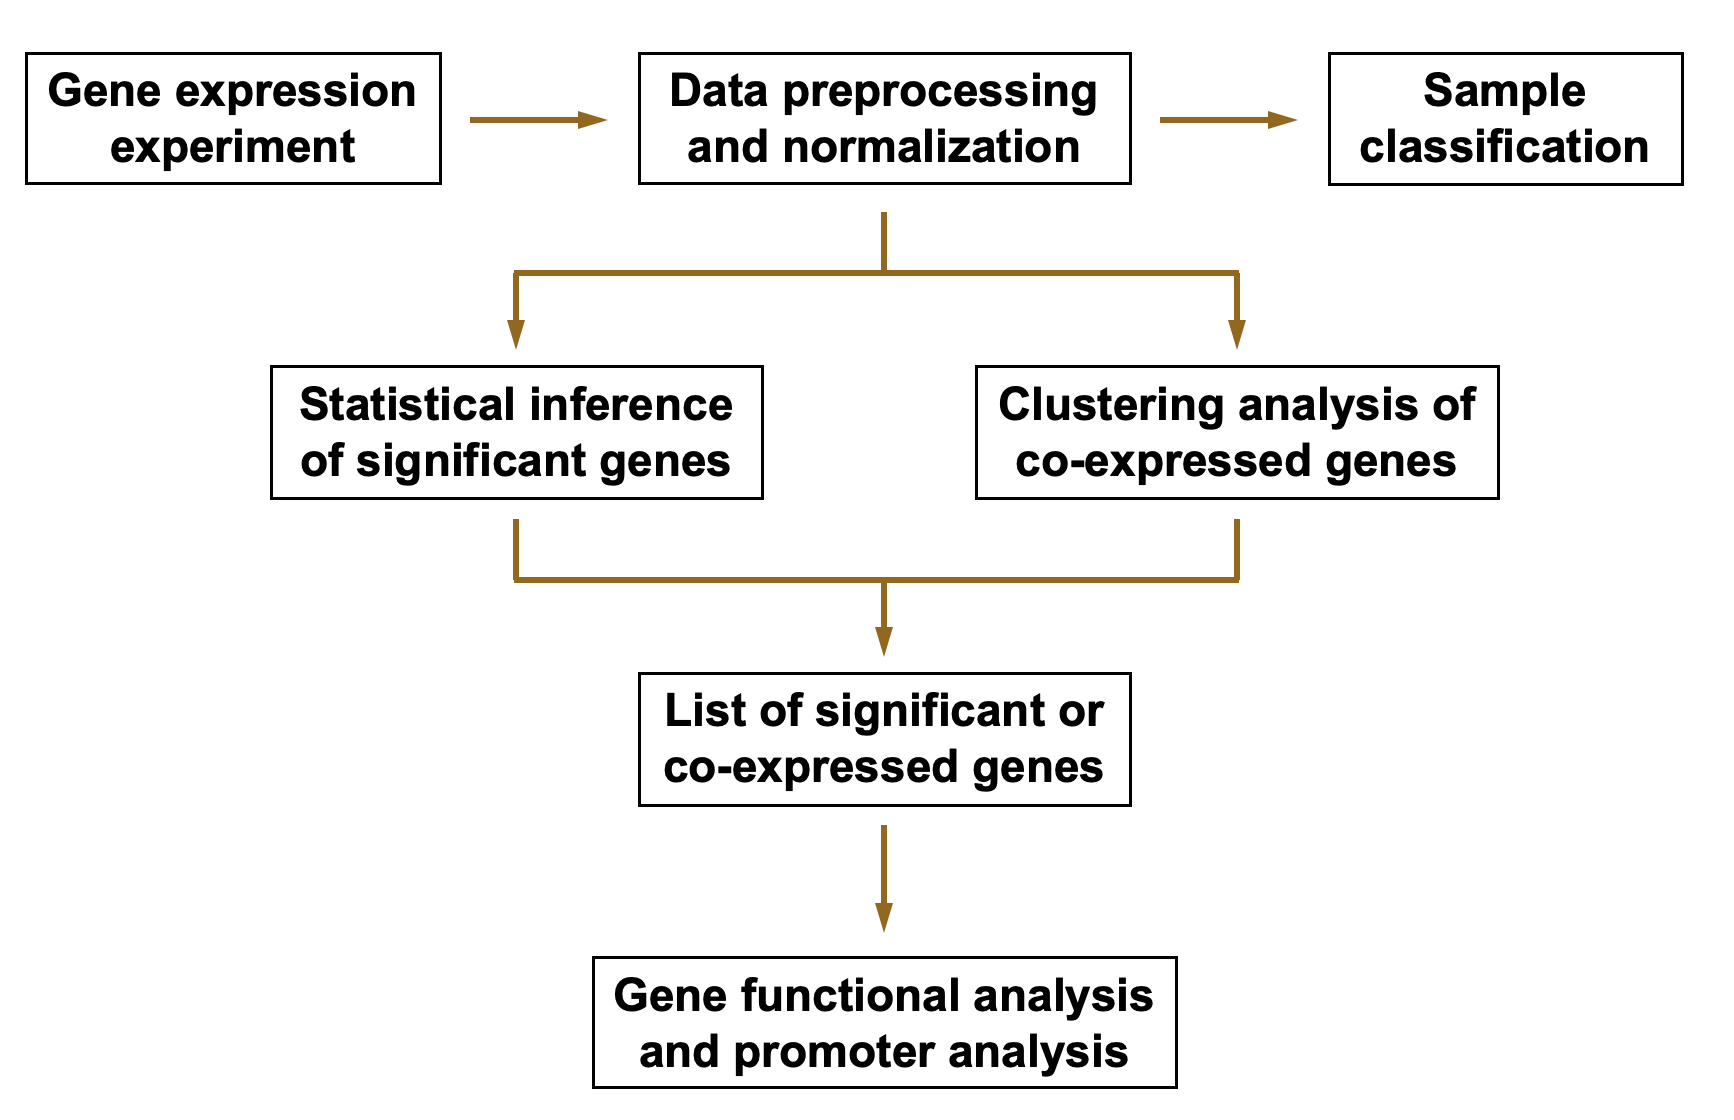
Gene Expression Data Analysis
True or False:
In RNA-sequencing data analysis, the expression level of a transcript is represented as read count, and data normalization is not required.
This statement is False; data normalization is essential to account for variations in sequencing depth and other biases.
RNA-Seq Data Normalization

A process used in RNA-sequencing analysis to correct for biases and variations in read counts, ensuring accurate comparison of gene expression levels across samples.
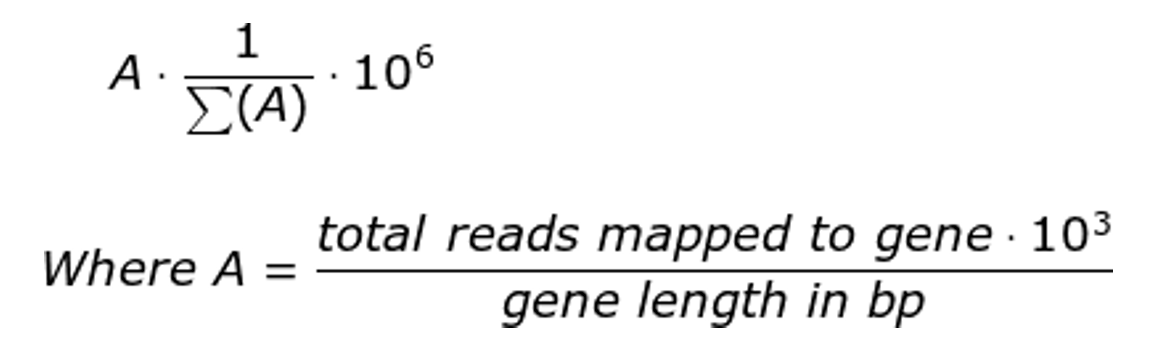
RPKM/FPKM
TPM
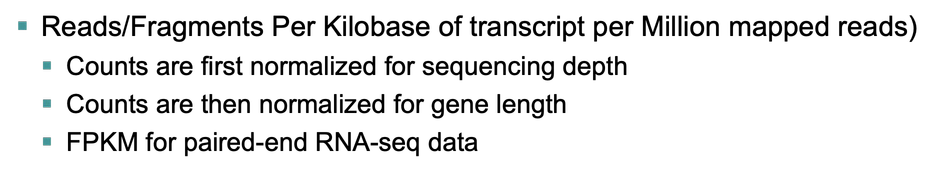
RPKM / FPKM

Reads/Fragments Per Kilobase of transcript per Million mapped reads)
Counts are first normalized for sequencing depth
Counts are then normalized for gene length
FPKM for paired-end RNA-seq data
TPM

(Transcript Per Million)
Proposed as an alternative to RPKM / FPKM
Technology-independent measure of expression
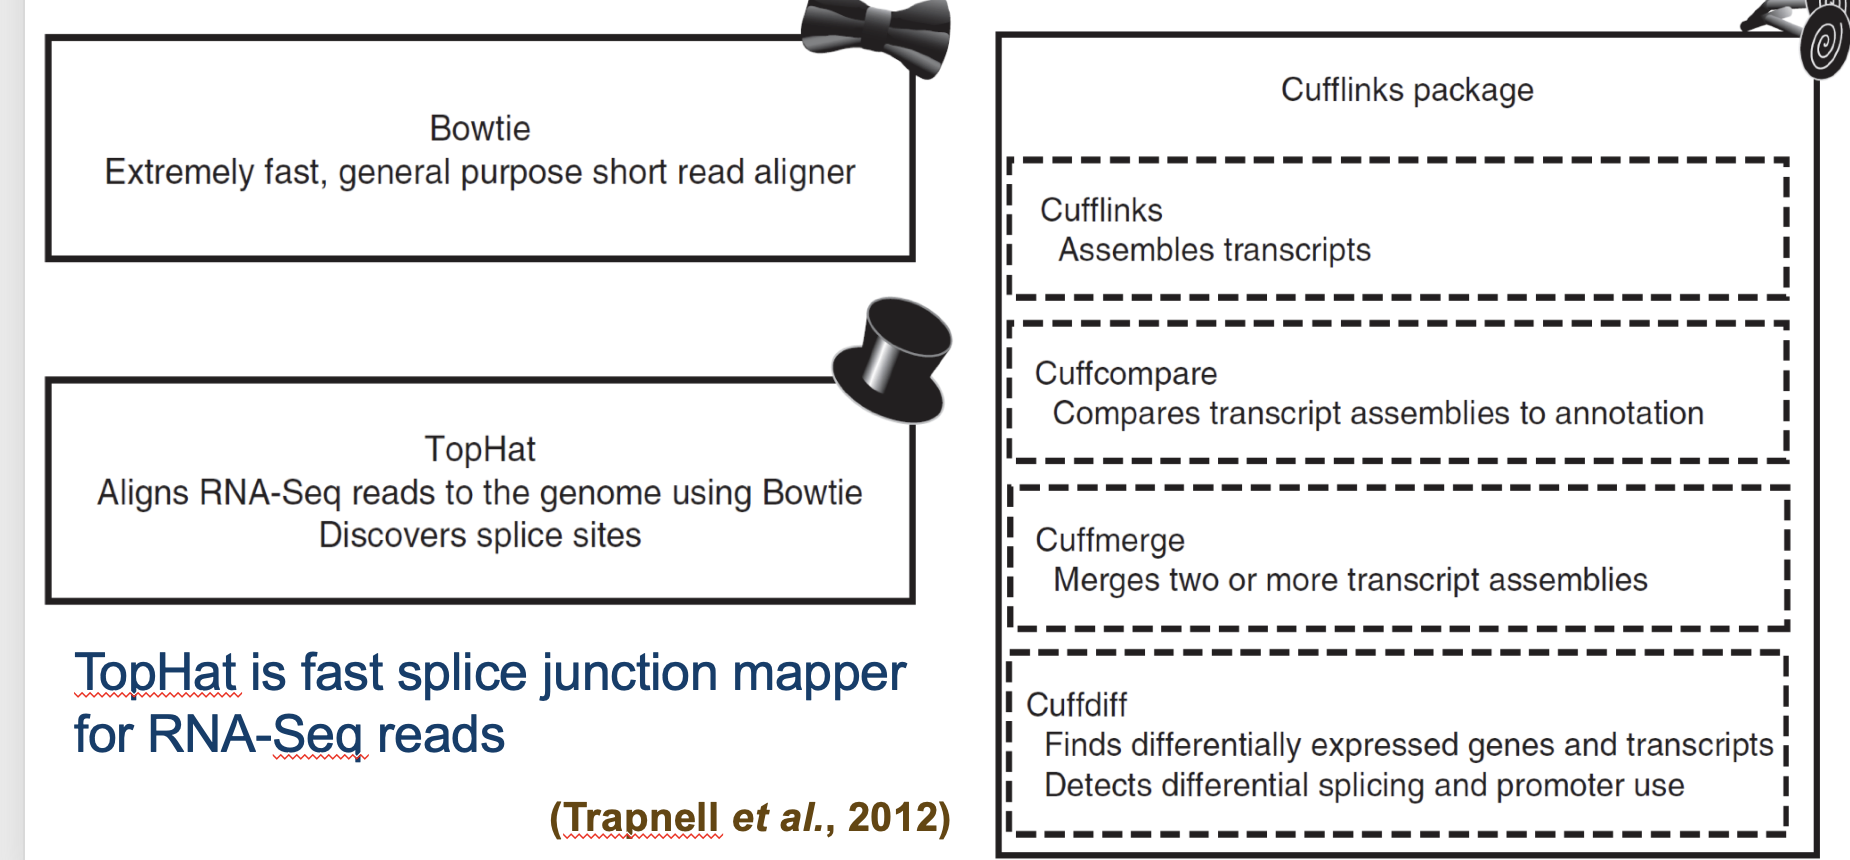
TopHat and Cufflinks

Free, open-source software packages

Compare and contrast Tophat and Cufflinks
TopHat is used for aligning RNA-seq reads to a reference genome, while Cufflinks is used for assembling transcripts and estimating their expression levels from the aligned reads.
Both are components of RNA-seq analysis; TopHat allows detection of splicing events, and Cufflinks quantifies transcript expression using the aligned data.
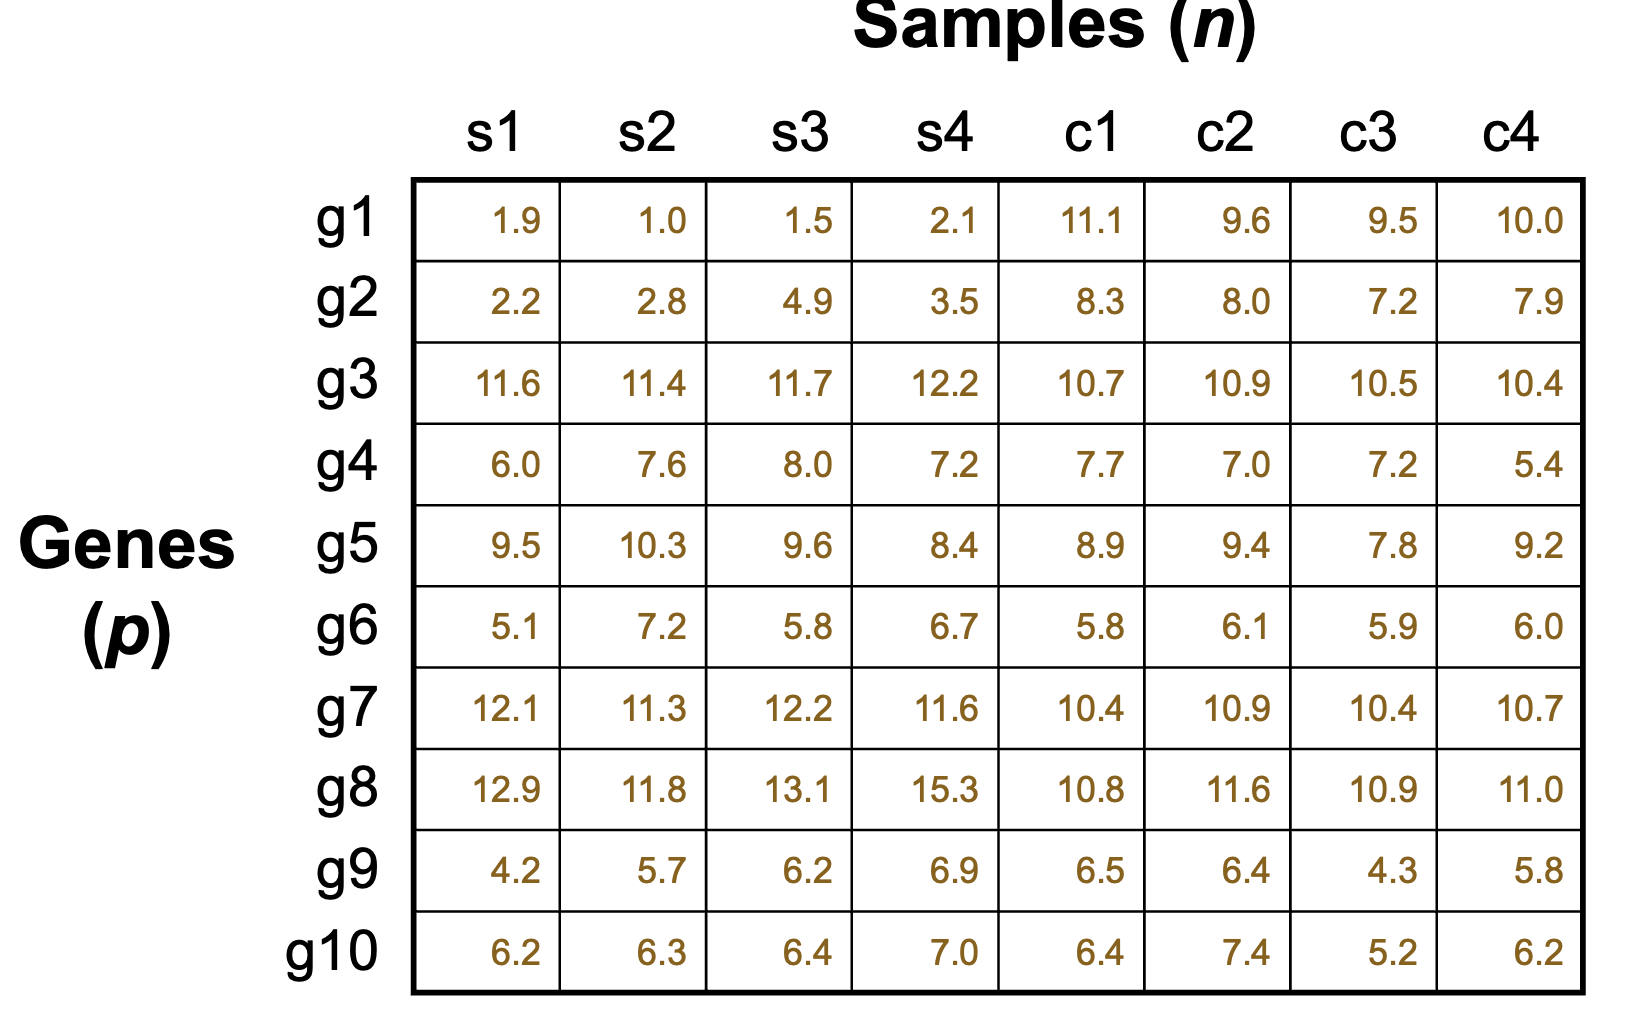
Gene Expression Matrix
A table-like structure that displays gene expression levels across multiple samples, typically used for analyzing RNA-seq data. It contains rows for genes and columns for samples, allowing comparisons of gene expression profiles among different conditions or time points.
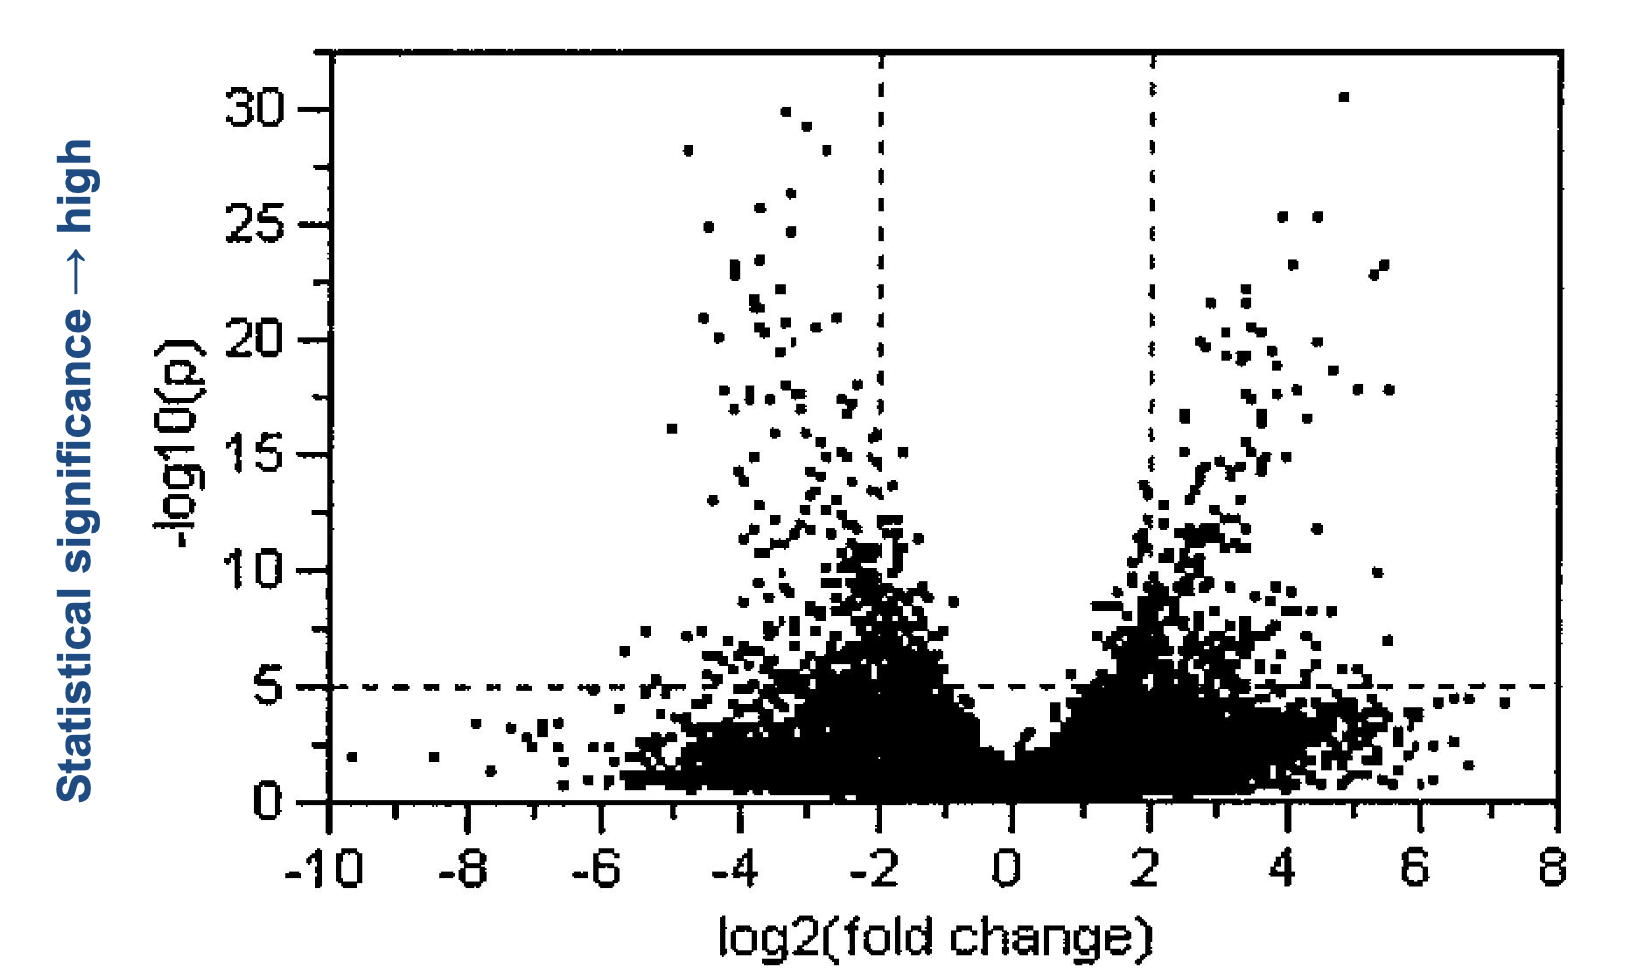
Volcano Plot
A graphical tool used to visualize the relationship between fold change and statistical significance in gene expression data, often used to identify differentially expressed genes.
larger fold does not necessarily mean higher significance levels
Inferential statistics can be applied to gene expression data to perform hypothesis testing _____.
A)by normalization of gene expression profiles
B)by clustering analysis of co-expressed genes
C)in which the probability of differential expression is assessed for each gene by comparing two or more conditions
D)in which correction for multiple testing is not required

C) in which the probability of differential expression is assessed for each gene by comparing two or more conditions
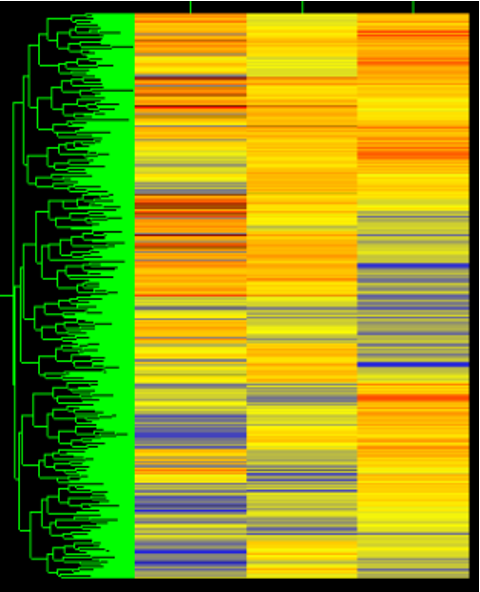
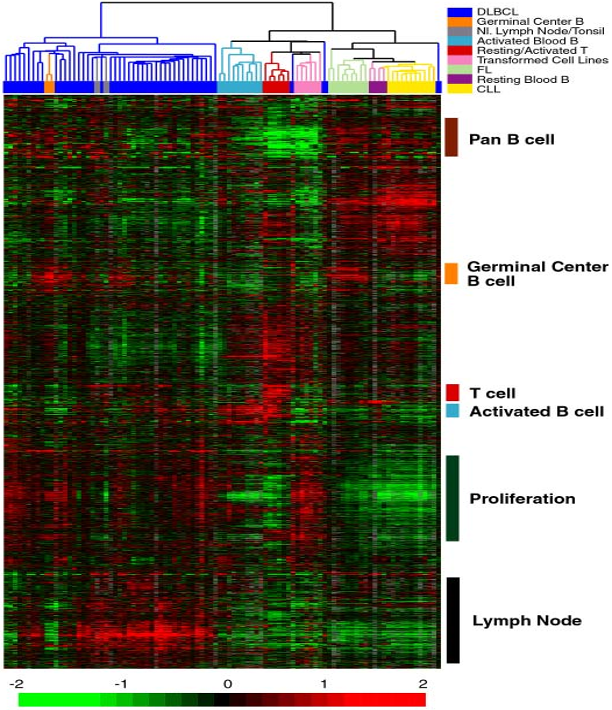
Hierarchical Clustering

Hierarchical clustering results are often visualized using a tree (called dendrogram) with color-coded gene expression levels
Hierarchical clustering can be applied to genes, samples,or both
Hierarchal Clustering
A method of cluster analysis that seeks to build a hierarchy of clusters, commonly visualized as a dendrogram, to represent relationships in gene expression data.
Sample Clustering
A technique used to group similar samples together based on their gene expression profiles. This helps identify patterns and relationships within the data. and visualize related samples in bioinformatics.
Clustering analysis of gene expression data _____.
A)often reveals the causal relationships between genes in a regulatory network
B)always produces a tree which resembles a phylogenetic tree
C)is commonly used to identify differentially expressed genes
D)can find groups of genes or samples with similar expression patterns

D) can find groups of genes or samples with similar expression patterns
How to Assess Whether a Gene Ontology (GO) Term Is Enriched in a Gene List?

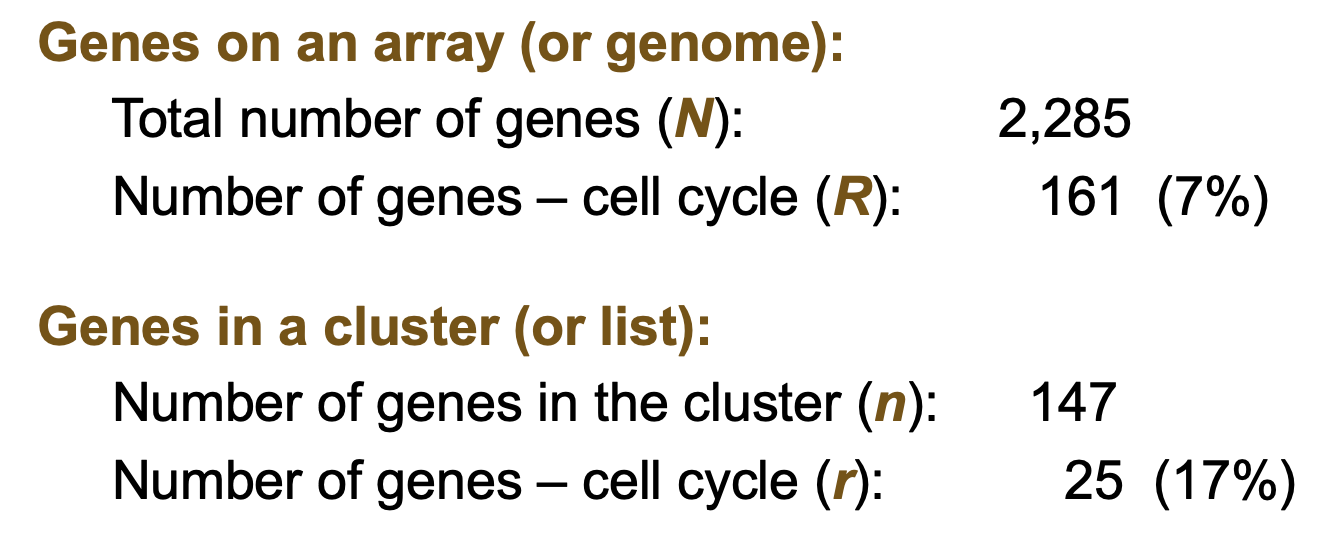
Is the GO term (i.e., cell cycle) significantly enriched in this gene cluster?

This involves statistical methods such as hypergeometric tests or Fisher's exact test to determine if the term is over-represented in a given gene list compared to a background list. Enrichment analysis assesses the significance of the association between the GO term and the gene set. by using statistical tests to evaluate over-representation compared to a background.
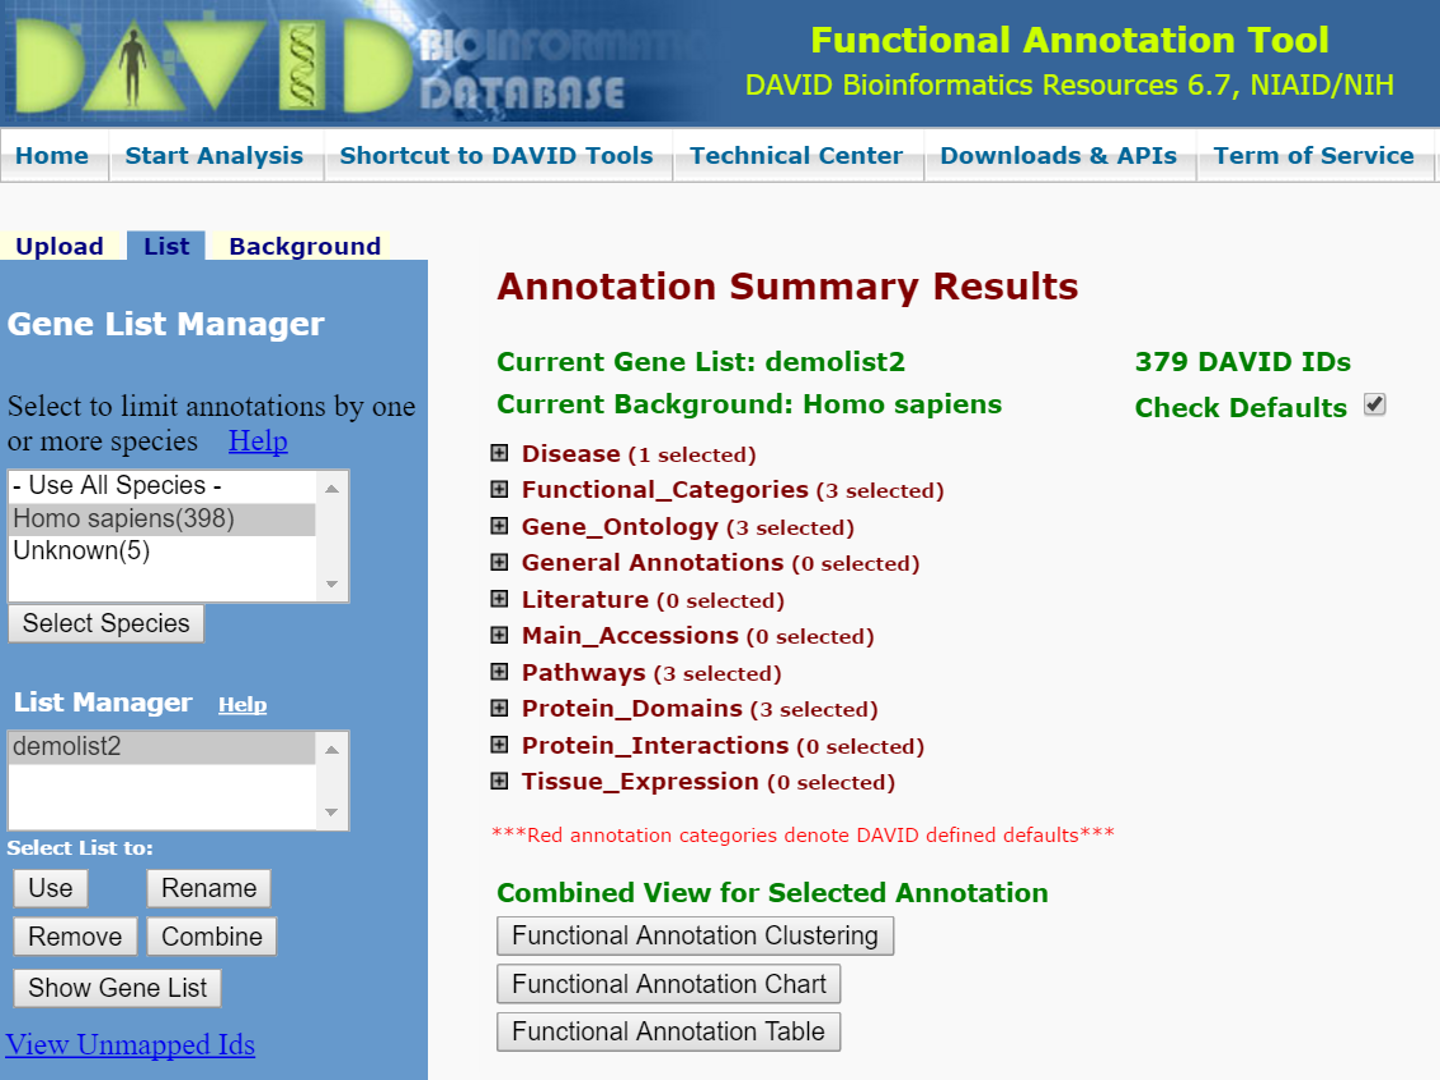
Which of the following can be used to identify functional annotation terms (e.g., GO terms) enriched in a gene list?
A) GEO2R
B) DAVID
C) MEME
D) Cufflinks
DAVID
is a web-based tool for functional annotation and enrichment analysis of gene lists, including Gene Ontology (GO) terms.
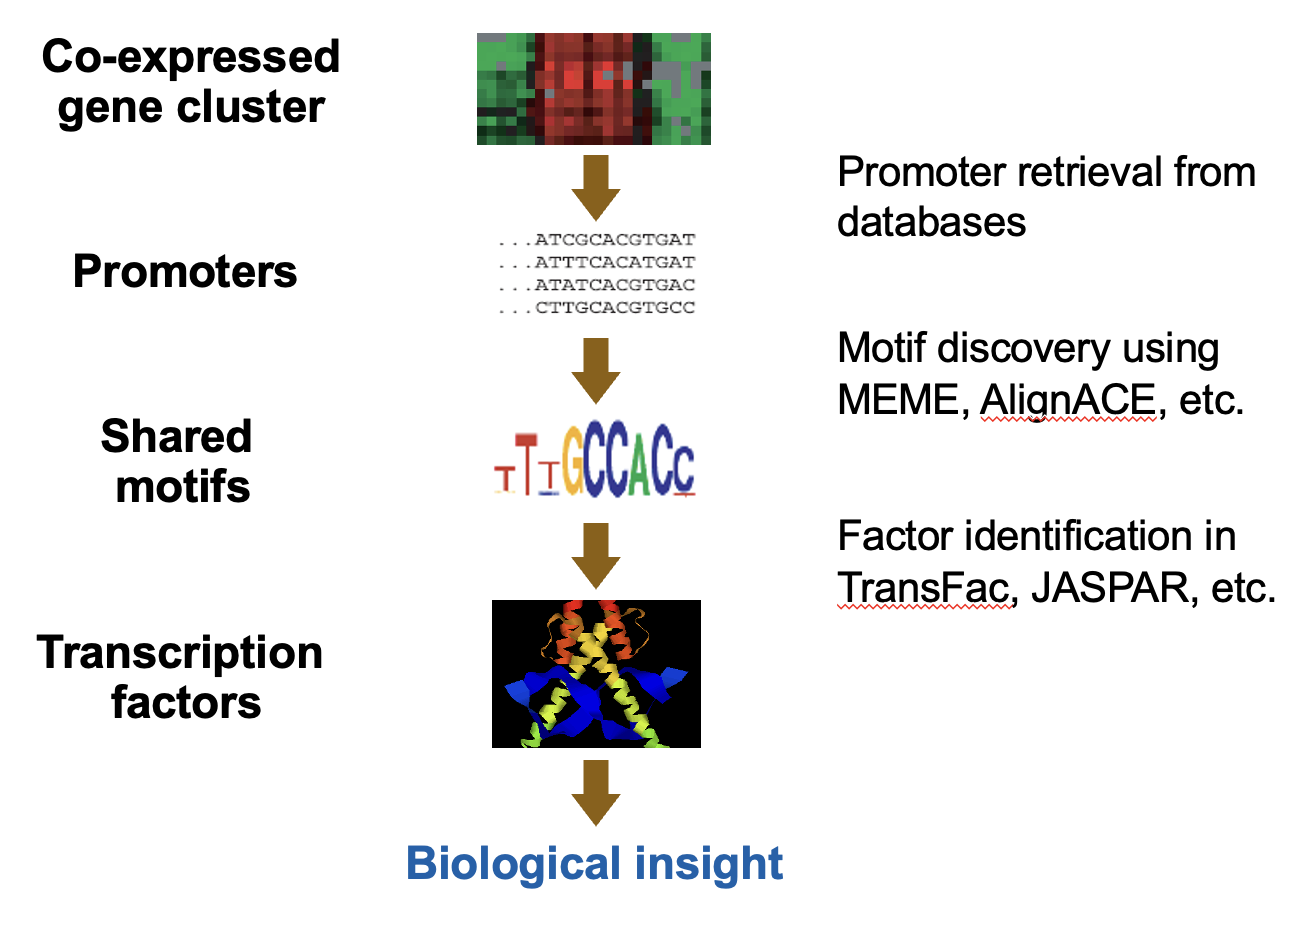
Discovery of Shared Promoter Motifs

refers to the identification of common sequences in the promoter regions of co-expressed genes, which may indicate regulatory elements that control gene expression. This analysis helps to understand the transcriptional regulation of gene networks. This analysis aims to uncover conserved sequences that could be responsible for the coordinated regulation of genes, providing insights into transcription factor binding sites and regulatory mechanisms.
True or False:
Position weight matrix (PWM) is commonly used by motif discovery tools to represent a sequence motif during the pattern discovery process.

True
Position weight matrices (PWMs) are commonly utilized by motif discovery tools to represent sequence motifs quantitatively, assisting in the identification of potential binding sites among DNA sequences.
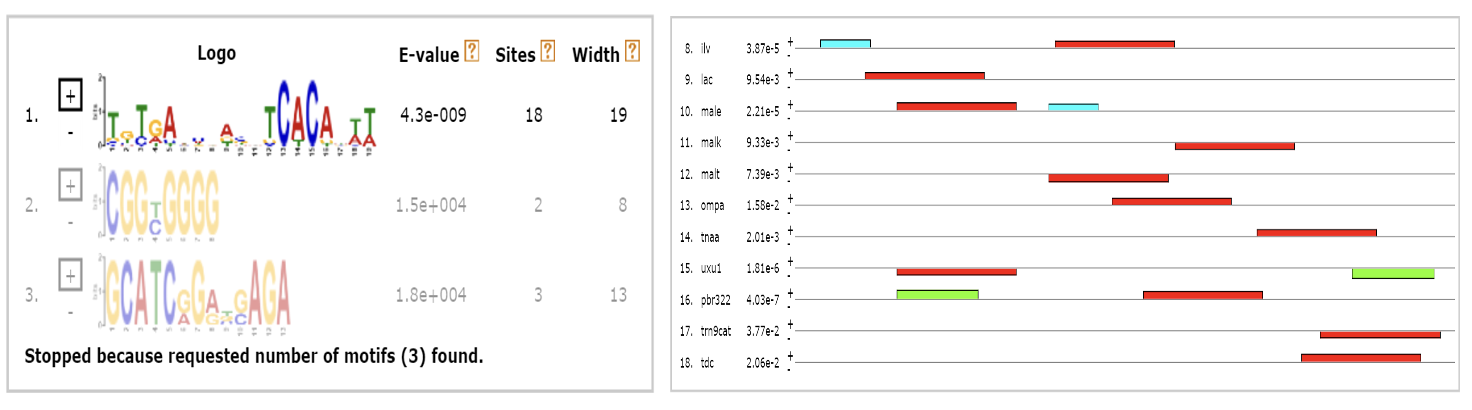
MEME (Multiple EM for Motif Elicitation_
§MEME has been widely used for discovery of DNA and protein sequence motifs
§It is based on the Expectation Maximization (EM) algorithm with several extensions
§MEME is now complemented by the GLAM2 algorithm which allows discovery of motifs containing gaps

Which of the following statements is NOT true about protein structures?
A)Protein secondary structure is the local spatial conformation of the polypeptide backbone because of hydrogen bond formation
B)As a polypeptide folds into the tertiary structure of a globular protein, enough hydrophobic surface must be buried, and the interior must be sufficiently packed
C)Protein subunits in a large complex are often held together by noncovalent interactions, most importantly hydrophobic interactions
D)Intrinsically disordered proteins are those that are always unstructured in normal conditions, and they do not have any known function in cells.

The statement D is NOT true, as intrinsically disordered proteins can perform various functions despite their lack of a fixed structure under normal conditions.
True or False:
Domains are structurally independent segments that have specific functions, and the core 3D structure of a domain is called a fold.

The statement is true, as domains are distinct structural units within proteins that typically retain their function and fold independently.
The Protein Data Bank (PDB) _____.
A) functions primarily as the major worldwide repository of protein sequence data
B) includes the experimentally determined structures for all the protein sequences available in the UniProtKB
C) contains three-dimensional structural data of proteins, nucleic acids, and complexes
D) contains an annotated collection of all publicly available nucleotide and protein sequences
C) contains three-dimensional structural data of proteins, nucleic acids, and complexes
True or False:
RCSB Protein Data Bank (PDB) can be searched using keywords, but does not support structure visualization and downloading data in text format.
The statement is false, as the RCSB PDB allows users to search using keywords, visualize structures, and download data in various formats.
True or False:
Distance matrix alignment (DALI) compares protein structures based on the assumption that similar 3D structures have similar inter-residue distances.
The statement is true, as DALI utilizes distance matrices to assess structural similarity by evaluating the spatial arrangement of residues within protein structures.
NCBI’s Vector Alignment Search Tool (VAST) _____.
A)is a web-based tool for multiple sequence alignment using structural information
B)is an interactive visualization tool for protein structures
C)compares protein tertiary structures based on the primary sequence information
D)allows you to compare a query protein structure against all structures in the Molecular Modeling Database (MMDB) to identify structure neighbors

D) allows you to compare a query protein structure against all structures in the Molecular Modeling Database (MMDB) to identify structure neighbors
The CATH database provides a hierarchical classification of protein structures, and the first level, class (C), describe ____.
A)protein secondary structure content
B)protein superfamilies based on sequence and structure similarity
C)structural connectivity, orientation, and shape
D)the overall shape of protein domain structure

A) protein secondary content
Which of the following is most widely used for protein secondary structure prediction?
A)Hidden Markov model
B)Neighbor-joining tree
C)Artificial neural network
D)Unsupervised learning

C) Artificial neural network
Homology modeling is different from ab initio protein structure prediction because _____.
A) homology modeling, but not ab initio prediction, can be applied to any protein sequence
B) homology modeling requires alignment of the target sequence to a template
C) homology modeling is inherently less accurate than ab initio prediction
D) the accuracy of homology modeling is independent of the percent sequence identity between the target and the template
B) homology modeling requires alignment of the target sequence to a template
True or False:
AlphaFold is an AI system developed by DeepMind that predicts a protein’s 3D structure from its amino acid sequence and regularly achieves accuracy competitive with experiment.
True. AlphaFold utilizes advanced machine learning techniques to make precise predictions about protein folding, significantly impacting structural biology.
True or False:
Molecular docking can be used to predict the binding of small molecules (ligands) to proteins, or protein-protein binding.
True. Molecular docking is a computational technique that predicts the preferred orientation of ligands when they bind to a protein, aiding in drug design and understanding molecular interactions.
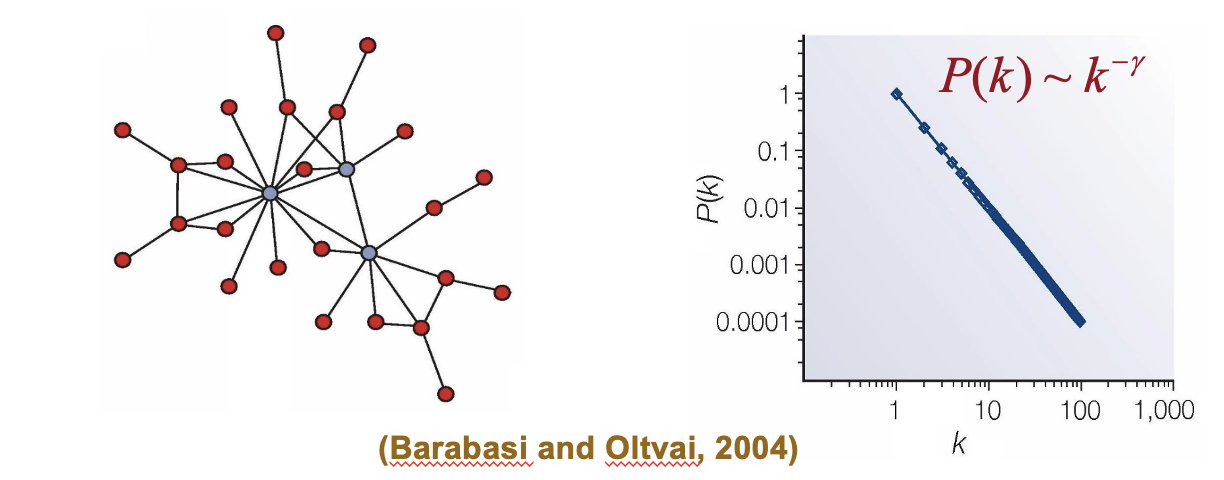
Scale-Free Network Model

A network structure where the degree distribution follows a power law, resulting in some nodes having significantly more connections than others. This model is commonly used to describe complex biological systems, such as protein interaction networks.
construction
degree distribution
mean path length
True or False:
Many biological networks are random networks that have the power-law degree distribution but not the small-world property.
False. Many biological networks are scale-free networks, which exhibit a power-law degree distribution and typically possess the small-world property, characterized by short average path lengths between nodes.
Which of the following can be used as a good measure of network connectivity?
A) Shortest path length
B) Mean path length
C) Total number of nodes in the network
D) Total number of links in the network
B) Mean path length
The topological properties of scale-free networks include _____.
A) one and only one path between each pair of nodes
B) a Poisson degree distribution
C) a power-law degree distribution
D) the non-small-world property
C) a power-law degree distribution
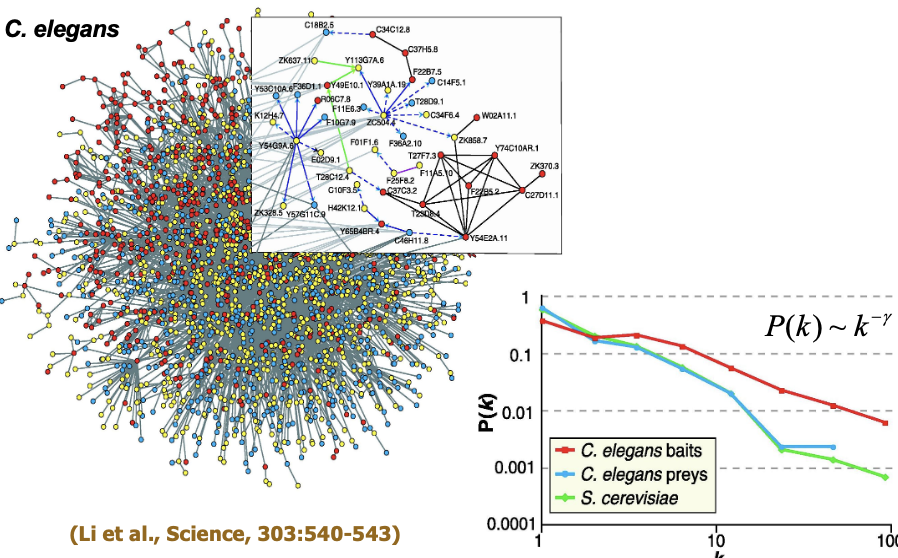
Topological Properties of PPI Networks
Small-world property
Scale-free networks
Power-law degree distribution
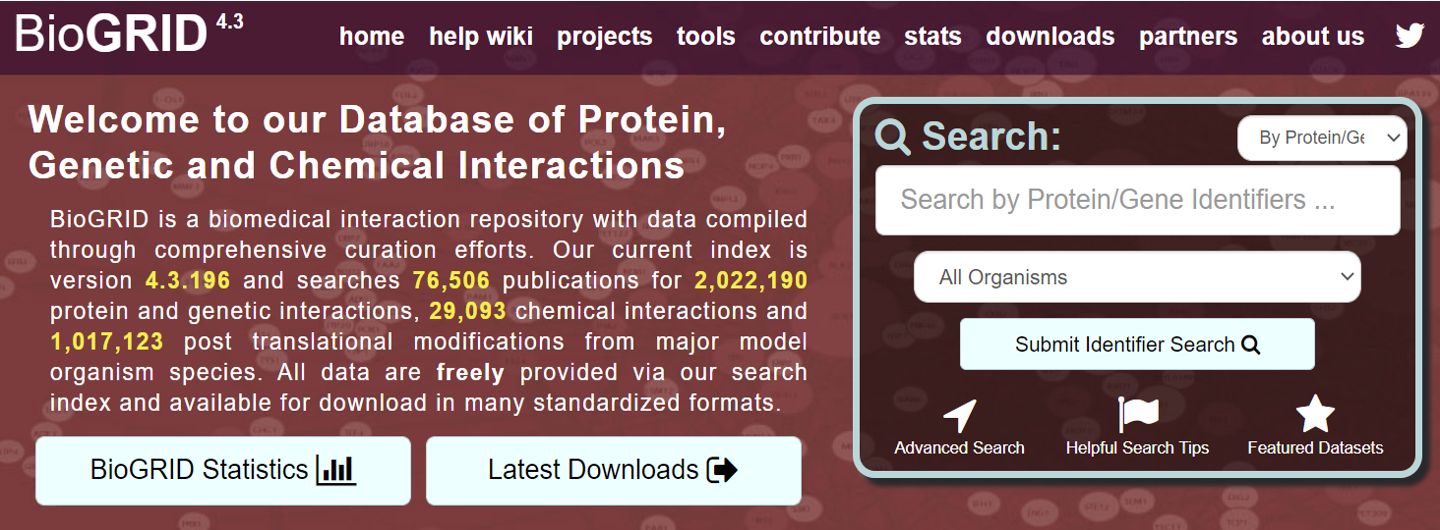
BioGRID
Biological General Repository for Interaction Datasets (BioGRID) includes over two million protein and genetic interactions in human and model organisms
The interaction data have been compiled through comprehensive curation efforts
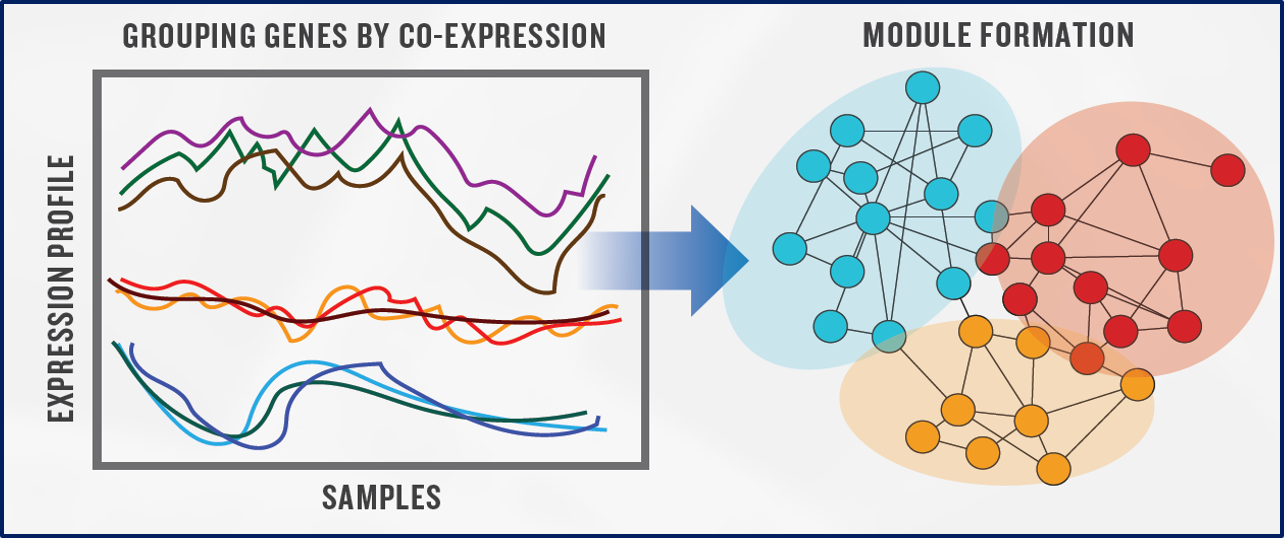
Gene Co-expression Network Analysis

A gene co-expression network is an undirected graph, in which each node is a gene, and each edge represents a significant co-expression relationship between two nodes
It can be constructed by looking for pairs of genes which show a similar expression pattern across various samples
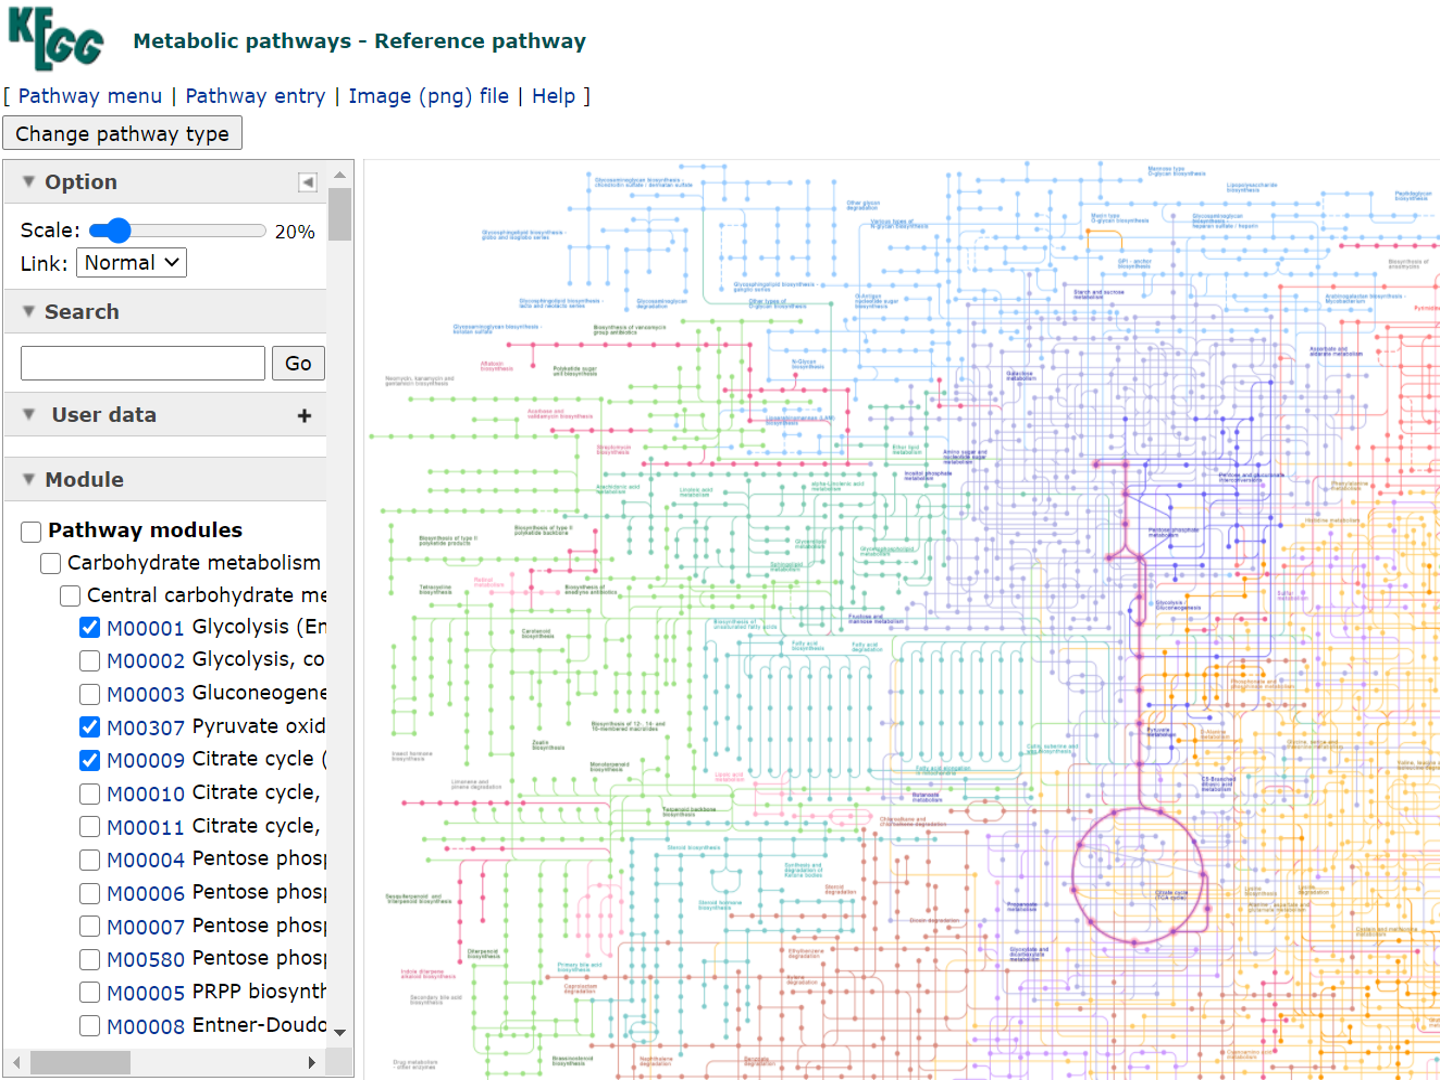
Representation of Metabolic Pathways

§Metabolites are the nodes and reactions connecting them are the edges
§Enzymes that catalyze the reactions label the edges

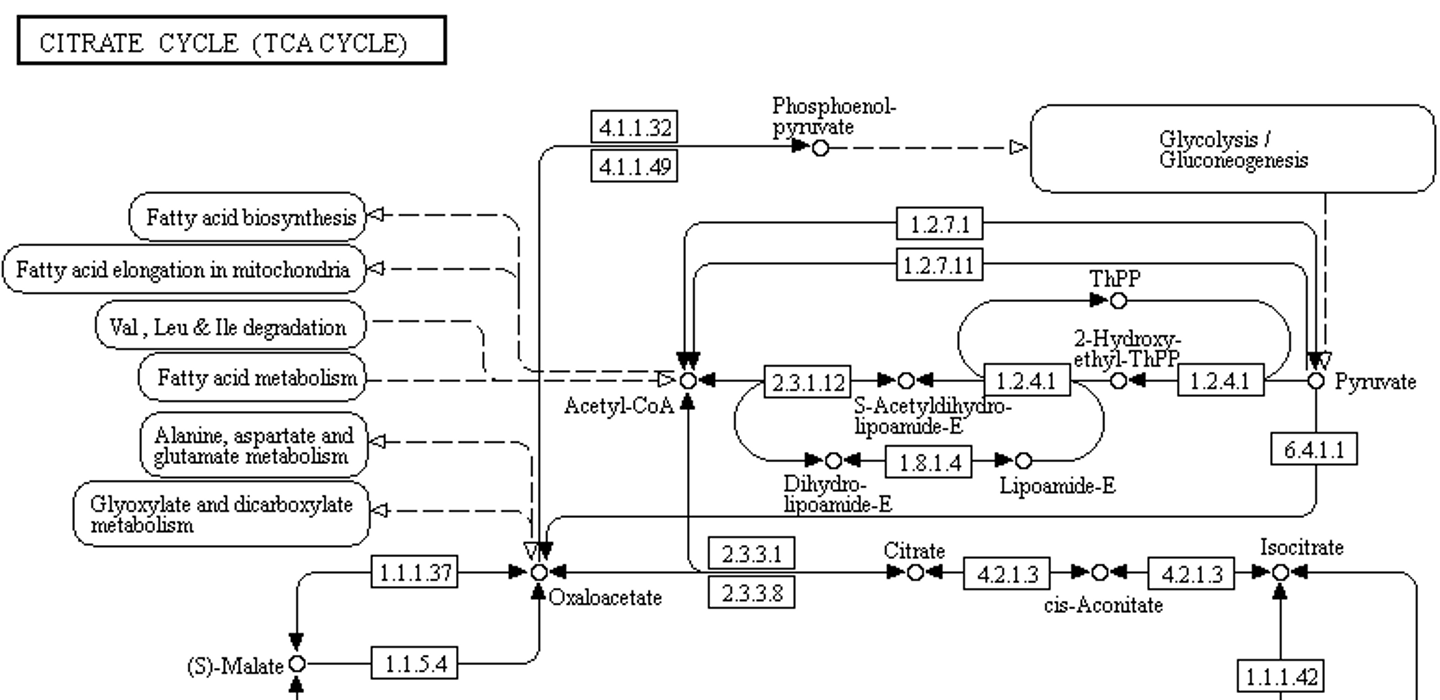
Reference maps depict generalized pathways. They are not species specific, and may never be found in their entirety in a single species