1.4-production possibility curve
1/24
There's no tags or description
Looks like no tags are added yet.
Name | Mastery | Learn | Test | Matching | Spaced | Call with Kai |
|---|
No analytics yet
Send a link to your students to track their progress
25 Terms
what is a production possiblility curve (or frontier)?definistion
The PPC represents the maximum amount of goods/services which can be produced in an economy if all resources are used efficiently. It represents the productive capacity of an economy at a specific point in time.
what does PPC represent?
shows the (opportunity) cost to society of making choices between two different outputs (for example producing different quantities of different goods) and shows combinations of goods that cna be produced in an economy at a particular time. The line shows what is possible if all resources used in production are fully utilised so to produce more of one good we have to produce less of the other.
what does a curved PPC mean?
the curved PPC is more likely due to resources being used where most productive so there will be an increasing opportunity cost rather than a constant one.
Explain a curved ppc using a farmer that wants to produce mroe banans rather than sugar
For example farmers want to produce more bananas they will first use the land that is best for growing bananas and least good for growing sugar.
how can ppc illustrate choices made in an economy?
the curve shows different choices that can be made about how to allocate existing resources and the resultant impact on resource allocation. If we choose to allocate more of the resource to one thing we would have to reduce the amount of the resource we could allocate for the other thing.
How can opportunity cost be measured along the curve?
opportunity cost can be measured along the curve in terms of the sacrifice in the quantity of one good when you choose to allocate more resources to an alternative good
How does a production possibility curve show that scarcity exists?
It shows that there is a limit to the quantity of products that can be produced with existing resources and technology.
what is increasing opportunity cost
Where increased output of one product or service involves an increasing loss of output of an alternative with each additional unit produced
what does production possibility curve diagram illustrate?
the production possibility curve diagram is a graphical representation of the maximum combination of the amount of goods and services that can be produced in an economy per period of time,assuming all resources are beign fully employed
what would happen to a ppc of consumer and capital goods if more capital goods are produced?
the ppc would shift to the right
what would happen to a ppc of consumer and capital goods if we don't produce enough capital goods to replace damaged goods?
the ppc wpuld shift to teh left
what are consumer goods?
things we buy
what are capital goods?
machines,factories and buildings used for production of output/goods
The following diagram shows the production possibility frontier for an economy that produces bread and honey.
If the economy is initially at point W, then the opportunity cost of moving to point X is
6 units of honey.
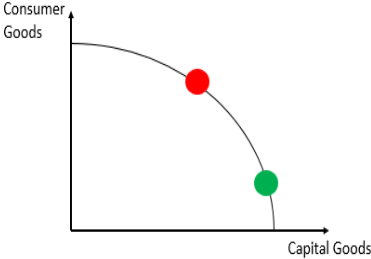
what do points under the ppc curve represent (d)?
they represent inefficient use of existing resources compared with what is possible . In this inefficient situation some resources are not being used
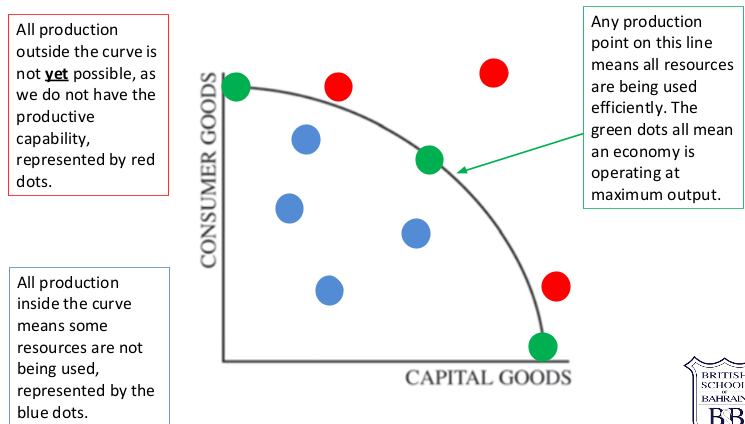
what do poitns on the ppc curve show?
means all resources are being used efficiently. The
green dots all mean an economy is operating at
maximum output.
what do points outside the ppc curve show?
All production outside the curve is not yet possible, as we do not have the productive capability, represented by red dots.
what two condiitons have to be met for a country to be on its PPC?
-all resources are used
-There is efficency in the use of resources-FOP are allocated to their best use/purpose
what is the word movement along the ppc used to describe?
economists use the word movement along a ppc to describe the impact (in terms of output) of the substitution of one form of resource use for another.Movement along a PPC is an opportunity cost.
what do shifts in the ppc represent?
either increased efficency (shifts outwards) or decreasing efficency/productive capacity of an economy (shifts inwards)
What could have caused the change to the left in the economy's production possibility curve ?
natural disaster such as earth quake or war that destroys a large proportion of the economy’s farmland, factories and infrastructure causing a decrease in the productive capacity of the economy-can now produce less of both capital and consumer goods. It could also be due to exhausted resources or lack of investment as capital wears out.
why would ppc shift to the right?
ppc will shift to the right as a result of economies becoming more efficient ,leading to economic growth. This means the economy can produce more goods and services,without necessarily incurring an opportunity cost
what is most likely to cause a shift to the right in the ppc?
-an increase in the quality of factors of production,such as more highly skilled labour achieved through investments in education,research and training. Increased productivity can also be caused by technological advances and improved production techniques
-an increase in the quantity of FOP such as the discovery of new resources,reclamation of land or net migration of labour into a country
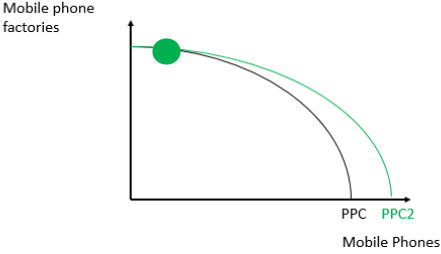
why might the green pints (more capital produced) lead to an outward shift in the PPC?
The increased production of capital goods is more likely to lead to an increase in the use of technology, which will make production more efficient and lead to an expansion in productive capacity.
what happens in asymmetric growth?
The increase in production of mobile phone factories will increase the resources needed to expand production of mobile phones. However, this doesn’t increase the resources regarding production of the factories themselves.