N2NN3 - EIDM: Critical Appraisal of Intervention Studies Exercise
1/104
There's no tags or description
Looks like no tags are added yet.
Name | Mastery | Learn | Test | Matching | Spaced |
|---|
No study sessions yet.
105 Terms
NCCMT Online Learning Module - Critical Appraisal of an Intervention Study
Evidence-Informed Deicision Making
- About applying the best available evidence to answer a specific question
Intervention Studies
- Researchers conduct intervention studies to determine the effect of an intervention on a population
Ex:
- Does using multiple communication channels for a boil water advisory increase the proportion of the population that refrains from drinking untreated water?
- Does giving away free bicycle helmets in schools increase the number of school children who wear bike helmets when riding their bikes?
- Does ginseng prevent common colds?
- Can an intensive educational program reduce rates of teen pregnancy?
6S Pyramid
- Single studies of interventions are at the bottom of the 6S Pyramid as they are not synthesized or pre-appraised forms of evidence
- You would only look at individual studies if you had not found evidence from sources higher in the pyramid
PROGRESS+ Framework
- Outlines factors for equity considerations, including place of residence, race/ethnicity/culture/language, occupation, gender/sex, religion, education, socioeconomic status, and social capital
#1: Are the Results Valid? - Considerations for Critical Appraisal of Intervention Studies
- Did the trial address a clearly focused issue?
Was the assignment of participants to treatments randomized?
- Were participants, health workers and study personnel "blind" to treatment?
- Were the groups similar at the start of the trial?
- Aside from the experimental intervention, were the groups treated equally?
- Were all participants who entered the trial properly accounted for at its conclusion?
#2: What are the Results? - Considerations for Critical Appraisal of Intervention Studies
- How large was the treatment effect?
- How precise was the treatment effect?
#3: How Can I Apply the Results? - Considerations for Critical Appraisal of Intervention Studies
- Can the results be applied in your context? Or to the local population?
- Were all clinically important outcomes considered?
- Are the benefits worth the harms and costs?
Randomized Control Trials
- Where random assignment allows for known and unknown determinants of outcome to be evenly distributed among the groups
- It is the most appropriate design to answer intervention questions
- A randomized controlled trial allows you to be more confident that any differences in the outcome are more likely due to the actual intervention than the underlying differences in the group
- In other words, randomized trials have the greatest ability to control for confounders or bias
*NOT GOOD for Intervention of prevention studies (ex. Public health)
What are the Results? - CASP: 11 Questions to Help You Make Sense of a Trial
Screening Questions:
Did the trial address a clearly focused issue?
- Yes, can't tell, no
An issue can be 'focused' in terms of (the population studied):
- The intervention given
- The comparator given
- The outcomes considered
An issue can be ‘focused’ in terms of:
- The population studied
- The intervention given
- The comparator given
- The outcomes considered
Was the assignment of patients to treatments randomized?
- Yes, can't tell, no
- How this was carried out?
- Was the allocation sequence concealed from researchers and patients?
Were all of the patients who entered the trial properly accounted for at its conclusion
- Yes, can't tell, no
- Was follow up complete?
- Were patients analyzed in the groups to which they were randomized?
- Was the trial stopped early?
Detailed Questions:
Were patients, health workers and study personnel ‘blind’ to treatment?
- Yes, can't tell, no
- Were the patients
- Were the health workers
- Were the study personnel
Were the groups similar at the start of the trial?
- Yes, can't tell, no
- In terms of other factors that might effect the outcome such as age, sex, social class
Aside from the experimental intervention, were the groups treated equally?
- Yes, can't tell, no
Are the Results of the Trial Valid? - CASP: 11 Questions to Help You Make Sense of a Trial
How large was the treatment effect?
- What outcomes are measured?
- Is the primary outcome clearly specified
- What results were found for each outcome
How precise was the estimate of the treatment effect?
- What are its confidence limits?
Will the Results Help Locally? - CASP: 11 Questions to Help You Make Sense of a Trial
Can the results be applied to the local population?
- Yes, can't tell, no
- Do you think that the patients covered by the trial are similar enough to your population?
- How they differ
Were all clinically important outcomes considered?
- Yes, no
- If not, does this affect the decision?
- There is other information you would like to have seen?
Are the benefits worth the harms and costs?
- Yes, no
- Even if this is not addressed by the trial, what do you think?
Evaluation of studies of treatment or prevention interventions. Part 1
Are the Results of the Study Valid?
- This question considers whether the results reported in the study are likely to reflect the true size and direction of treatment effect
- Was the research conducted in such a way as to minimize bias and lead to accurate findings, or was it designed, conducted, or analyzed in such a way as to increase the chances of an incorrect conclusion?
Primary Questions:
- Was the assignment of patients to treatments randomized, and was the randomization concealed?
- Was follow up sufficiently long and complete?
- Were patients analyzed in the groups to which they were initially randomized?
Secondary Questions:
- Were patients, clinicians, outcome assessors, and data analysts unaware of (blinded to or masked from) patient allocation?
- Were participants in each group treated equally, except for the intervention being evaluated?
- Were the groups similar at the start of the trial?
What Were the Results?
- Once you have determined that the results are valid, it is important to gain an understanding of what the results really mean
- If the new treatment is shown to be effective, how large is the effect?
- Is the effect clinically important?
- How precise is the treatment effect (another way of asking how likely it is that the effect is real and not a result of the play of chance)?
- The precision of a result is related to whether the study involved large numbers of people (which increases precision) or small numbers (which reduces precision)
Will the Results Help me in Caring for my Patients
- Firstly, you have to decide if the patients participating in the study are sufficiently similar to your patients, or whether there is a good reason why it would be inappropriate to apply the results to your patients
- Secondly, are there risks or harms associated with the treatment, which might outweigh the benefits?
Allocation Concealment
- Clinical recruiting patients to a study is unaware of the treatment group to which the next patient will be allocated
Intention to Treat Analysis
- Patients should be analyzed in the groups to which they were originally randomized regardless of whether they received or completed the allocated treatment, or even if they received the wrong treatment
Co-Interventions
- Because randomization should ensure that the only systematic difference between study groups is the treatment in question, it is important that this principle is not undermined by extra care given to one group and not another
After Validity Consideration Questions
- What is the size of the effect?
- Is the effect of sufficient clinical significance for you to want to use the intervention?
- In which patients?
Validity - What Were the Results?
- How large was the treatment effect?
- How precise is the estimate of treatment effect?
Validity - Will the Results Help Me in Caring for my Patients
- Are my patients so different from those in the study that the results don't apply?
- Is the treatment feasible in our setting?
- Were all clinically important outcomes (harms as well as benefits) considered?
Dichotomous Outcomes
- Yes or no
- Dead or alive
- Healed or not healed
- Studies that report dichotomous outcomes allow you to compare rates (ex. 49% of school children wearing bicycle helmets in the intervention group versus 20% in the control group)
- These rates can then be expressed in other ways, such as absolute risk difference, relative benefit increase (or the converse, relative risk reduction) or number needed to treat (or the number needed to harm)
Continuous Outcomes
- Length of stay
- Daily intake of food
- Results of studies that report continuous outcomes allow you to compare means (ex. participants in the intervention group walked 6000 steps per day versus 5000 steps per day in the control group)
- Results are often reported as mean differences, which are simply the differences between the means for each group
CER
- Control event rate
EER
- Experimental event rate
Relative Risk Reduction (RRR)
- The proportional reduction in rates of bad outcomes between experimental and control participants in a trial and is calculated as (CER−EER)/CER
Number Needed to Treat (NNT)
- This gives the reader an impression of the effectiveness of the intervention by describing the number of people who must be treated with the given intervention in order to prevent 1 additional bad outcome (or to promote 1 additional good outcome)
- The NNT is simply calculated as the inverse of the ARR, rounded up to the nearest whole number
Estimates of Effect
- Results of trials
Confidence Intervals (CIs)
- A statistical device used to communicate the magnitude of the uncertainty surrounding the size of a treatment effect; in other words, they represent the size of the neighborhood
- If this range is wide, our estimate lacks precision, and we are unsure of the true treatment effect
- Alternatively, if the range is narrow, precision is high, and we can be much more confident
- The sample size used in a trial is an important determinant of the precision of the result; precision increases with larger sample sizes
- CI of an odds ratio or a relative risk includes 1, there is no statistically significant difference between treatments
- Conversely if the CI of a risk or mean difference includes zero, the difference is not statistically significant
- A statistical way to describe our level of certainty or uncertainty about that estimate
- A 95% confidence interval represents the numerical range within which we are 95% certain that the true value of the effect lies
- In other words, if we conducted the study in a similar population, 95 times out of 100 the value would fall within the confidence interval
Absolute Risk Reduction (ARR)
- CER - EER
- Tells us how much of the effect is a result of the intervention itself
Focus a Question
- The most common way to focus a question regarding an intervention is to use PICO – Identifying Participants, Interventions, Comparisons and Outcomes of interest
Questions:
- What question is being addressed in the study? (What population, intervention and outcomes were the authors interested in?)
- Does this intervention address the research question?
- An intervention must address a specific and focused question. Is the question guiding the study too narrow or too broad, or is it logical?
Randomized Control Trials
- Randomized trials are considered the highest level of evidence for a single study
- Since the intervention should be the only difference between the intervention and control groups, randomized trials provide the strongest evidence that differences in outcomes are due to the intervention and not another factor (keep in mind that not all questions can be subjected to a randomized trial due to ethical or practical considerations)
Randomization
- To ensure that the group receiving the intervention and the control group are as similar as possible
- Randomization helps ensure that known and unknown characteristics that might affect the outcome are balanced between groups
- The only way to achieve balance is through randomization
- Some methods pf randomization are susceptible to bias, which may introduce error into the study results
- True randomization is achieved with a computerized random number generator
- Quasi-randomization: Can lead to a bias if there are any systemic differences
Participants Included in the Final Analysis - Intention to Treat
- Excluding dropouts from the intervention group or adding dropouts to the control group would make the intervention look much more effective than it really is compared to the control
- This criterion helps ensure that participants will be kept in the analysis of their original group assignment regardless of whether they discontinue the treatment
- Researchers call this "intention to treat" analysis
- Dropouts are included by substituting either the baseline measurements or the "last observation carried forward" for the final outcome measurement
Blinding (masking)
- Used to describe whether or not people involved in the study (participants, researchers, clinicians, etc.) know whether participants have been assigned to the active intervention group or the control
- Research reports sometimes use the terms "single," "double" or "triple" blinded, but it is more important to specify who was blinded
- In public health studies, it is sometimes not possible to achieve blinding for all groups
- Participants: If participants know whether they are in the intervention group or the control group, they may consciously or unconsciously bias their outcomes
- Health workers: If the clinical or health staff involved with participants know which group their patients are in, they may consciously or unconsciously alter their treatment plan, provide additional care or heighten their vigilance for good or bad outcomes
- Study personnel: Distortion of a measurement may be more likely if an individual required to do the measurement (e.g., blood pressure) knows the group allocation and has a belief about the likely effectiveness of the intervention
- Process of withholding information about treatment allocation from those who could potentially be influenced by this information
- Most commonly used and effective in RCTs to minimize biases
- There is not a discrete difference between single, double, and triple binding; in future there is a need for their to be a distinguished difference
*Unblinded individuals can systemically bias trial findings through conscious or subconscious mechanisms
Similarity Between Groups
- Before the intervention begins, we want to know if there are differences between the groups that could potentially explain differences seen in outcomes at the end
- Randomization should ensure that characteristics are relatively evenly distributed
- Some imbalances arise from a sample size that is too small; others occur by chance
- Researchers will often provide the "adjusted" results, where the adjustment takes into account baseline differences, along with the "unadjusted" results
Equal Treatment of Groups
- If the control group managed to get an additional intervention, it would reduce the potential of seeing a difference in outcomes between it and the intervention group
- If the intervention group managed to get additional care or information, it could magnify the potential differences in outcomes
Size of Treatment Effect
- The benefits and harms of any intervention may be measured by multiple outcomes
- Outcomes may be dichotomous or continuous
- An estimate for treatment effect is only statistically significant if the 95% confidence interval range excludes the value where there is no difference between groups
- If the range for the 95% confidence interval includes this value, then you cannot exclude the possibility that the true value is no difference
- To determine the value for no difference, consider the type of data
- For dichotomous data reported as a relative risk or odds ratio, there is no statistically significant difference between groups if the 95% confidence interval includes 1.0
- For continuous data reported as a mean difference, there is no statistically significant difference between groups if the 95% confidence interval includes 0.0
- Statistical significance can also be shown as the p-value
- By convention, the outcome is statistically significant if the p-value is below 0.05.
Precision of Treatment Effect
- Precision can only be determined by looking at the confidence interval
- If the confidence interval is wide, with a large difference between the numbers at either end of the range, the estimate of true effect lacks precision and we are unsure about the treatment effect
- If the confidence interval is narrow and the two numbers at either end of the range are relatively close, precision is high and we can be more confident in the results
- Larger sample sizes produce more precise results, so be wary of (i.e. less confident in) studies with small sample sizes and large confidence intervals
Applicability of Results
- To judge the generalizability of the study, consider how similar or different the study participants are to your own patients, clients or situation
Consider:
- Health care systems;
estimated costs to deliver the intervention;
skills required to deliver the intervention;
availability of special equipment and staff resources; and
likely acceptability to your community
Consideration of Unfavorable Outcomes
- Researchers may use several different outcomes to evaluate the effects of a treatment or intervention in order to identify the potential benefits as well as the harms of the intervention
Benefits vs. Harms & Costs
- Even if a finding is statistically significant, you need to decide if it is clinically meaningful
- The smallest possible effect size (i.e. the lower end of the confidence interval) can help you decide if an intervention would still be worth doing if the effect is small
- Researchers must also always look for evidence of harm, even when the trial sample size is small
- Systems may also question expenses related to treatments and may ask for an economic (cost/benefit) analysis that may or may not have been included in the study
- When critically appraising an intervention or prevention study, consider whether the researchers examined the most relevant costs and benefits for the intervention and situation
Certificate
Cullum et al., (2008) - pp. 67-91, 104-133
Critical Appraisal Questions for Studies of Treatment or Prevention Interventions
Are the Results of the Study Valid:
- Was the assignment of patients to treatments randomized?
- Was the randomization concealed?
- Was the follow-up sufficiently long and complex (how long patients were followed up in order to see what happens to them as a result of their treatment; patients dropping out of a study before they reach the endpoint)?
- Were patients analyzed in the groups to which they were initially randomized?
- Were patients, clinicians, outcome assessors and data analysts unaware of (blinded to or masked from) patient allocation?
- Were participants in each group treated equally, except for the intervention being evaluated?
- Were the groups similar at the start of the trial?
What are the Results (accounts the size of the treatment effect and whether the estimate of the treatment effect is precise):
- How large was the treatment effect?
- How precise is the estimate of treatment effect?
Can I Apply the Results in Practice:
- Are my patients so different from those in the study that the result don't apply?
- Is the treatment feasible in my setting?
- Were all clinically important outcomes (harms as well as benefits) considered?
Sensitivity Analysis
- Recalculated the results using different assumptions about what might have happened to the lost patients
Intention-to-Treat Analysis
- Patients should be analyzed in the groups to which they were originally randomized regardless of whether they received or completed the allocated treatment, or even if they received the wrong treatment
Selection Bias
- When the investigators (who are likely to want the intervention to be effective) have control over who goes into each group and might choose the intervention group participants on the basis of their likelihood of experiencing a positive outcome
Sample Size of a Trial
Co-Intervention
- Because randomization should ensure that the only systemic difference between study groups is the treatment in question, it is important that this principle is not undermined by extra care given to one group and not the other
Independent Variable
- The intervention
- Those under the control of the investigator
Dependent Variable
- The outcomes
- Those that may be influenced by the independent variable
Nominal Variables
- Categorical
- Simply names of categories
- Variables that have only two possible values (dichotomous)
- May have several possible values (continuous)
- Actual amount of categories is determined by the researcher
- No hierarchy of data
Ordinal Variables
- All sets of ordered categories
- Do not know the size between intervals
Interval Variables
- Consist of an ordered set of categories, with the additional requirement that the categories form a series of intervals that are all exactly the same size
- Does not have an absolute zero point that indicates the complete absence of the variable being measured
- Ratios of the values are not meaningful
Ratio Variable
- Has all features of an interval variable but adds an absolute zero point, which indicates the complete absence (none) of the variable being measured
Measurements in Health Care
- The "real" or true value of the variable being measured, the variability of the measure, the accuracy of the instrument with which we are measuring, and the position of the patient or the skills and expectations of the person doing the measurement
- Objective measures: Less likely to be influenced by human error or bias
- Subjective measures: May be influenced by the perception of the individual doing the measuring
Reliability
- The degree to which a measure gives the same result twice (or more) under similar circumstances, and it may relate to the measure being used or the people using it
- The extent to which readings are similar from the same person (intra-rater; within-rater reliability) or two different people (inter-rater; between-rater reliability)
Validity
- The ability of a measurement tool to accurately measure what it is intended to measure
- S: Requires comparison of a given measure with a gold standard, or the best existing measure of the variable
Social Desirability Bias
- Peoples responses to questions may reflect their desire to under-report their socially unfavourable habits
Recall Bias
- Acknowledges that human memory is fallible
Continuous
- Studies that use continuous outcomes measures may compare the average values of the variable (ex. mean or median after treatment)
- Often compare the mean (or median) values of the outcome at the end of the follow-up period or the average change in outcome for the intervention and control groups from the baseline to the end of the follow-up
- If the average values (or changes) differ between the groups, it suggests that there may be differences in effect between the intervention and the control conditions
Standardized Difference
- Has no units
- It simply expresses the effect of an intervention in terms of the number of SDs between the averages of the two groups
- Puts the average difference in the context of the amount of dispersion or variation
- Allow for comparison of the size of the treatment effect when different outcome measures are used and are therefore used in meta-analyses, which attempt to compare and combine the results of several studies measuring different outcomes
Discrete Measures
- The measure of effect when using discrete outcome compares the risk (i.e. proportion) experiencing an event in the intervention and control groups
- The risk of an event in the intervention group (Ri) is simply the proportion of people in the group who experience the event
Ri = a/a+b
Corresponding Risk:
Rc = c/c+d
Normal
- The symmetrical bell-shaped curve when the values for a large sample are plotted
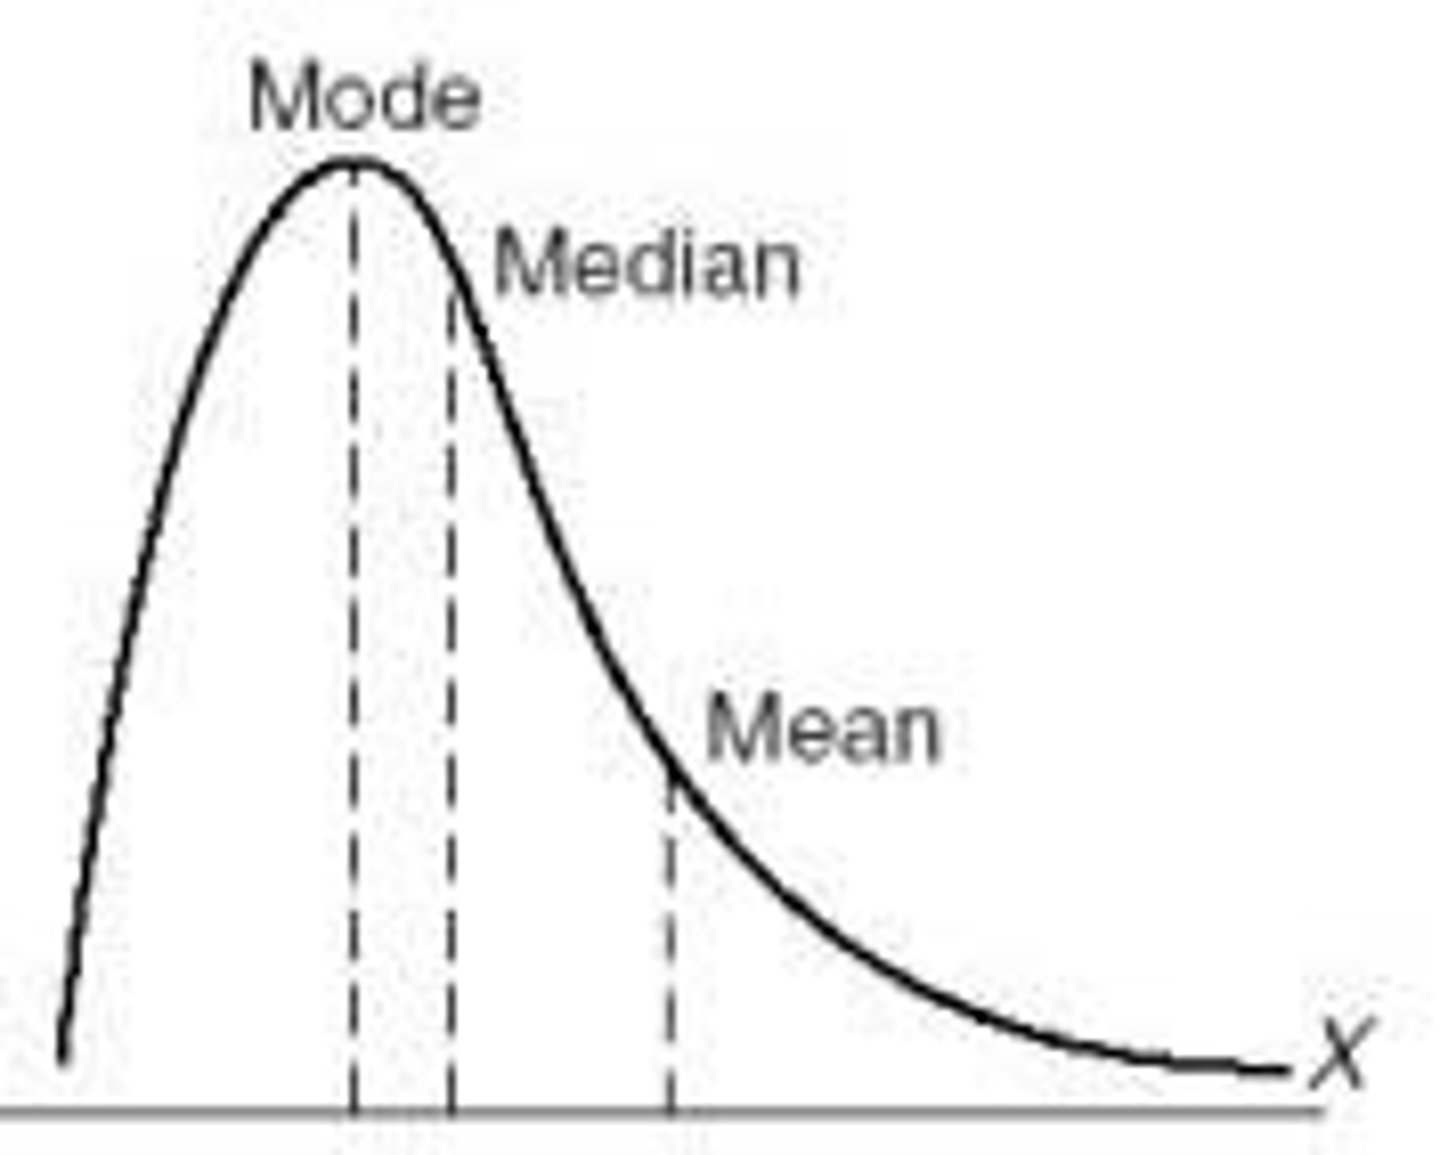
Skewed Distribution (normal distribution)
Interquartile Range
- Between which 50% of all the observations lie
Standard Deviation (SD)
- A measure of the average amount individual values differ the mean of the group; the lower the SD; the smaller the spread of values
Normal Distribution Curve
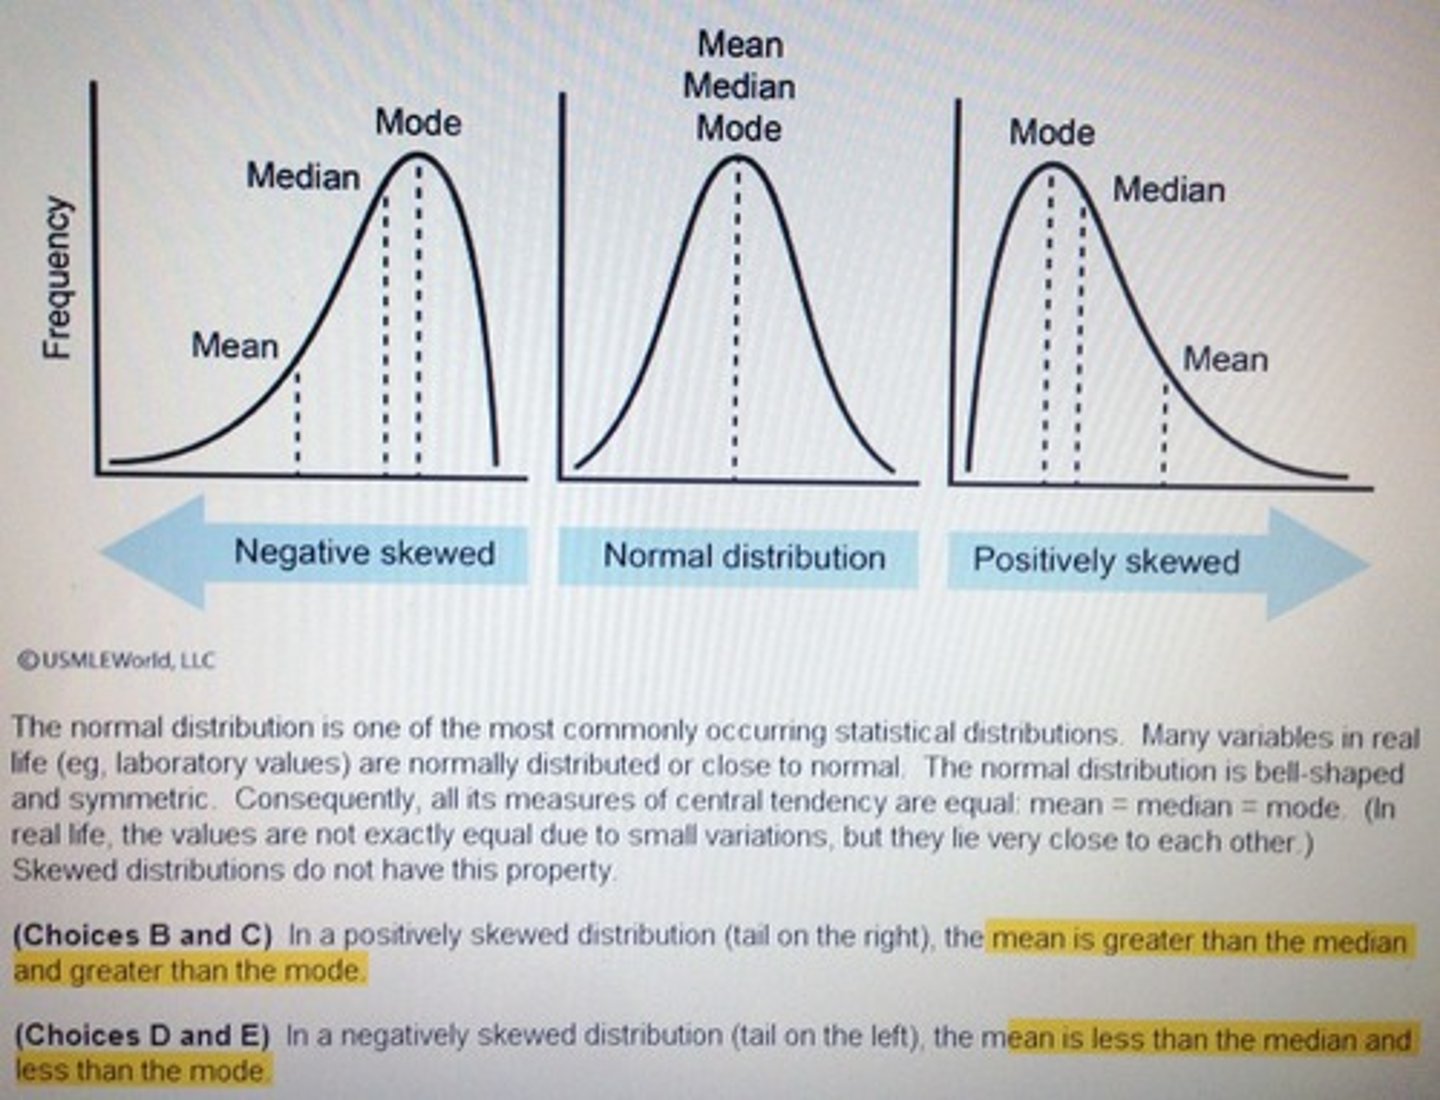
Skewed Distribution Curve
Discrete vs. Continuous Measures
Discrete:
- Outcomes can be summarized as the percentage or proportion of people who experience an event during the follow-up period
- Express the probability or risk that a person in the group of interest experienced the event at some point during the follow-up period
Continuous:
- Often recast as discrete measures in evaluative studies, especially if there is a threshold above or below which there is a clinical difference
- Studies may focus on changes in scores or the percentage of patients with severe impairments
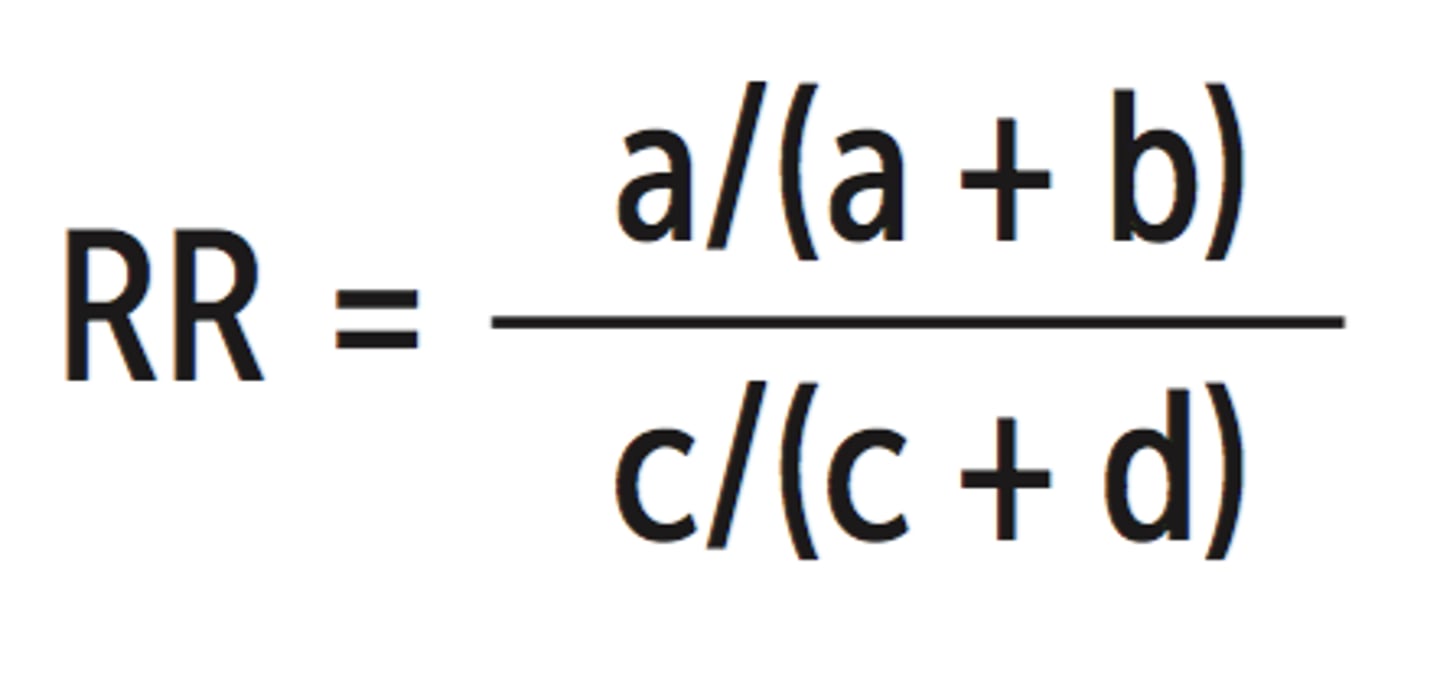
Relative Risk (RR)
- Risk Ratio (RR)
- The risk of patients in the intervention group experiencing the outcome divided by the risk of patients in the control group experiencing the outcome
- The intervention and control conditions have the same effect, then, assuming that the groups are comparable in all other respects, the risk of the event will be the same in both groups (i.e. the top and bottom of the fraction will be the same, and the RR will be 1.0)
- If the risk of death is reduced in the intervention group compared with the control group, then the RR will be <1.0
- If the intervention is harmful, then the RR will be >1.0
- The further the RR is from the 1.0, the greater the strength of association between the intervention and the outcome
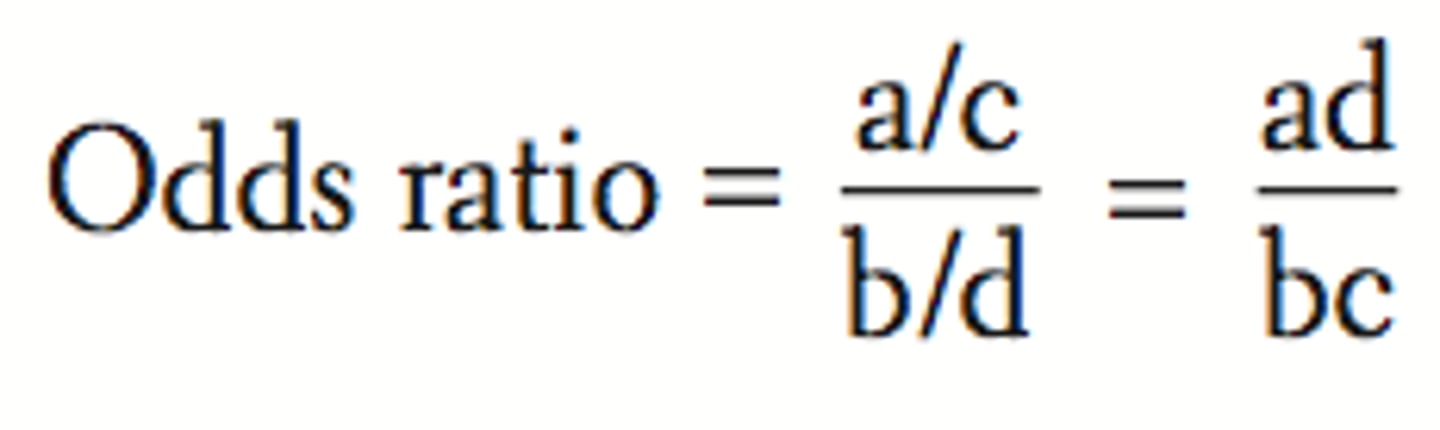
Odds Ratio (OR)
- The odds of the event in the intervention group (a/b) divided by the odds of the event in the control group (c/d)
- An OR of 1.0 means there is no difference between groups, and an OR <1.0 means that the event is less likely in the intervention group than the control group
RR & OR
- Measures the strength of association between an intervention and an outcome
- It is important to remember that the RR indicates the "relative" benefit of a treatment, not the "actual" benefit; in other words, it does not take into account the number of people who would have developed the outcome anyways
Absolute Risk Difference
- The impact of treatment is captured by the absolute risk difference, or when the risk is reduce the absolute risk reduction (ARR)
- Calculated simply subtracting the proportion of people experiencing the outcome in the intervention group from the proportion experiencing the outcome in the control group
Number Needed to Treat (NNT)
- Conveniently expresses the absolute effect of the intervention
- Simply divided by the absolute risk difference
- Represents the number of patients who need to be treated to prevent one additional event and is a useful way of expressing clinical effectiveness (i.e. the more effective an intervention, the lower the NNT)
Risk Reduction
- Occurs when the risk of a bad event decreases
Benefit Increase
- Occurs when the risk of a good event increases
Risk Increase
- Occurs when the risk of a bad event increases
Benefit Reduction
- Occurs when the risk of a good event decreases
Sampling Distribution of Study Results
- Not all studies give the same results due to sampling error
- Standard error (SE)
Mean Difference or Relative Risk Reduction
- If we repeat the same evaluation several hundred times with different samples of the same number of patients, the result would not always be the same
Distribution of the Results
- Shape of the curve
Standard Error (SE)
- The amount of chance variation from the "true" effect is given by the measure of spread or standard deviation of this distribution, which, because it indicates the amount of random sampling error (SE)
- The largest SE, the more individual study results will vary away from the true effect
Confidence Interval (CI) - 95%
- It provides a plausible range within which we are confident the true value falls outside of this range
- Wider the Ci, the less precise is out estimate of the treatment effect
- This precision depends on the spread of the sampling distribution measured by the SE
- This in turn depends on the sample size and the variability of what is being measured
- The smaller the number of patients in a trial or number of events observed, the greater will be the sampling error or the spread of the sampling distribution
- The greater the sampling error, the more likely it is that any one experiment will differ by chance from the true or average value, and so the wider CI
- If we increase the number of participants in a study or the number of people who are likely to experience an event such that the distribution becomes less spread out, individual study results will fall much closer to the true or average result, and the SE and the width of the CI will be reduced
- Can be used to give an idea of whether or not a treatment has any effect
- The CI of an odds ratio or relative risk includes the value 1 (i.e. same odds or risk in treated and untreated groups), then we cannot be confident that a difference exists between the intervention and control conditions
Null Hypothesis
- Instead of trying to estimate a plausible range of values within which the true treatment effect is likely to lie (i.e. a CI), researchers often begin with a formal assumption that no effect exists
- Study is used to gather enough evidence to convince a neutral observer to reject the null hypothesis and to accept, the alternative hypothesis that the treatment does have an effect (or that the defendant is guilty)
- If the estimate of treatment effect is more than 1.96 SE above or below the null value, then the probability of this or a more extreme result occurring by chance when the null is, in fact, true is less than 5% (p<0.05)
- If the result is more than 2.58 SE above or below zero, then it is regarded as statistically significant at the 1% level (p<0.01)
Type I Error - The Risk of a False-Positive Result
- To reject the null hypothesis falsely (i.e. to say that a treatment effect exists when, in fact, the null is true)
- The risk or probability of this type of error is given by the p-value or statistical significance of the treatment effect
- The lower the p-value, the less likely it is that the result is a false positive and the lower the risk of a type I error
Type II Error - Risk of a False-Negative Result
- Where we wrongly accept the null hypothesis of no treatment effect
- This is a particular problem of small studies because they have more sampling error and so larger SEs
- The larger the Se, the harder it is to exclude chance, and therefore the greater the probability of falsely accepting the null hypothesis of no treatment effect
- In small studies, even large estimates of treatment effect do not provide sufficient evidence of a true effect (i.e. they are not statistically significant) because the SE is so large
- If a study is too small, the Cis can be so wide that they cannot really exclude a value indicating no effect
- When a study is undertaken, the sample size should be sufficiently large to ensure that the study will have enough power to reject the null hypothesis if a clinically important treatment effect exists
Tests for Different Types of Outcome Measures
*Type of outcome measure also affects the type of statistical test used to determine the extent to which an estimate of treatment effect is due to chance
Continuous Measures
- The treatment effect is often calculated by measuring the difference in mean improvement between groups
- In these cases (if the data are normally distributed), a t-test is commonly used
Categorical Variables
- When a study measures categorical variables and expresses results as proportions, then a X^2 (chi-square) test is used
- Assesses the extent to which the observed proportion in the treatment group differs from what would have been expected by chance if no real difference existed between the treatment and control groups
- If an odds ratio is used, the SE of the odds ratio can be calculated and, assuming a normal distribution, 95% Cis can be calculated, and hypothesis tests can be conducted
Paired Analysis
- For normally distributed continuous measures, one can use the paired t-test
- For skewed continuous paired data, the Wilcoxon signed-rank test is available
*The design of the comparison is paired or matched, the analysis must also be paired
Clinical Significance
- Clinical significance is not the same as statistical significance
Allocation Concealment
- The clinician recruiting patients to a study should be unaware of the treatment group to which the next patient will be allocated
Random Allocation
- Intervention groups remain the inly method of ensuring that the groups being compared are on an equivalent footing at the beginning of a study, thus eliminating selection and confusing biases
- Allocation Concealment: Shiels those involved in a trial from knowing upcoming assignments in advance. Focuses on preventing selection and confounding biases, safeguards the assignment sequence before and until allocation, and can always by successfully implemented
- Blinding: Concentrates on preventing study participants and personnel from determining the group to which participants have been assigned (which leads to ascertainment bias), safeguards the sequence after allocation, and cannot always be implemented. Everyone unaware of patient allocation to avoid bias. Reduces bias. Double blinding defined as blinding patients, clinicians, and outcome assessors. Triple blinding no longer and is replaced with descriptions stating which if the groups were unaware of allocation
Relative Risk Reduction
- A measure of the effect of an intervention
- Defined as the proportional reduction in rates of harmful outcomes between experimental and control participants in a trial
- Fails to discriminate huge absolute effects of the intervention from those that are trivial
- Has limitations because it fails to discriminate huge absolute effects of the intervention from those that are trivial
- Calculated as (CER-EER)/CER
Baseline Risk
- When the RRR ignores how rarely or commonly the outcome in question occurs in the patients entering the trial
Absolute Risk Reduction
- Does not discriminate between the extremes
- The AAR is dimensionless, abstract number that may be difficult to incorporate into clinical practice, we divide the ARR into 1 (or 100%) to generate the NNT
- If the AAR is large, only a small
- The absolute arithmetic difference in rates of harmful outcomes between experimental and control patients
- = CER-EER
NNTs
- Useful measure for making decisions about the effort expended with a particular intervention to achieve a single positive outcome
- Only useful for interventions that produce dichotomous outcomes (counts of the number of people who experience and do not experience an event)
- Should always be interpreted in the context of their precision
- Interpretation of NNTs must always consider the follow-up time associated with them
- NNTs will vary with baseline risk: The lower the baseline risk, the higher the NNT will be