Geography #9: Population
1/54
There's no tags or description
Looks like no tags are added yet.
Name | Mastery | Learn | Test | Matching | Spaced | Call with Kai |
|---|
No analytics yet
Send a link to your students to track their progress
55 Terms
Define population.
The number of all the inhabitants living in an area.Define population density.
Define population density.
The amount of people living in an area of land.
What does densely populated mean?
Many people in a small area.
What does sparsely populated mean?
Few people in a large area.
How is population density calculated?
Population density = total population / total land area.
What is underpopulation?
When there are more resources available than the population can use effectively.
What is overpopulation?
When there are too many people for the resources available.
What is optimum population?
The balance between the number of people and the resources available.
Why has their been a rapid increase in the world population?
Because the death rates have fallen faster than birth rates.
What are some probelms of rapid population growth?
Its slows down their development. Countries find it difficult to feed everyone, provide schooling, and basic healthcare. Resulting in millions going hungry, no education and skills to decrease poverty and develop, and millions suffering and dying of illness and disease.
Why are there are less death rates?
Better medical care means diseases are treated more successfully.
Vaccination reduces deaths from infectious diseases.
Improved sanitation and clean water reduce spread of disease.
Better food supply reduces famine and malnutrition.
Improved housing and living conditions increase life expectancy.
What causes overpopulation?
High birth rate, falling death rate, and limited resources.
What is the consquences of overpopulation?
Increased pollution & crime rates, unemployment & underemployment, food and water shortages, and pressure on services (healthcare & education).
What are the causes of underpopulation?
Low birth rate, high emigration, ageing population.
What are the consquences of underpopulation?
Labor shortages, Slow economic growth, Services become expensive to maintain, Fewer taxpayers, brain drain.
What are the three factors that cause changes in a country's population?
Births, deaths, and migration.
What is the birth rate?
Number of live births per 1000 of the population.
What is the death rate?
Number of deaths per 1000 of the population.
What is migration?
Movement of people into or out of a country.
What is natural change?
A change in the population caused by births and deaths.
Birth rate − death rate
What is natural increase?
When the birth rate is higher than the death rate.
Define natural decrease.
When the death rate is higher than the birth rate.
What causes natural increase to happen?
High Birth Rate & Low Death Rate
What are some causes that leads to high birth rates?
Children needed for farm work, Lack of contraception, early marriage, Religious beliefs, need for children to support parents later.
What are some of the causes that leads to falling death rates?
Better healthcare, better nutrition, cleaner water, and increased use of sanitation.
How does natural decrease happen?
Low Birth Rate & High Death Rate.
What are some reasons for low birth rate?
Women educated and working, Family planning & Concetraption available, High cost of raising children, Later marriage, Urbanization.
What are the factors that cause the natural population to change?
Social factors, with women being educated, they focus more in their carrerr, lowering the birth rate. Later marriage lowers birth rate. Economic factors, with poverty often increases birth rate and wealth and urbanization usually lowers birth rate. Government policies such as family planning programmes reduce birth rate and healthcare investment lowers the death rate. Disease such as HIV/AIDS increases the death rates because it weakens the immune system, reduces life expectancy, and leaves fewer working adults. It can also lower birth rate because fewer adults will survive to reproductive age.
What are population policies?
Policies created by the government to either reduce or increase population growth.
What type of policies can result in low birth rates?
Anti-natal policies
What are some examples of anti-natal policies?
Withdrawing tax allowance from people with large families.
Giving incentives through cash and priority for school places.
With the media and posters.
Fines for extra children
Family planning campaigns
What are the advantages and disadvantages of anti-natal policies?
It slows population growth and puts less pressure on resources. But it leads to an ageing population, labor shortage, and gender imbalance.
What type of policies can result in high birth rates?
Pro natalist policies.
What are some examples of pro-natal policies?
Child benefits, Paid maternity leave, Tax reductions
What are the advantages and disadvantages of anti-natal policies?
There will be more workers in the future and it supports the ageing population. However, it’s expensive for the government and results take many years.
Population growth or fall is calculated by…
Natural Change + Net Migration
What is net migration?
Number of Immigrants - Number of Emigrants
What is the dependency ratio?
A demographic measure that compares the number of people who are typically not in the labor force (the young and eldery) to the number of people, typically in the labor force (working-age adults).
How is the dependency ratio calculated?
Young (0-14) + Eldery (75+) / Working-age population (15-64) X 100%
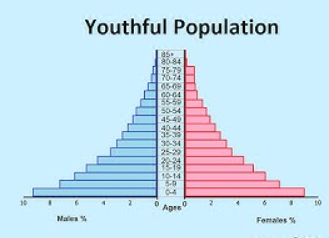
What is a young population in relation to a population pyramid?
A population pyramid that displays a population percentage of ages 1-14 over 30% and ages 75 and above under 6%.
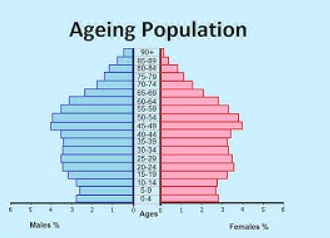
What is an ageing population in relation to a population pyramid?
A population pyramid that displays a population percentage of ages 1-14 under 30% and ages 75 and above over 6%. This is due to a declining birth rate and lower death rates, with more people living longer.

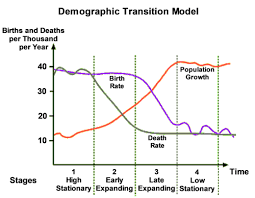
What are the characteristics of Stage 1 in a Demographic Transition Model?
High birth and death rates, total population is low but is balanced due to high birth rates (36/37 per 1000) and death rates (36/37 per 1000). Countries are undeveloped at this stage but there are none as of today.

What are the reasons for the high birth and death rates in Stage 1?
High birth rates - Lack of access to contraception, women marry young, high infant mortality so more are born in the hopes they survive, needed for farming, no family planning, and religious and social encouragement.
High death rates - Poor healthcare, disease, famine, and many children die.

What is an example of Stage 1?
Remote tribes in tropical rainforests, isolated from the rest of the world.

What are the characteristics of Stage 2 in a Demographic Transition Model?
The death rates falls rapidly while the birth rate remains high. Total population will start to rise as a result of the falling death rates (around 18/19 per 1,000).

What are the reasons for the high birth rates and falling death rates in Stage 2?
High birth rates - Lack of access to contraception, women marry young, high infant mortality so more are born in the hopes they survive, needed for farming, no family planning, and religious and social encouragement.
Falling Death Rates - Improved medical care, cleaner water, more and better food, improved sanitation, and a decrease in infant mortality.

What is an example of Stage 2?
Poor countries with low levels of economic development, such as Niger, Egypt, Kenya, India, and Mali.

What are the characteristics of Stage 3 in a Demographic Transition Model?
The birth rate falls rapidly (down to around 18 per 1000). Death rate continues to fall but more slowly and steady (to 15 per 1000). Total population is rising rapidly. The gap between birth and death rates will narrow.

What are the reasons for the falling birth and death rates in Stage 3?
Birth rate - Fewer people are farmers who need children to work on the land, available birth control, decreased infant mortality, women are staying in education longer and marrying later, increased desire for material possessions than large families.
Death rate - Improved medical care, cleaner water, more and better food, improved sanitation, and a decrease in infant mortality.

What is an example of Stage 3?
Countries with improving economical development, such as India and Brazil.

What are the characteristics of Stage 4 in a Demographic Transition Model?
Birth rates and death rates are both low and usually balanced. Total population is high and growing slowly. Its balanced by the low birth rate (15 per 1,000) and death rate (12 per 1,000). Contraception is widely available and there is a social desire to have smaller families.

What are the reasons for the low birth and death rates in Stage 4?
Birth Rates - Birth Control, people are having the amount of children they want.
Death Rates - Improvements in medical care, cleaner water, more and better food, and improved sanitation.
What is an example of Stage 4?
Richer countries which are more economically developed, such as the USA, Japan, UK and France.

What are the characteristics of Stage 5 in a Demographic Transition Model?
Both rates remain relatively low, but the death rate (9 per 1,000) is higher than the birth rate (7 per 1,000), leading to a declining population. It will gradually age and be dominated by older people.

What is an example of Stage 5?
Richer Countries, such as Germany, Japan, and Italy.