simple t test
1/61
There's no tags or description
Looks like no tags are added yet.
Name | Mastery | Learn | Test | Matching | Spaced | Call with Kai |
|---|
No analytics yet
Send a link to your students to track their progress
62 Terms
a test statistic indicates that the sample data is
converted into a single specific statistic used to test the hypothesis
most test statistics
have the same basic structure and serve the same purpose as the z score
the difference between the sample mean (M) and the hypothesized population mean from the null hypothesis
(m - μ) larger difference indicates larger t value and more likely to reject null
the greater the difference between the sample mean and the population..
the bigger the z score
negative z scores will have the tail on the right
false
a sample underestimates the
variance
the sample with a n=8 will have __ degrees of freedom
7
high variability has patterns that are ___ to see
difficult
if the following 2 distribution are both converted to z score distributions their means will be the same
true
when standardizing a distribution the sample of the z score will be
the same
what does the CLT tell us about the distribution of sample means
if the shape is normal( BELL SHAPED), if the intiial population is normal or n > 30, THE MEAN OF THE DISTRIBUTION OF SAMPLE MEANS IS RQUAL TO THE MEAN OF THE ORIGINAL POPULATION
standard error allows us to estimate the difference between the sample mean and
the population mean
The CLT applies
the distribution of sample means for any population
the law of large numbers state that the larger the sample size
the smaller the error between the sample mean and the population mean
the standard deviation of a distrubiton of sample means is
the standard error
the shape of the distribution sample means with an n = 30 is
normal
critical region is determined by
the alpha level
type I errors are
the result of a very unlikely sample
as the s.d increases
the z gets smaller adn you are less likely to reject the null
as the number of tails increases
you are less likely to reject the null
a sample with the mean of 7 once transformed
the 7 will have a z score of 0
the numerator of a z score =
the deviation score
if you multiple the constant to each score in a distribution the standard deviation
increases by the constant
z score transformation..
relabels the values along the x axis
why is the variability of a sample less than the variability of the population
the sample has less extreme scores
variability of the scores
is measured by the standard deviation or the variance or in this case the standard error
as variability gets larger
the smaller the z score
the number of scores in the sample:
the larger the z score
what test can reject with smaller difference between sample mean and population mean
one tailed test can reject with smaller difference between sample and population
level of significance: a=.05, one tailed
±1.64
level of significance: a=.05, two tailed
±1.96
level of significance: a=.01, one tailed
±2.33
level of significance: a=.01, two tailed
±2.58
what is the problem with z score
it assumes population standard deviation is known need σ to compute standard error
the denominator of hte z score is
standard erro
σ tells us
how much scores vary in the entire population
standard error tells us
how much sample means vary from sample to sample
if the value of the real standard error is unknown 𝝈M
an estimated standard error (Sm) is used to estimate the real standard error
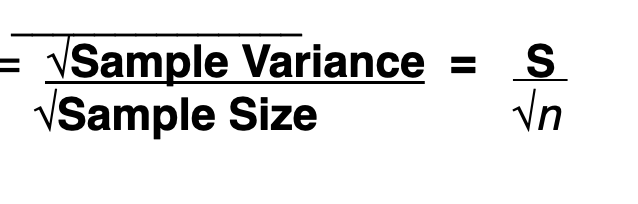
estimated standard error is computed with the
sample variance S² or sample standard deviation , S
estimated standard error provides
provides an estimate of the standard distance between a sample mena, M and the population mean µ
estimated standard error formula
t test
when calculating sample variance using n-1 you get
a better t stat closer resembles a z score
t distribution is normal
tends to be a little flatter and spread out than the z distribution
t distrubtion is the complete set of t values for
every possible random sample for a specific (n)
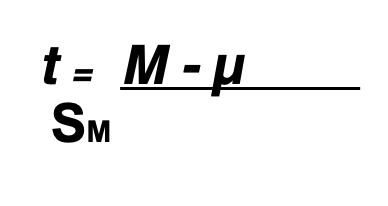
to compute a t statistic you only need
a null hypothesis and a sample from the unknown population
simple t test for
one sample and dont know the population standard deviation
what factors influence the outcome of a t test
size of n and magnitude of vairance
larger n…
increases the likelihood of rejecting the null
larger variance
reduces the likelihood of rejecting the null
larger variance
smaller t test
research design that uses a separate group of subjects for each treatment condition
independent measure research design
independent treatment design hypotheses
tests for data from 2 separate samples
independent treatment design evaluates the
mean difference between 2 treatment conditions
goal of independent measures research study
evaluate the mean difference between 2 populations or between 2 treatment conditions
difference between means is
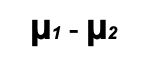
2 sampl means (M1-M2) to evaluate the hypothesis about
2 population means (µ1 - µ2)
in an independent measures study the t =
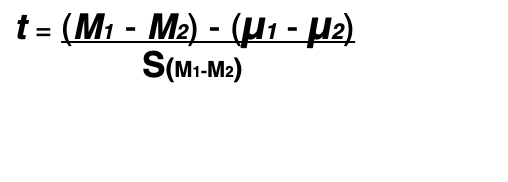
S(M1-M2) measures
the expected error when a sample mean difference represents a population mean difference
with independent measures t, the difference betwee nsample means is divided by the
estimated standard error associated with the sample mean difference
standard error of M1-M2
a measure of tje standard or average distance between a sample statistic and population parameter
estimated standard error of M1 - M2 tells us
how much difference to reasonable expect between 2 sample means if the null is true (Ho: µ1 = µ2)