Descriptive Statistics
1/108
There's no tags or description
Looks like no tags are added yet.
Name | Mastery | Learn | Test | Matching | Spaced | Call with Kai |
|---|
No analytics yet
Send a link to your students to track their progress
109 Terms
Descriptive Statistics
Summarize/report general data
Inferential Statistics
Draws conclusions from data that have random variation
Research Process
Make a question
Research theories
Make hypothesis, prediction
Identify variable and measure
Analyze data
Generalize data
Population
Complete set of events interested in
Parameter
Numerical value summarizing population data
Sample
Set of observations of subset of population
Statistic
Numerical value summarizing sample data
Random Sampling
Every member of population has equal chance on inclusion
WEIRD
Western, Educated, Industrialized, Rich, Democratic
Sampling Variation
The statistics measure can vary from different samples, based on who you choose
Variable
Property of an object/event that can take on different values
Factors
IV, have an effect on the DV
Scores
Measurements/values, both DV and IV must be with measurement scales
Nominal
Classify by labelling items for qualitative data, no stats can be performed
Ordinal
Uses numbers to give items a ranked order so each get a property of magnitude but not equal intervals or tells difference between points
Interval
Numbers indicate order and absolute intervals between are meaningful because no rational 0
Ratio
Numbers indicate order, have interval, meaningful
Discrete/Categorical
Takes a set of possible values, nominal values are always discrete
Frequency Graphs
Visualize data to show frequency of how often a value appears in the measurement using only DV
Ceiling Effect
Data has cutoff, or clustered near the top
Bistable Perception
Brain perceives ambiguous stimuli as exclusive interpretations
Ceiling Round
Round up to nearest whole number
Modality
Number of peaks in data
Causes for Bimodal Distribution
Sexual dimorphism, ages, contamination
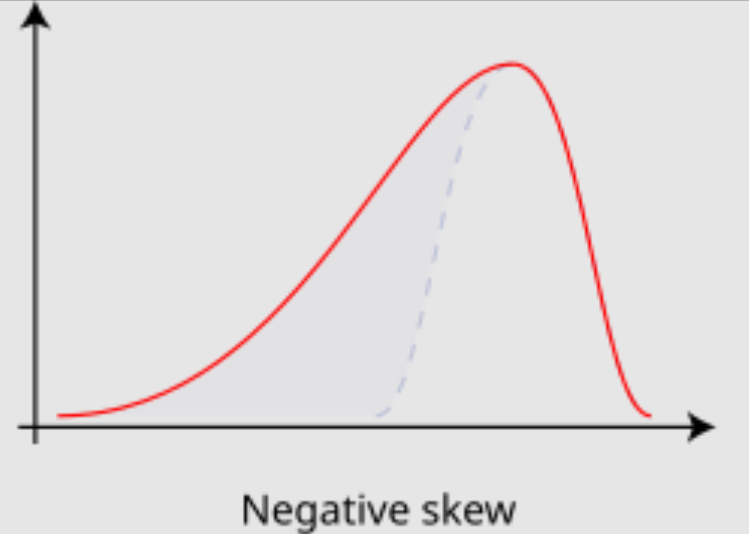
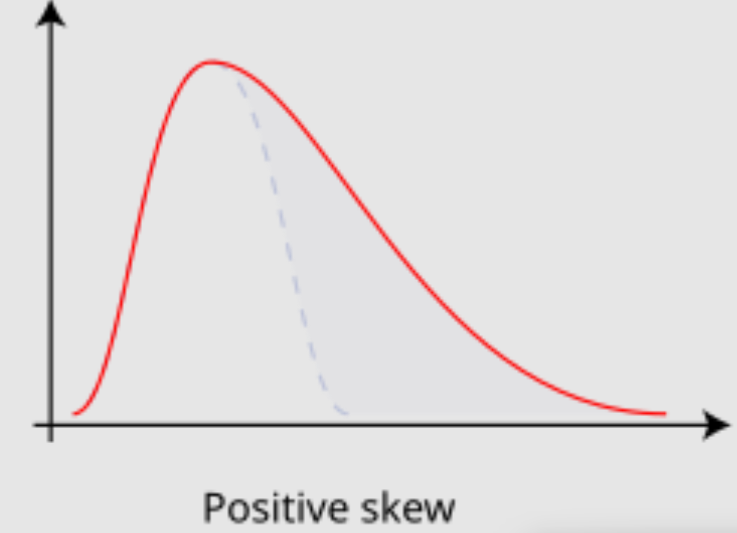
Skew
How asymmetrical an unimodal distribution is about peak
NegativeSkew
More distribution is to a smaller value
Positive Skew
More distribution is to larger value
Kurtosis
How tails of unimodal distribution are aorund the peak
Positive Kurtosis/Leptokurtic
More clustering near the average
Negative Kurtosis/Platykurtic
More variation of data
Proportion
Relative frequency based on the total of number of observations (put in decimals)
Mode
Shows values in data, works on nominal data
Can change based on how bins are divided
Median
Not affected by extremes
Can’t perform statistics, not very stable
Mean
Can be biased and values may not exist in data
Quartiles
Dividing data into four sections evenly
Interquartile Range
Describe range of the middle 50% distribution
Trimmed Statistics
Data with removed parts
Box and Whisker Plots
Displays Q1,Q2,Q3 as boxes, using the IQR as error bars
Drawing Box and Whisker Plots
Draw a line as median
Draw Q1, Q3 to create a box around the median
Multiply IQR by 1.5 and subtract bounds by that value to find a value no more than it as the error bars
Draw asterisks to show outliers
Violin Plots
Combines box plot with kernel density plot to show summary statistics with probability density of continuous numerical data
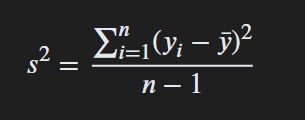
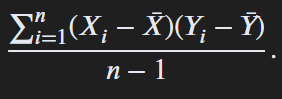
Variance
Subtracting data point from the mean, then averaging it
Variance Equation
Standard Deviation

Ȳ
Mean of sample
μ
Mean of population
σ
Standard deviation of population
Population Parameter
Everything is measured, average isn’t estimated therefore no dfs
Sample Statistics
Ȳ estimate, therefore dfs for further calculations
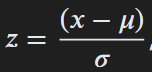
Z Scores
Transforming data into standardized z scores
Positive Z Scores
Observation is above the mean
Negative Z Scores
Observation below the mean
Floor Effects
Data is clustered near the bottom because test too hard
Regression
How the typical value of DV changes when IV changes
Covairance
Degree that 2 variables vary together
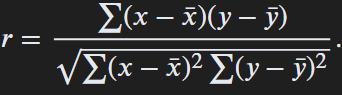
Correlation Coefficient
Standardizes covariance
r = 1
X and Y are perfectly correlated
r = 0
No relationship
r = 0.1-0.3
Weak correlation
r = 0.3-0.5
Moderate correlation
r = >0.5
Strong correlation
Curvilinear
Best fit line isn’t straight
Monotonic
As x increases, y increases or decreases
Nonmonotonic
As x increase, Y reverses once or more
rs
For ranked/ordinal variables to tell how monotonic the relationship is
rpb
For dichotomous and continuous variable
rphi
For dichotomous variables
Factors Affecting Correlation
Range restrictions
Heterogenous samples
Non linear data
Extreme observations
Range Restrictions
Some cases must have areas restricted
Heterogenous Samples
Data which sample of observations could be divided into distinct set based on variable
Non linear data can have
The same r
Correlation
Shows relations to another casual factor, that can change over time or a coincidence
Regression
How typical value of dependent value when independent chances (best fit line)
Interpolation
Estimating something in data range but not on measured
Extrapolation
Estimating beyond data range
Residual
Difference between data and model line
Least Squares Regression
Line of best fit that minimizes the sum of the squared
SSresiduals
How good model fit is with a better model getting a smaller SS
SStotal
Measuring fit to a mean line
R2
Percentage thar variation of Y is accounted by X
If SSr < SSt
R2 = 1, linear model fits better than mean
If SSr > SSt
R2 = 0, linear not better than mean
R2 = 1
Explains all variation
Multiple Regression
The dependent value may be correlated with many independent values, by applying many linear regressions, it quantify strength between DV and certain IV
Event
Outcome of an experiment
Probability
Ratio of occurrence of the specific event to all occurrence of events
Analytic View
Investigating trends, patterns with data
Frequentist View
Long run frequency of an event happening over repeated trials
Subjectivist Probability
Represents subject’s belief in likelihood of an event
Joint Probability
A and B happen in an experiment p(A∩B)
Union of Events
A or B happen in an experiment, p(AUB), both can’t be true
p(AIB)
Conditional probability
Statistical Independence
Occurrence of an event has no effect on the probability of another
Mutual Exclusion
Event A and B can’t happen at the same time, p(AIB) = 0
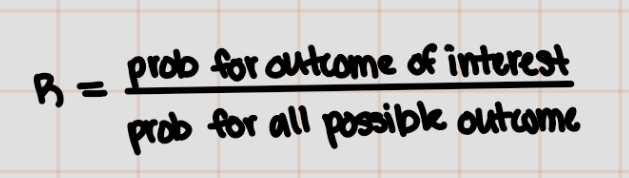
Risk
Chance of something based on all possible outcomes
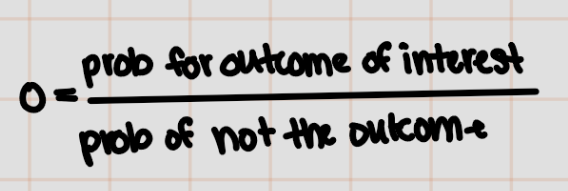
Odds
Chance of something based on outcome not occurring
Odds Ratio
Comparison of events to each other
Odds = 1
Same odds for both scenarios
Greater than 1 Odds
A number times the numerator odds
OR < 1
Placebo has a stronger effect
OR > 1
Treatment has a stronger effect